Owatonna: Fire Incidents, Minnesota (MN)
Where are fire incidents reported in Owatonna, MN
Something went wrong! Please refresh the page.
| Fire incidents reported | |
|---|---|
| Sreet name | Count |
| CEDAR AVE | 90 |
| BRIDGE ST | 82 |
| SCHOOL ST | 72 |
| I-35 | 70 |
| 18 ST | 46 |
| ELM AVE | 46 |
| HWY 14 | 40 |
| 18TH ST | 32 |
| CR 45 | 32 |
| 24TH AVE | 30 |
| BROADWAY ST | 30 |
| FRONTAGE RD | 30 |
| STATE AVE | 30 |
| HOFFMAN DR | 24 |
| LEMOND RD | 24 |
| ROSE ST | 24 |
| ST PAUL RD | 24 |
| 22 ST | 22 |
| MINERAL SPRINGS RD | 22 |
| VINE ST | 22 |
| GROVE AVE | 20 |
| NORTH ST | 20 |
| OAK AVE | 20 |
| 13TH ST | 18 |
| 14 HWY | 18 |
| 22ND ST | 18 |
| 24 AVE | 18 |
| 28TH ST | 18 |
| ACADEMY ST | 18 |
| 13 ST | 16 |
| Other | 277 |
2002 - 2018 National Fire Incident Reporting System (NFIRS) incidents
- Incident types reported to NFIRS in Owatonna, MN
- 1,25329.4%Fire
- 82919.4%Hazardous Condition
- 81319.1%False Alarm
- 60714.2%Rescue & EMS
- 42810.0%Good Intent Call
- 3017.1%Service Call
- 120.3%Severe Weather
- 110.3%Overpressure Rupture
- 90.2%Special Incident
- Fire incident types reported to NFIRS in Owatonna, MN
- 56745.3%Structure Fires
- 38831.0%Outside Fires
- 27221.7%Mobile Property/Vehicle Fires
- 262.1%Other
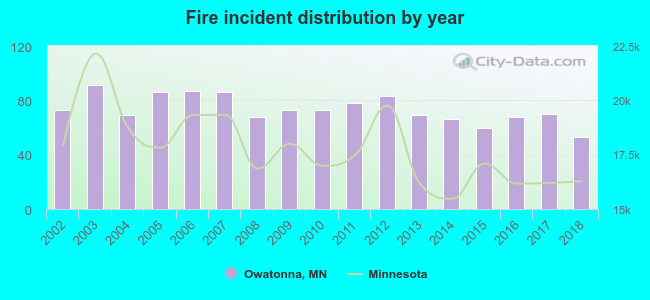 According to the data from the years 2002 - 2018 the average number of fire incidents per year is 74. The highest number of fires - 91 took place in 2003, and the least - 53 in 2018. The data has a dropping trend.
The average number of yearly fire incidents per 10k residents in Owatonna, MN compared to nearest cities:
(Note: Based on data for the last 3 years, including only cities with population 5,000 and above)
| Owatonna: | 24.8 |
| Waseca: | 41.3 |
| Faribault: | 43.5 |
| Kasson: | 22.0 |
| Northfield: | 30.0 |
| Byron: | 25.0 |
| Albert Lea: | 37.2 |
| Austin: | 22.3 |
| New Prague: | 34.0 |
 The median response time based on all reported fire incidents is 5 minutes. This is lower than the state median value.
The median response time in Owatonna, MN compared to nearest cities:
(Note: Based on data for all years, including only cities with at least 500 fire incidents)
| Owatonna: | 5 minutes |
| Waseca: | 6 minutes |
| Faribault: | 6 minutes |
| Northfield: | 8 minutes |
| Albert Lea: | 4 minutes |
| Austin: | 5 minutes |
| Rochester: | 6 minutes |
| Mankato: | 5 minutes |
| Farmington: | 6 minutes |
 Based on the reports from the years 2002 - 2018 the average number of fire-related yearly deaths is 0. The highest number of reported deaths - 1 took place in 2005, and the lowest - 0 in 2002. The data has a constant trend.
 According to the reports from the years 2002 - 2018 the average number of fire-related yearly casualties is 1. The highest number of injuries - 8 took place in 2003, and the lowest - 0 in 2004. The data has a declining trend.
The average number of injuries per 1,000 fire incidents is 13. This indicator was the highest - 88 in 2003, and the lowest 0 in 2004. The trend for casualties per 1,000 incidents is decreasing. Compared to the state value the number of casualties per 1,000 fires is higher.
According to the reports from the years 2002 - 2018 the average number of fire-related yearly casualties is 1. The highest number of injuries - 8 took place in 2003, and the lowest - 0 in 2004. The data has a declining trend.
The average number of injuries per 1,000 fire incidents is 13. This indicator was the highest - 88 in 2003, and the lowest 0 in 2004. The trend for casualties per 1,000 incidents is decreasing. Compared to the state value the number of casualties per 1,000 fires is higher.Casualties per 1,000 incidents in Owatonna, MN compared to nearest cities:
(Note: Based on data for all years, including only cities with at least 500 fire incidents)
| Owatonna: | 14.4 |
| Waseca: | 2.8 |
| Faribault: | 0.6 |
| Northfield: | 23.8 |
| Albert Lea: | 38.3 |
| Austin: | 18.9 |
| Rochester: | 15.1 |
| Mankato: | 10.2 |
| Farmington: | 7.8 |
 32.5% incidents where reported in the morning and 67.5% in the evening. The most fires (15.6%) took place on Friday, and the least (12.5%) on Thursday.
 Based on the 1,253 incident reports from years 2002 - 2018 most fires (10.9%) took place during April, and the least (5.0%) in February.
 Out of all 4,263 cases reported during the years 2002 - 2018, the most belonged to the categories: Fire (29.4%), Hazardous Condition (19.4%), and False Alarm (19.1%).
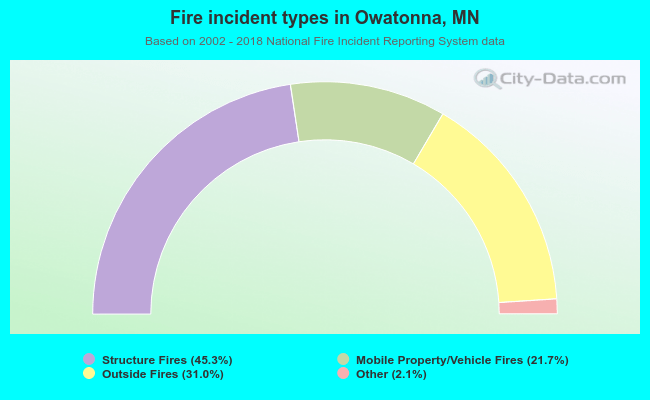 When looking into fire subcategories, the most reports belonged to: Structure Fires (45.3%), and Outside Fires (31.0%).