St. Louis Park: Fire Incidents, Minnesota (MN)
Where are fire incidents reported in St. Louis Park, MN
Something went wrong! Please refresh the page.
| Fire incidents reported | |
|---|---|
| Sreet name | Count |
| EXCELSIOR BLVD | 134 |
| MINNETONKA BLVD | 124 |
| STATE HWY NO 100 | 116 |
| STATE HIGHWAY NO 7 | 110 |
| CEDAR LAKE RD | 94 |
| LOUISIANA AVE | 76 |
| NEVADA AVE | 72 |
| LOUISIANA CT | 70 |
| HAMPSHIRE AVE | 52 |
| PARK GLEN RD | 46 |
| SHELARD PKWY | 46 |
| ALABAMA AVE | 44 |
| TEXAS AVE | 40 |
| WAYZATA BLVD | 40 |
| 35TH ST | 38 |
| LAKE ST | 38 |
| RHODE ISLAND AVE | 38 |
| VIRGINIA AVE | 38 |
| 31ST ST | 36 |
| HWY 100 | 34 |
| WOODDALE AVE | 34 |
| IDAHO AVE | 32 |
| 36 1/2 ST | 30 |
| CAMBRIDGE ST | 30 |
| KENTUCKY AVE | 30 |
| WALKER ST | 30 |
| OTTAWA AVE | 28 |
| MEADOWBROOK BLVD | 26 |
| PENNSYLVANIA AVE | 26 |
| ZARTHAN AVE | 26 |
2002 - 2011 National Fire Incident Reporting System (NFIRS) incidents
- Incident types reported to NFIRS in St. Louis Park, MN
- 4,92048.3%Rescue & EMS
- 1,62215.9%Hazardous Condition
- 1,45814.3%Fire
- 8628.5%Service Call
- 7056.9%False Alarm
- 5805.7%Good Intent Call
- 270.3%Overpressure Rupture
- Fire incident types reported to NFIRS in St. Louis Park, MN
- 78954.1%Structure Fires
- 38526.4%Outside Fires
- 23215.9%Mobile Property/Vehicle Fires
- 523.6%Other
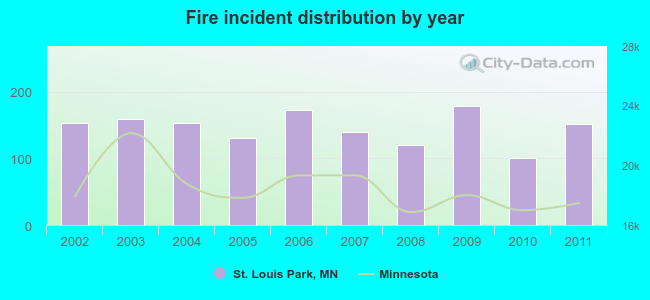 According to the data from the years 2002 - 2011 the average number of fire incidents per year is 146. The highest number of fire incidents - 179 took place in 2009, and the least - 100 in 2010. The data has a dropping trend.
 The median response time based on all reported fire incidents is 5 minutes. This is lower compared to the state median value.
The median response time in St. Louis Park, MN compared to nearest cities:
(Note: Based on data for all years, including only cities with at least 500 fire incidents)
| St. Louis Park: | 5 minutes |
| Hopkins: | 5 minutes |
| Golden Valley: | 7 minutes |
| Edina: | 5 minutes |
| Minneapolis: | 4 minutes |
| Minnetonka: | 7 minutes |
| Robbinsdale: | 6 minutes |
| Richfield: | 4 minutes |
| Crystal: | 5 minutes |
 Based on the data from the years 2002 - 2011 the average number of fire-related yearly deaths is 1. The highest number of reported deaths - 2 took place in 2007, and the lowest - 0 in 2002. The data has a growing trend.
 Based on the data from the years 2002 - 2011 the average number of fire-related casualties per year is 5. The highest number of casualties - 12 took place in 2009, and the lowest - 0 in 2006. The data has an increasing trend.
The average number of casualties per 1,000 fires is 33. This indicator was the highest - 67 in 2009, and the lowest 0 in 2006. The trend for casualties per 1,000 fires is rising. Compared to the Minnesota value the number of casualties per 1,000 fires is much higher.
Based on the data from the years 2002 - 2011 the average number of fire-related casualties per year is 5. The highest number of casualties - 12 took place in 2009, and the lowest - 0 in 2006. The data has an increasing trend.
The average number of casualties per 1,000 fires is 33. This indicator was the highest - 67 in 2009, and the lowest 0 in 2006. The trend for casualties per 1,000 fires is rising. Compared to the Minnesota value the number of casualties per 1,000 fires is much higher.Casualties per 1,000 incidents in St. Louis Park, MN compared to nearest cities:
(Note: Based on data for all years, including only cities with at least 500 fire incidents)
| St. Louis Park: | 32.2 |
| Hopkins: | 17.8 |
| Golden Valley: | 2.1 |
| Edina: | 40.5 |
| Minneapolis: | 17.0 |
| Minnetonka: | 20.8 |
| Robbinsdale: | 1.7 |
| Richfield: | 20.5 |
| Crystal: | 13.1 |
 30.7% incidents where reported in the morning and 69.3% in the evening. The most fires (15.9%) took place on Saturday, and the least (13.0%) on Thursday.
 Based on the 1,458 fires from years 2002 - 2011 most fires (12.6%) took place during May, and the least (4.9%) in February.
 Out of all 10,191 cases reported during the years 2002 - 2011, the most belonged to the categories: Rescue & EMS (48.3%), Hazardous Condition (15.9%), and Fire (14.3%).
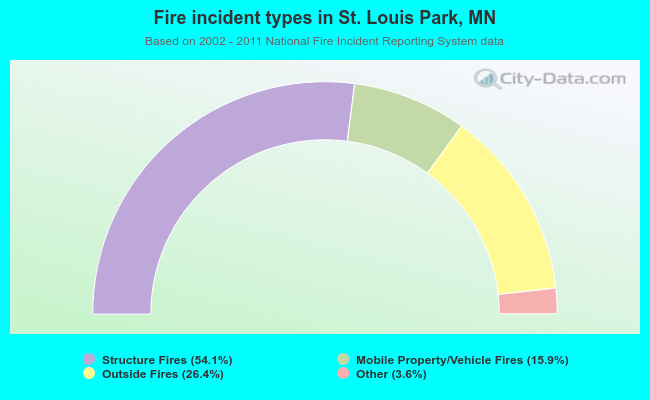 When looking into fire subcategories, the most incidents belonged to: Structure Fires (54.1%), and Outside Fires (26.4%).