Staunton: Fire Incidents, Virginia (VA)
Where are fire incidents reported in Staunton, VA
Something went wrong! Please refresh the page.
| Fire incidents reported | |
|---|---|
| Sreet name | Count |
| LEE-JACKSON HWY | 126 |
| CHURCHVILLE AVE | 108 |
| RICHMOND AVE | 96 |
| BEVERLEY ST | 94 |
| OLD GREENVILLE RD | 68 |
| GREENVILLE AVE | 60 |
| SHUTTERLEE MILL RD | 54 |
| RICHMOND RD | 52 |
| MIDDLEBROOK RD | 50 |
| AUGUSTA ST | 48 |
| BARTERBROOK RD | 40 |
| COALTER ST | 40 |
| LEE JACKSON HWY | 40 |
| NEW HOPE RD | 40 |
| PARKERSBURG TPKE | 40 |
| JEFFERSON HWY | 38 |
| MORRIS MILL RD | 36 |
| HOWARDSVILLE RD | 32 |
| LEEJACKSON HWY | 32 |
| MONTGOMERY AVE | 32 |
| STATLER BLVD | 32 |
| CHESTNUT RIDGE RD | 30 |
| CHRISTIANS CREEK RD | 30 |
| HERMITAGE RD | 30 |
| I 81 | 30 |
| BRIARWOOD ONE | 28 |
| MAINE CIR | 28 |
| NEW ST | 28 |
| SPRINGHILL RD | 28 |
| BEVERLY ST | 26 |
| Other | 1,088 |
2002 - 2018 National Fire Incident Reporting System (NFIRS) incidents
- Incident types reported to NFIRS in Staunton, VA
- 9,25743.5%Rescue & EMS
- 3,47316.3%Hazardous Condition
- 2,50411.8%Fire
- 2,25210.6%Service Call
- 2,1029.9%Good Intent Call
- 1,5137.1%False Alarm
- 1420.7%Overpressure Rupture
- 320.2%Severe Weather
- 290.1%Special Incident
- Fire incident types reported to NFIRS in Staunton, VA
- 1,37554.9%Structure Fires
- 70428.1%Outside Fires
- 38015.2%Mobile Property/Vehicle Fires
- 451.8%Other
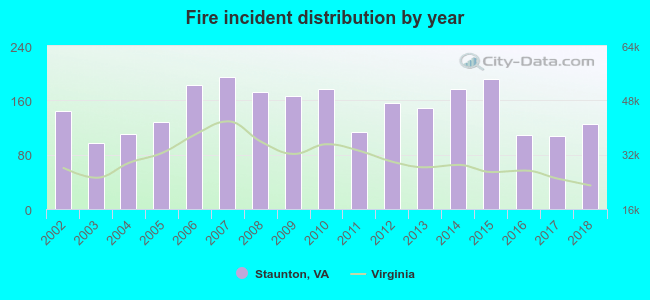 Based on the data from the years 2002 - 2018 the average number of fires per year is 147. The highest number of reported fires - 195 took place in 2007, and the least - 97 in 2003. The data has a declining trend.
The average number of yearly fire incidents per 10k residents in Staunton, VA compared to nearest cities:
(Note: Based on data for the last 3 years, including only cities with population 5,000 and above)
| Staunton: | 46.5 |
| Fishersville: | 39.8 |
| Stuarts Draft: | 41.9 |
| Waynesboro: | 53.7 |
| Bridgewater: | 29.7 |
| Crozet: | 24.0 |
| Harrisonburg: | 17.0 |
| Lexington: | 145.4 |
| Buena Vista: | 75.7 |
 The median response time based on all reported fire incidents is 7 minutes. This is comparable to the Virginia median value.
The median response time in Staunton, VA compared to nearest cities:
(Note: Based on data for all years, including only cities with at least 500 fire incidents)
| Staunton: | 7 minutes |
| Verona: | 9 minutes |
| Churchville: | 12 minutes |
| Fishersville: | 8 minutes |
| Stuarts Draft: | 11 minutes |
| Greenville: | 15 minutes |
| Waynesboro: | 7 minutes |
| Grottoes: | 9 minutes |
| Bridgewater: | 11 minutes |
 Based on the data from the years 2002 - 2018 the average number of fire-related yearly casualties is 2. The highest number of reported casualties - 5 took place in 2011, and the lowest - 0 in 2005. The data has a rising trend.
The average number of injuries per 1,000 fires is 14. This indicator was the highest - 44 in 2011, and the lowest 0 in 2005. The trend for casualties per 1,000 fire incidents is growing. Compared to the state value the number of injuries per 1,000 incidents is about the same.
Based on the data from the years 2002 - 2018 the average number of fire-related yearly casualties is 2. The highest number of reported casualties - 5 took place in 2011, and the lowest - 0 in 2005. The data has a rising trend.
The average number of injuries per 1,000 fires is 14. This indicator was the highest - 44 in 2011, and the lowest 0 in 2005. The trend for casualties per 1,000 fire incidents is growing. Compared to the state value the number of injuries per 1,000 incidents is about the same.Casualties per 1,000 incidents in Staunton, VA compared to nearest cities:
(Note: Based on data for all years, including only cities with at least 500 fire incidents)
| Staunton: | 13.2 |
| Verona: | 16.2 |
| Churchville: | 3.1 |
| Fishersville: | 3.7 |
| Stuarts Draft: | 4.1 |
| Greenville: | 1.9 |
| Waynesboro: | 18.3 |
| Grottoes: | 4.8 |
| Bridgewater: | 10.1 |
 33.5% incidents where reported in the morning and 66.5% in the evening. The most fires (15.3%) took place on Saturday, and the least (13.3%) on Wednesday.
 According to the 2,504 fire incidents from years 2002 - 2018 most fires (11.5%) took place during March, and the least (5.6%) in June.
 Out of all 21,304 cases reported during the years 2002 - 2018, the most belonged to the categories: Rescue & EMS (43.5%), Hazardous Condition (16.3%), and Fire (11.8%).
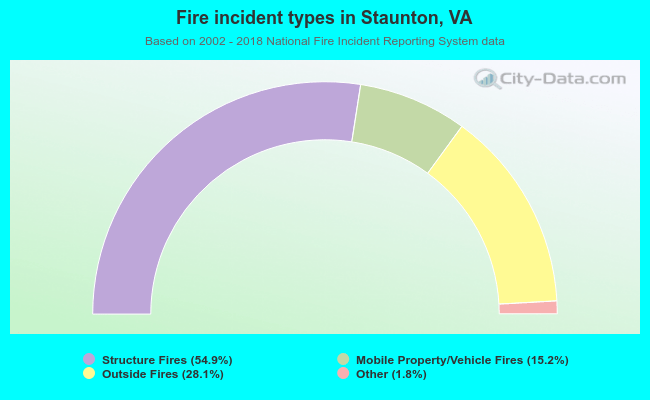 When looking into fire subcategories, the most incidents belonged to: Structure Fires (54.9%), and Outside Fires (28.1%).