Waipahu: Fire Incidents, Hawaii (HI)
Where are fire incidents reported in Waipahu, HI
Something went wrong! Please refresh the page.
| Fire incidents reported | |
|---|---|
| Sreet name | Count |
| FARRINGTON HWY | 692 |
| WAIPAHU ST | 502 |
| KUNIA RD | 166 |
| H2 FWY | 144 |
| H1 FWY | 140 |
| KUPUOHI ST | 124 |
| KAM HWY | 114 |
| PUPUOLE ST | 110 |
| LUMIAINA ST | 102 |
| KA UKA BLVD | 86 |
| WAIPIO POINT ACC RD | 78 |
| HONOWAI ST | 76 |
| ANIANI PL | 70 |
| KUHAULUA ST | 70 |
| HIAPO ST | 66 |
| WAIPAHU DEPOT ST | 66 |
| LEOWAHINE ST | 64 |
| PAIWA ST | 64 |
| MOKUOLA ST | 58 |
| LEOKU ST | 56 |
| LEOKANE ST | 52 |
| KAAHOLO ST | 46 |
| LUMIAUAU ST | 44 |
| MOLOALO ST | 42 |
| PUPUKAHI ST | 40 |
| OLD FORT WEAVER RD | 36 |
| PAHU ST | 34 |
| PUPUPUHI ST | 34 |
| HIKIMOE ST | 32 |
| ANONUI ST | 30 |
2003 - 2018 National Fire Incident Reporting System (NFIRS) incidents
- Incident types reported to NFIRS in Waipahu, HI
- 8,94251.3%Rescue & EMS
- 2,98617.1%Good Intent Call
- 2,54014.6%Fire
- 1,6019.2%Hazardous Condition
- 7774.5%False Alarm
- 5713.3%Service Call
- Fire incident types reported to NFIRS in Waipahu, HI
- 1,47558.1%Outside Fires
- 55221.7%Structure Fires
- 50920.0%Mobile Property/Vehicle Fires
- 40.2%Other
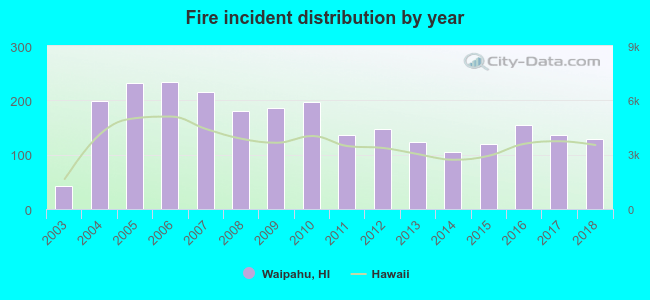 Based on the data from the years 2003 - 2018 the average number of fires per year is 159. The highest number of reported fires - 234 took place in 2006, and the least - 43 in 2003. The data has a growing trend.
The average number of yearly fire incidents per 10k residents in Waipahu, HI compared to nearest cities:
(Note: Based on data for the last 3 years, including only cities with population 5,000 and above)
| Waipahu: | 36.5 |
| Waipio: | 11.1 |
| Pearl City: | 13.9 |
| Mililani Town: | 6.3 |
| Kapolei: | 85.2 |
| Ewa Beach: | 50.4 |
| Aiea: | 76.7 |
| Makakilo: | 2.7 |
| Wahiawa: | 36.5 |
 The median response time based on all reported fire incidents is 7 minutes. This is close to the Hawaii median value.
The median response time in Waipahu, HI compared to nearest cities:
(Note: Based on data for all years, including only cities with at least 500 fire incidents)
| Waipahu: | 7 minutes |
| Pearl City: | 7 minutes |
| Mililani Town: | 6 minutes |
| Kapolei: | 7 minutes |
| Ewa Beach: | 7 minutes |
| Aiea: | 7 minutes |
| Wahiawa: | 6 minutes |
| Waianae: | 7 minutes |
| Honolulu: | 5 minutes |
 Based on the data from the years 2003 - 2018 the average number of fire-related yearly deaths is 0. The highest number of deaths - 4 took place in 2017, and the lowest - 0 in 2003. The data has a constant trend.
The average number of deaths per 1,000 fire incidents is 3. This indicator was the highest - 29 in 2017, and the lowest 0 in 2003. The trend for fatalities per 1,000 incidents is constant. Compared to the state value the number of fatalities per 1,000 incidents is much higher.
Based on the data from the years 2003 - 2018 the average number of fire-related yearly deaths is 0. The highest number of deaths - 4 took place in 2017, and the lowest - 0 in 2003. The data has a constant trend.
The average number of deaths per 1,000 fire incidents is 3. This indicator was the highest - 29 in 2017, and the lowest 0 in 2003. The trend for fatalities per 1,000 incidents is constant. Compared to the state value the number of fatalities per 1,000 incidents is much higher.
 Based on the reports from the years 2003 - 2018 the average number of fire-related yearly casualties is 2. The highest number of reported casualties - 5 took place in 2007, and the lowest - 0 in 2003. The data has an increasing trend.
The average number of injuries per 1,000 fires is 12. This indicator was the highest - 36 in 2011, and the lowest 0 in 2003. The trend for injuries per 1,000 fires is increasing. Compared to the state value the number of injuries per 1,000 fire incidents is much higher.
Based on the reports from the years 2003 - 2018 the average number of fire-related yearly casualties is 2. The highest number of reported casualties - 5 took place in 2007, and the lowest - 0 in 2003. The data has an increasing trend.
The average number of injuries per 1,000 fires is 12. This indicator was the highest - 36 in 2011, and the lowest 0 in 2003. The trend for injuries per 1,000 fires is increasing. Compared to the state value the number of injuries per 1,000 fire incidents is much higher.Casualties per 1,000 incidents in Waipahu, HI compared to nearest cities:
(Note: Based on data for all years, including only cities with at least 500 fire incidents)
| Waipahu: | 11.4 |
| Pearl City: | 12.2 |
| Mililani Town: | 6.9 |
| Kapolei: | 6.3 |
| Ewa Beach: | 8.1 |
| Aiea: | 8.3 |
| Wahiawa: | 8.7 |
| Waianae: | 1.4 |
| Honolulu: | 9.7 |
 38.6% incidents where reported in the morning and 61.4% in the evening. The most fires (15.9%) took place on Monday, and the least (12.6%) on Friday.
 According to the 2,540 reports from years 2003 - 2018 most fires (12.2%) took place during July, and the least (6.3%) in February.
 Out of all 17,420 cases reported during the years 2003 - 2018, the most belonged to the categories: Rescue & EMS (51.3%), Good Intent Call (17.1%), and Fire (14.6%).
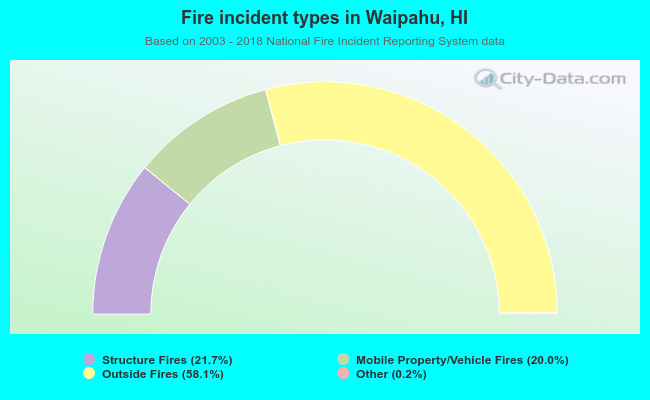 When looking into fire subcategories, the most incidents belonged to: Outside Fires (58.1%), and Structure Fires (21.7%).