Hilo, HI (Hawaii) Houses and Residents
| Hilo: | $491,683 |
| Hawaii: | $820,100 |
Mean price in 2022:
Detached houses: $488,547
Here: $488,547 State: $1,035,348 Townhouses or other attached units: $516,710
Here: $516,710 State: $976,474 In 2-unit structures: $1,861,309
Here: $1,861,309 State: $928,739 In 3-to-4-unit structures: $231,080
Here: $231,080 State: $758,960 In 5-or-more-unit structures: $349,904
Here: $349,904 State: $584,974
Total population: 43,263 (Urban population: 36,147 (all inside urban clusters), Rural population: 4,651 (123 farm, 4,528 nonfarm))
Houses: 19,014 (17,073 occupied: 11,190 owner occupied, 6,092 renter occupied)
| % of renters here: | 35% |
| State: | 37% |
Housing density: 350 houses/condos per square mile
Median price asked for vacant for-sale houses and condos in 2022: $311,418.
Median contract rent in 2022: $1,043 (lower quartile is $844, upper quartile is $1,291)
Median rent asked for vacant for-rent units in 2022: $1,930
Median gross rent in Hilo, HI in 2022: $1,173
Housing units in Hilo with a mortgage: 5,871 (537 second mortgage, 61 home equity loan, 457 both second mortgage and home equity loan)
Houses without a mortgage: 327
Median household income for houses/condos with a mortgage: $125,000
Median household income for apartments without a mortgage: $71,315
Median monthly housing costs: $1,089
Compare current foreclosures in Hilo, HI:
| Photo | Address | Area | Beds / Baths | Price | Details |
|---|---|---|---|---|---|

|
#1
W Kawailani St
Hilo, HI 96720
|
1,256 sq. feet
|
2 baths 3 beds |
show details | |

|
#2
Hale Nani St
Hilo, HI 96720
|
1,448 sq. feet
|
2 baths 3 beds |
show details | |

|
#3
Kinoole St
Hilo, HI 96720
|
1,216 sq. feet
|
3 baths 3 beds |
show details | |

|
#4
Chong St
Hilo, HI 96720
|
1,704 sq. feet
|
2 baths 3 beds |
show details | |

|
#5
Kaanini St
Hilo, HI 96720
|
2,656 sq. feet
|
3 baths 3 beds |
show details | |

|
#6
Kinoole St
Hilo, HI 96720
|
960 sq. feet
|
1 baths 2 beds |
show details | |

|
#7
Haihai St
Hilo, HI 96720
|
1,454 sq. feet
|
2 baths 5 beds |
show details | |

|
#8
W Naauao Pl
Hilo, HI 96720
|
1,424 sq. feet
|
2 baths 3 beds |
show details | |

|
#9
Hookano St
Hilo, HI 96720
|
1,152 sq. feet
|
2 baths 6 beds |
show details | |

|
#10
Kehaulani St
Hilo, HI 96720
|
3,394 sq. feet
|
4 baths 4 beds |
show details |
| Photo | Address | Area | Beds / Baths | Price | Details |
|---|---|---|---|---|---|

|
#11
Alawaena St
Hilo, HI 96720
|
1,758 sq. feet
|
2 baths 2 beds |
show details | |

|
#12
Puhau St
Hilo, HI 96720
|
1,320 sq. feet
|
2 baths 3 beds |
show details | |

|
#13
Kuleana Loop
Hilo, HI 96720
|
1,702 sq. feet
|
2 baths 3 beds |
show details | |

|
#14
Akekeke St
Hilo, HI 96720
|
936 sq. feet
|
1 baths 3 beds |
show details | |

|
#15
Leimamo St
Hilo, HI 96720
|
1,156 sq. feet
|
2 baths 6 beds |
show details | |

|
#16
Hoaloha St
Hilo, HI 96720
|
1,568 sq. feet
|
2 baths 3 beds |
show details | |

|
#17
Kaholo St
Hilo, HI 96720
|
2,060 sq. feet
|
3 baths 4 beds |
show details | |

|
#18
Ainaola Dr
Hilo, HI 96720
|
1,536 sq. feet
|
1 baths 3 beds |
show details | |

|
#19
Kapaka St
Hilo, HI 96720
|
1,776 sq. feet
|
2 baths 4 beds |
show details | |

|
#20
Kaumana Dr Apt B
Hilo, HI 96720
|
- sq. feet
|
- baths - beds |
show details |
| Photo | Address | Area | Beds / Baths | Price | Details |
|---|---|---|---|---|---|

|
#21
Malama Pl Bldg F
Hilo, HI 96720
|
- sq. feet
|
- baths - beds |
show details | |

|
#22
Kauhane Ave
Hilo, HI 96720
|
- sq. feet
|
- baths - beds |
show details | |

|
#23
Kilauea Ave
Hilo, HI 96720
|
- sq. feet
|
- baths - beds |
show details | |

|
#24
Hale St Apt 3a
Hilo, HI 96720
|
- sq. feet
|
- baths - beds |
show details | |

|
#25
King Ave
Hilo, HI 96720
|
- sq. feet
|
- baths - beds |
show details | |

|
#26
Mele Manu St Apt A
Hilo, HI 96720
|
- sq. feet
|
- baths - beds |
show details | |

|
#27
Kilauea Ave
Hilo, HI 96720
|
- sq. feet
|
- baths - beds |
show details | |

|
#28
Iolani St Apt C
Hilo, HI 96720
|
- sq. feet
|
- baths - beds |
show details | |

|
#29
Kaumana Dr
Hilo, HI 96720
|
- sq. feet
|
- baths - beds |
show details | |

|
#30
Kupulau Rd Apt A
Hilo, HI 96720
|
- sq. feet
|
- baths - beds |
show details |
| Photo | Address | Area | Beds / Baths | Price | Details |
|---|---|---|---|---|---|

|
#31
W Kawailani St Apt E
Hilo, HI 96720
|
- sq. feet
|
- baths - beds |
show details | |

|
#32
Kauila St Apt 405
Hilo, HI 96720
|
- sq. feet
|
- baths - beds |
show details | |

|
#33
Piilani St
Hilo, HI 96720
|
- sq. feet
|
- baths - beds |
show details | |

|
Check over 1 million property listings on Foreclosure.com!
|
browse all offers | |||

Latest news about housing in Hilo, HI collected exclusively by city-data.com from local newspapers, TV, and radio stations

 | Condos for sale - Makaha Valley/Waianae (115 replies) |
| I'm currently in Oahu and I gotta tell ya, its my least favorite island. (81 replies) |
| Oahu single family home rentals (32 replies) |
| Household Essentials For Move-Stuff My Suitcase or Buy on Oahu? (12 replies) |
| Malihini or not? (21 replies) |
| Are the politics and race relations different on O'ahu compared to the B.I.? (10 replies) |

Median year apartment built: 1975
Household type by relationship:
Households: 48,605- Male householders: 7,494 (1,909 living alone), Female householders: 9,601 (2,639 living alone)
7,842 spouses (7,692 opposite-sex spouses), 1,271 unmarried partners, (1,101 opposite-sex unmarried partners), 13,339 children (12,615 natural, 344 adopted, 378 stepchildren), 2,736 grandchildren, 626 brothers or sisters, 794 parents, 124 foster children, 1,368 other relatives, 2,312 non-relatives
- In group quarters: 1,091
Size of family households: 4,748 2-persons, 2,267 3-persons, 2,155 4-persons, 675 5-persons, 413 6-persons, 581 7-or-more-persons.
Size of nonfamily households: 4,875 1-person, 995 2-persons, 512 3-persons, 55 4-persons, 8 5-persons, 7 6-persons.
4,927 married couples with children.
3,228 single-parent households (490 men, 2,738 women).
78.5% of residents of Hilo speak English at home.
2.1% of residents speak Spanish at home (88% speak English very well, 8% speak English well, 4% speak English not well).
1.4% of residents speak other Indo-European language at home (95% speak English very well, 5% speak English well).
13.9% of residents speak Asian or Pacific Island language at home (64% speak English very well, 22% speak English well, 13% speak English not well, 1% don't speak English at all).
5.2% of residents speak other language at home (76% speak English very well, 24% speak English well).
Foreign born population: 4,187 (8.6%)
(59.5% of them are naturalized citizens)
| Here: | 5.9 |
| State: | 5.5 |
| Here: | 4.2 |
| State: | 3.9 |

- Bedrooms in owner-occupied houses and condos in Hilo, Hawaii
- 148no bedroom
- 2511 bedroom
- 1,2412 bedrooms
- 6,3803 bedrooms
- 2,4744 bedrooms
- 6975+ bedrooms

- Bedrooms in renter-occupied apartments in Hilo, Hawaii
- 593no bedroom
- 9041 bedroom
- 1,8262 bedrooms
- 2,2323 bedrooms
- 4904 bedrooms
- 475+ bedrooms

- Cars and other vehicles available in Hilo in owner-occupied houses/condos
- 267no vehicle
- 2,7361 vehicle
- 4,2672 vehicles
- 2,4513 vehicles
- 1,0034 vehicles
- 4665+ vehicles

- Cars and other vehicles available in Hilo in renter-occupied apartments
- 1,250no vehicle
- 2,6751 vehicle
- 1,5082 vehicles
- 4383 vehicles
- 1054 vehicles
- 1155+ vehicles

- Rooms in owner-occupied houses in Hilo, Hawaii
- 1291 room
- 1162 rooms
- 4973 rooms
- 1,5954 rooms
- 2,2915 rooms
- 2,6856 rooms
- 1,7637 rooms
- 8678 rooms
- 1,2479+ rooms

- Rooms in renter-occupied apartments in Hilo, Hawaii
- 5261 room
- 4272 rooms
- 1,0703 rooms
- 1,6454 rooms
- 9945 rooms
- 7636 rooms
- 3787 rooms
- 1168 rooms
- 1749+ rooms


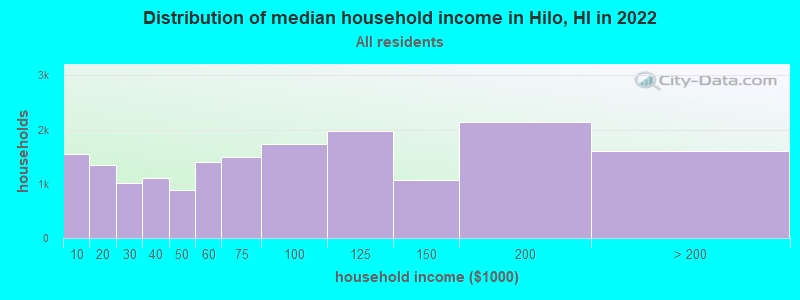
Hilo, HI household income distribution

- 1,548Less than $10,000
- 1,354$10,000 to $19,999
- 1,013$20,000 to $29,999
- 1,110$30,000 to $39,999
- 893$40,000 to $49,999
- 1,407$50,000 to $59,999
- 1,495$60,000 to $74,999
- 1,735$75,000 to $99,999
- 1,977$100,000 to $124,999
- 1,065$125,000 to $149,999
- 2,141$150,000 to $199,999
- 1,614$200,000 or more
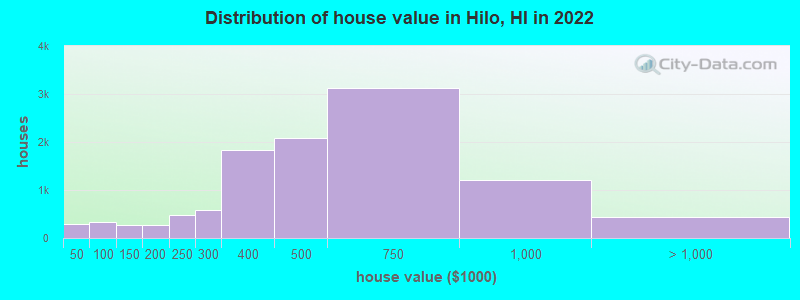
Home value of owner - occupied houses in 2022 in Hilo, HI
-
- 125Less than $10,000
- 34$10,000 to $14,999
- 5$20,000 to $24,999
- 24$25,000 to $29,999
- 24$30,000 to $34,999
- 3$35,000 to $39,999
- 77$40,000 to $49,999
- 15$50,000 to $59,999
- 17$60,000 to $69,999
- 113$70,000 to $79,999
- 72$80,000 to $89,999
- 40$90,000 to $99,999
- 130$100,000 to $124,999
- 137$125,000 to $149,999
- 212$150,000 to $174,999
- 65$175,000 to $199,999
- 475$200,000 to $249,999
- 577$250,000 to $299,999
- 1,830$300,000 to $399,999
- 2,077$400,000 to $499,999
- 3,130$500,000 to $749,999
- 1,208$750,000 to $999,999
- 304$1,000,000 to $1,499,999
- 39$1,500,000 to $1,999,999
- 98$2,000,000 or more
Rent paid by renters in 2022 in Hilo, HI
-
- 258Less than $100
- 37$100 to $149
- 135$150 to $199
- 49$200 to $249
- 309$250 to $299
- 58$300 to $349
- 8$350 to $399
- 44$400 to $449
- 31$450 to $499
- 75$500 to $549
- 28$550 to $599
- 71$600 to $649
- 35$650 to $699
- 143$700 to $749
- 27$750 to $799
- 248$800 to $899
- 678$900 to $999
- 1,741$1,000 to $1,249
- 560$1,250 to $1,499
- 473$1,500 to $1,999
- 56$2,000 to $2,499
- 7$2,500 to $2,999
- 25$3,000 to $3,499
- 764No cash rent


Percentage of workers working in this county: 98.4%
Number of people working at home: 1,667 (8.1% of all workers)
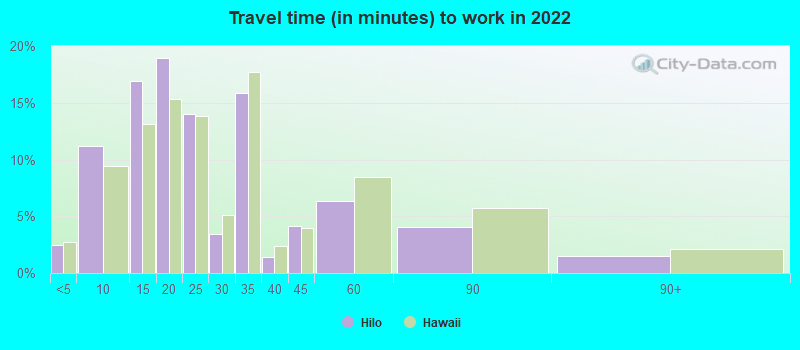
Travel time to work (commute)
- Less than 5 minutes: 830
- 5 to 9 minutes: 2,913
- 10 to 14 minutes: 4,468
- 15 to 19 minutes: 4,880
- 20 to 24 minutes: 2,551
- 25 to 29 minutes: 186
- 30 to 34 minutes: 1,247
- 35 to 39 minutes: 125
- 40 to 44 minutes: 283
- 45 to 59 minutes: 377
- 60 to 89 minutes: 455
- 90 or more minutes: 542
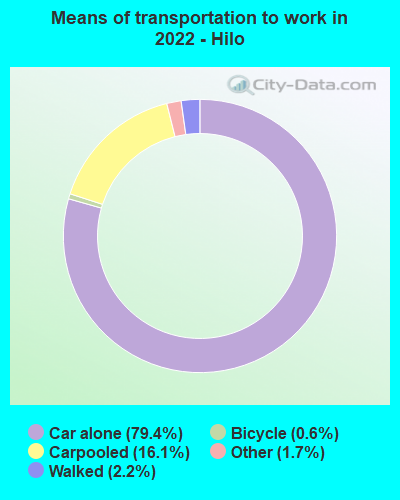
Means of transportation to work:
- Drove a car alone: 20,091 (71.3%)
- Carpooled: 4,505 (16.0%)
- Bus: 20 (0.1%)
- Taxi: 1,013 (3.6%)
- Bicycle: 164 (0.6%)
- Walked: 563 (2.0%)
- Worked at home: 1,667 (5.9%)

- Unemployment by race in 2022
- Unemployment rate for White non-Hispanic residents
- 4.9%Males
- 7.2%Females
- Unemployment rate for Black residents
- 90.7%Males
- 6.9%Females
- Unemployment rate for American Indian and Alaska Native residents
- 42.6%Males
- Unemployment rate for Asian residents
- 2.1%Males
- 1.7%Females
- Unemployment rate for other race residents
- 4.9%Females
- Unemployment rate for two or more race residents
- 4.7%Males
- 5.2%Females
- Unemployment rate for Hispanic or Latino residents
- 20.3%Males
- 4.8%Females

- Year of entry for the foreign-born population in Hilo, Hawaii
- 1,4212010 or later
- 5352000 to 2009
- 5771990 to 1999
- 5831980 to 1989
- 5741970 to 1979
- 640Before 1970
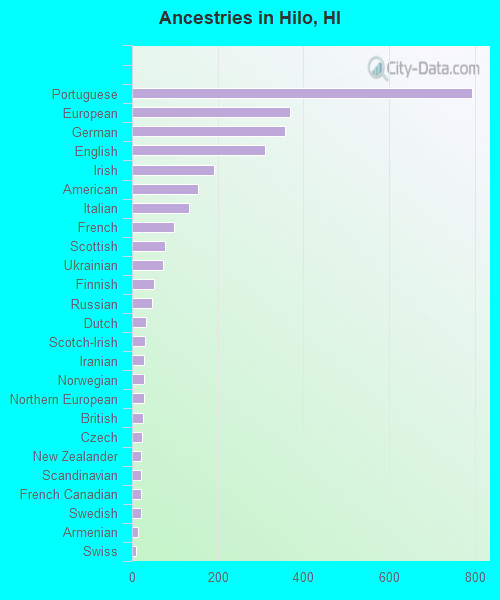
First ancestries reported:
- Portuguese: 794 (3.5%)
- European: 369 (1.6%)
- German: 357 (1.6%)
- English: 310 (1.4%)
- Irish: 192 (0.8%)
- American: 154 (0.7%)
- Italian: 133 (0.6%)
- French: 97 (0.4%)
- Scottish: 76 (0.3%)
- Ukrainian: 73 (0.3%)
- Finnish: 51 (0.2%)
- Russian: 47 (0.2%)
- Dutch: 32 (0.1%)
- Scotch-Irish: 31 (0.1%)
- Iranian: 29 (0.1%)
- Norwegian: 28 (0.1%)
- Northern European: 27 (0.1%)
- British: 26 (0.1%)
- Czech: 23 (0.1%)
- New Zealander: 22 (0.10%)
- Scandinavian: 22 (0.10%)
- French Canadian: 20 (0.09%)
- Swedish: 20 (0.09%)
- Armenian: 14 (0.06%)
- Swiss: 10 (0.04%)
- Welsh: 10 (0.04%)
- Croatian: 9 (0.04%)
- Polish: 9 (0.04%)
- Slovak: 9 (0.04%)
- Austrian: 6 (0.03%)
- Jamaican: 5 (0.02%)
- Hungarian: 3 (0.01%)
- Slavic: 3 (0.01%)
Most common places of birth for foreign-born residents (%):
| Hilo: | 40.4% (1,772) |
| Hawaii: | 44.3% (115,679) |
| Hilo: | 12.4% (545) |
| Hawaii: | 8.5% (22,321) |
| Hilo: | 6.1% (268) |
| Hawaii: | 7.6% (19,835) |
| Hilo: | 5.7% (250) |
| Hawaii: | 4.0% (10,430) |
| Hilo: | 4.4% (195) |
| Hawaii: | 5.9% (15,525) |
| Hilo: | 3.1% (136) |
| Hawaii: | 0.5% (1,224) |
| Hilo: | 2.5% (109) |
| Hawaii: | 3.7% (9,622) |
| Hilo: | 2.1% (90) |
| Hawaii: | 1.1% (2,843) |
| Hilo: | 2.0% (87) |
| Hawaii: | 1.8% (4,752) |
| Hilo: | 1.5% (68) |
| Hawaii: | 2.4% (6,146) |
Place of birth for U.S.-born residents:
- This state: 36,395
- Other state: 7,892
- Northeast: 870
- Midwest: 1,547
- South: 1,442
- West: 4,040
90.9% of Hilo residents lived in the same house 1 years ago.
Out of people who lived in different houses, 42.1% lived in this county.
Out of people who lived in different counties, 19.9% lived in Hawaii.
| Hilo: | 90.9% |
| State average: | 87.8% |
Education attainment for males 25 years and older:
- No schooling: 64
- Nursery to 4th grade: 21
- 5th and 6th grade: 10
- 7th and 8th grade: 190
- 9th grade: 18
- 10th grade: 234
- 11th grade: 282
- 12th grade, no diploma: 358
- High school graduate (or equivalency): 4,503
- Less than 1 year of college: 932
- Some college more than 1 year, no degree: 2,077
- Associate degree: 2,024
- Bachelor's degree: 3,000
- Master's degree: 957
- Professional school degree: 686
- Doctorate degree: 723

Education attainment for females 25 years and older:
- No schooling: 70
- Nursery to 4th grade: 8
- 5th and 6th grade: 45
- 7th and 8th grade: 255
- 9th grade: 68
- 10th grade: 79
- 11th grade: 96
- 12th grade, no diploma: 113
- High school graduate (or equivalency): 4,628
- Less than 1 year of college: 1,483
- Some college more than 1 year, no degree: 1,878
- Associate degree: 2,416
- Bachelor's degree: 4,277
- Master's degree: 2,100
- Professional school degree: 379
- Doctorate degree: 334


Housing units in structures:
- One, detached: 14,779
- One, attached: 443
- Two: 443
- 3 or 4: 332
- 5 to 9: 441
- 10 to 19: 547
- 20 to 49: 1,152
- 50 or more: 810
- Mobile homes: 64
Housing units lacking complete kitchen facilities in 2022: 3.2%
House/condo owner moved in on average 19 years ago
Renter moved in on average 4 years ago

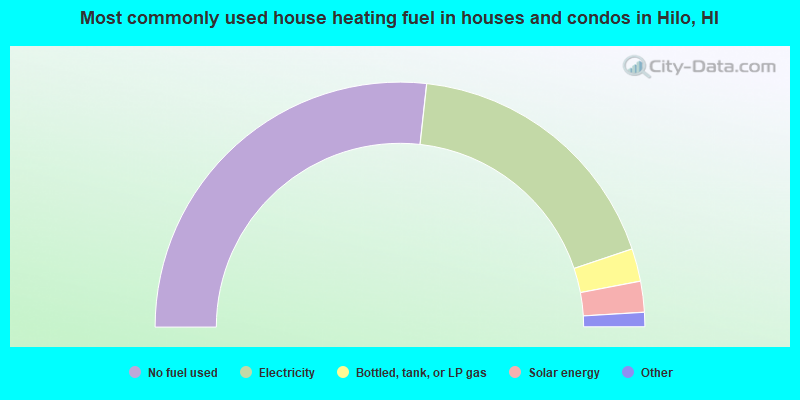
- 53.5%No fuel used
- 36.2%Electricity
- 4.3%Bottled, tank, or LP gas
- 4.1%Solar energy
- 1.2%Utility gas
- 0.3%Wood
- 0.2%Fuel oil, kerosene, etc.
- 0.1%Other fuel
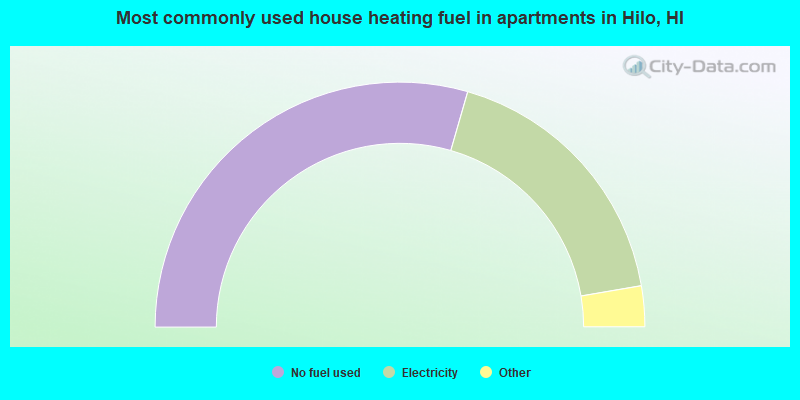
- 59.0%No fuel used
- 35.7%Electricity
- 3.4%Utility gas
- 2.0%Bottled, tank, or LP gas
Private vs. public school enrollment:
| Here: | 20.1% |
| Hawaii: | 21.6% |
| Here: | 17.5% |
| Hawaii: | 21.5% |
| Here: | 13.9% |
| Hawaii: | 23.3% |


