Kasson, MN (Minnesota) Houses and Residents
| Kasson: | $266,664 |
| Minnesota: | $314,600 |
Mean price in 2022:
Detached houses: $254,287
Here: $254,287 State: $374,552 Townhouses or other attached units: $244,054
Here: $244,054 State: $312,049 Mobile homes: $39,262
Here: $39,262 State: $94,605
Total population: 6,074 (Urban population: 4,363 (all inside urban clusters), Rural population: 71 (8 farm, 63 nonfarm))
Houses: 2,716 (2,540 occupied: 2,293 owner occupied, 266 renter occupied)
| % of renters here: | 10% |
| State: | 28% |
Housing density: 1,340 houses/condos per square mile
Median price asked for vacant for-sale houses and condos in 2022: $240,445.
Median contract rent in 2022: $757 (lower quartile is $696, upper quartile is $1,019)
Median rent asked for vacant for-rent units in 2022: $498
Median gross rent in Kasson, MN in 2022: $810
Housing units in Kasson with a mortgage: 1,657 (183 second mortgage, 0 home equity loan, 189 both second mortgage and home equity loan)
Houses without a mortgage: 17
Median household income for houses/condos with a mortgage: $108,929
Median household income for apartments without a mortgage: $72,846
Median monthly housing costs: $1,411
Compare current foreclosures near Kasson, MN:
| Photo | Address | Area | Beds / Baths | Price | Details |
|---|---|---|---|---|---|

|
#1
3rd Ave NW
Kasson, MN 55944
|
682 sq. feet
|
2 baths 2 beds |
show details | |

|
#2
4th Ave NE
Kasson, MN 55944
|
920 sq. feet
|
1 baths 4 beds |
show details | |

|
#3
15th Ave NW
Kasson, MN 55944
|
- sq. feet
|
- baths - beds |
show details | |

|
#4
Prairie Pl NW
Kasson, MN 55944
|
- sq. feet
|
- baths - beds |
show details | |

|
#5
2nd Ave NW
Kasson, MN 55944
|
- sq. feet
|
- baths - beds |
show details | |

|
#6
W Veterans Memorial Hwy Apt 2
Kasson, MN 55944
|
- sq. feet
|
- baths - beds |
show details | |

|
#7
11th Ave NW
Kasson, MN 55944
|
- sq. feet
|
- baths - beds |
show details | |

|
#8
Southfork Dr SE
Kasson, MN 55944
|
- sq. feet
|
- baths - beds |
show details | |

|
#9
Harvest Square Pl NW
Rochester, MN 55901
|
1,760 sq. feet
|
3 baths 2 beds |
$349,900
|
show details |

|
#10
Melody St SE
Rochester, MN 55904
|
720 sq. feet
|
1 baths 2 beds |
$199,900
|
show details |
| Photo | Address | Area | Beds / Baths | Price | Details |
|---|---|---|---|---|---|

|
#11
Spruce Meadows Dr SE
Rochester, MN 55904
|
1,496 sq. feet
|
3 baths 4 beds |
show details | |

|
#12
Manor Brook Dr NW
Rochester, MN 55901
|
- sq. feet
|
2 baths 4 beds |
show details | |

|
#13
3rd St SE
Rochester, MN 55904
|
2,296 sq. feet
|
1 baths 3 beds |
show details | |

|
#14
Northern Hills Ct NE
Rochester, MN 55906
|
2,500 sq. feet
|
2 baths 4 beds |
show details | |

|
#15
12th St NW
Rochester, MN 55901
|
1,352 sq. feet
|
1 baths 2 beds |
show details | |

|
#16
50th St NW
Rochester, MN 55901
|
1,041 sq. feet
|
2 baths 4 beds |
show details | |

|
#17
2nd St SW
Pine Island, MN 55963
|
1,108 sq. feet
|
1 baths 2 beds |
show details | |

|
#18
Center Ave S
Hayfield, MN 55940
|
912 sq. feet
|
1 baths 2 beds |
show details | |

|
#19
W Main St
Hayfield, MN 55940
|
2,176 sq. feet
|
2 baths 4 beds |
show details | |

|
#20
9th St NE
Rochester, MN 55906
|
1,732 sq. feet
|
1 baths 3 beds |
show details |
| Photo | Address | Area | Beds / Baths | Price | Details |
|---|---|---|---|---|---|

|
#21
Pinewood Rd SE
Rochester, MN 55904
|
768 sq. feet
|
2 baths 3 beds |
show details | |

|
#22
1st Ave NE
Dodge Center, MN 55927
|
1,056 sq. feet
|
1 baths 3 beds |
show details | |

|
#23
Shardlow Ln NE
Byron, MN 55920
|
1,584 sq. feet
|
2 baths 2 beds |
show details | |

|
#24
Kingsbury Dr NW
Rochester, MN 55901
|
1,943 sq. feet
|
2 baths 4 beds |
show details | |

|
#25
Conway Ct NW
Rochester, MN 55901
|
2,567 sq. feet
|
2 baths 3 beds |
show details | |

|
#26
9th Ave NE
Rochester, MN 55906
|
2,478 sq. feet
|
3 baths 4 beds |
show details | |

|
#27
2nd Ave NW
Dodge Center, MN 55927
|
960 sq. feet
|
1 baths 3 beds |
show details | |

|
#28
59th St NW
Rochester, MN 55901
|
1,756 sq. feet
|
2 baths 2 beds |
show details | |

|
#29
3rd Ave SW
Rochester, MN 55902
|
1,536 sq. feet
|
2 baths 3 beds |
show details | |

|
#30
16 1/2 St NW
Rochester, MN 55901
|
1,584 sq. feet
|
2 baths 3 beds |
show details |
| Photo | Address | Area | Beds / Baths | Price | Details |
|---|---|---|---|---|---|

|
#31
21st Ave NW
Rochester, MN 55901
|
2,029 sq. feet
|
2 baths 3 beds |
show details | |

|
#32
11th Ave NE
Rochester, MN 55906
|
1,728 sq. feet
|
1 baths 2 beds |
show details | |

|
#33
10th Ave NE
Rochester, MN 55906
|
1,152 sq. feet
|
1 baths 3 beds |
show details | |

|
#34
28th St NW
Rochester, MN 55901
|
1,210 sq. feet
|
2 baths 3 beds |
show details | |

|
#35
Hampton Rhodes Ct NW
Rochester, MN 55901
|
1,812 sq. feet
|
2 baths 4 beds |
show details | |

|
#36
14th St NE
Rochester, MN 55906
|
1,685 sq. feet
|
1 baths 3 beds |
show details | |

|
#37
Shardlow Ln NE
Byron, MN 55920
|
1,584 sq. feet
|
2 baths 2 beds |
show details | |

|
#38
13th Ave NW
Rochester, MN 55901
|
1,610 sq. feet
|
2 baths 4 beds |
show details | |

|
#39
Knoll Ct NW
Rochester, MN 55901
|
2,415 sq. feet
|
3 baths 4 beds |
show details | |

|
#40
5th Ave NE
Rochester, MN 55906
|
2,771 sq. feet
|
3 baths 4 beds |
show details |
| Photo | Address | Area | Beds / Baths | Price | Details |
|---|---|---|---|---|---|

|
#41
9th Ave NW
Rochester, MN 55901
|
1,006 sq. feet
|
1 baths 2 beds |
show details | |

|
#42
Belfry Ln NW
Rochester, MN 55901
|
900 sq. feet
|
1 baths 2 beds |
show details | |

|
#43
Valkyrie Dr NW Apt 300
Rochester, MN 55901
|
1,290 sq. feet
|
2 baths 3 beds |
show details | |

|
#44
36th St SW
Rochester, MN 55902
|
1,944 sq. feet
|
2 baths 4 beds |
show details | |

|
#45
SE 8 1/2 Ave
Rochester, MN 55904
|
1,851 sq. feet
|
2 baths 4 beds |
show details | |

|
#46
11th Ave NE
Rochester, MN 55906
|
1,918 sq. feet
|
2 baths 4 beds |
show details | |

|
#47
9th St NW
Rochester, MN 55901
|
1,941 sq. feet
|
2 baths 4 beds |
show details | |

|
#48
8 1 2 St NW
Rochester, MN 55901
|
1,056 sq. feet
|
1 baths 3 beds |
show details | |

|
#49
50th St SW
Byron, MN 55920
|
2,728 sq. feet
|
3 baths 4 beds |
show details | |

|
Check over 1 million property listings on Foreclosure.com!
|
browse all offers | |||

Latest news about housing in Kasson, MN collected exclusively by city-data.com from local newspapers, TV, and radio stations

 | Rochester MN questions. Homes under 300,000 (6 replies) |
| Moving to Rochester area, suggestions? (12 replies) |
| Relocating to Rochester, MN. Need suggestions please!! (13 replies) |
| What are nice cities to live up to an hour away from the Mayo Clinic (6 replies) |
| Byron/Rochester (7 replies) |
| New home communities in Byron, MN besides Somerby? (4 replies) |

Median year apartment built: 1980
Household type by relationship:
Households: 6,881- Male householders: 1,188 (166 living alone), Female householders: 1,308 (310 living alone)
1,646 spouses (1,624 opposite-sex spouses), 145 unmarried partners, (145 opposite-sex unmarried partners), 2,181 children (2,146 natural, 18 adopted, 17 stepchildren), 33 grandchildren, 18 brothers or sisters, 43 parents, 0 foster children, 58 other relatives, 229 non-relatives
- In group quarters: 29
Size of family households: 820 2-persons, 368 3-persons, 465 4-persons, 244 5-persons, 41 6-persons, 24 7-or-more-persons.
Size of nonfamily households: 496 1-person, 24 2-persons, 56 4-persons.
1,394 married couples with children.
386 single-parent households (132 men, 254 women).
94.2% of residents of Kasson speak English at home.
4.4% of residents speak Spanish at home (65% speak English very well, 7% speak English well, 20% speak English not well, 8% don't speak English at all).
0.4% of residents speak other Indo-European language at home (100% speak English very well).
0.5% of residents speak other language at home (100% speak English well).
Foreign born population: 337 (4.9%)
(12.8% of them are naturalized citizens)
| Here: | 7.2 |
| State: | 7.1 |
| Here: | 4.0 |
| State: | 3.8 |

- Bedrooms in owner-occupied houses and condos in Kasson, Minnesota
- 0no bedroom
- 361 bedroom
- 3522 bedrooms
- 9613 bedrooms
- 8584 bedrooms
- 855+ bedrooms

- Bedrooms in renter-occupied apartments in Kasson, Minnesota
- 0no bedroom
- 761 bedroom
- 1462 bedrooms
- 443 bedrooms
- 04 bedrooms
- 05+ bedrooms

- Cars and other vehicles available in Kasson in owner-occupied houses/condos
- 27no vehicle
- 4221 vehicle
- 8562 vehicles
- 7773 vehicles
- 1124 vehicles
- 995+ vehicles

- Cars and other vehicles available in Kasson in renter-occupied apartments
- 87no vehicle
- 1141 vehicle
- 412 vehicles
- 243 vehicles
- 04 vehicles
- 05+ vehicles

- Rooms in owner-occupied houses in Kasson, Minnesota
- 01 room
- 02 rooms
- 833 rooms
- 614 rooms
- 1815 rooms
- 6036 rooms
- 3137 rooms
- 4028 rooms
- 6499+ rooms

- Rooms in renter-occupied apartments in Kasson, Minnesota
- 01 room
- 02 rooms
- 873 rooms
- 814 rooms
- 195 rooms
- 566 rooms
- 247 rooms
- 08 rooms
- 09+ rooms


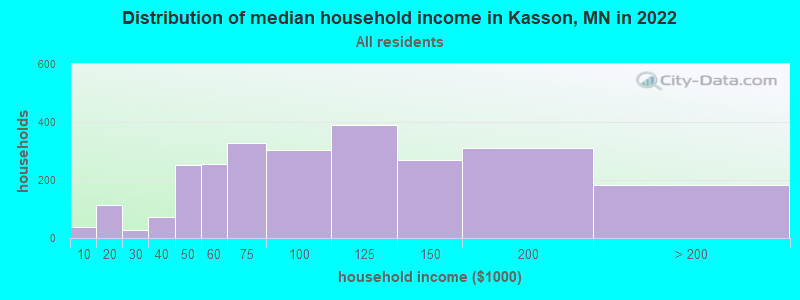
Kasson, MN household income distribution

- 39Less than $10,000
- 113$10,000 to $19,999
- 29$20,000 to $29,999
- 73$30,000 to $39,999
- 252$40,000 to $49,999
- 256$50,000 to $59,999
- 326$60,000 to $74,999
- 304$75,000 to $99,999
- 390$100,000 to $124,999
- 270$125,000 to $149,999
- 311$150,000 to $199,999
- 183$200,000 or more
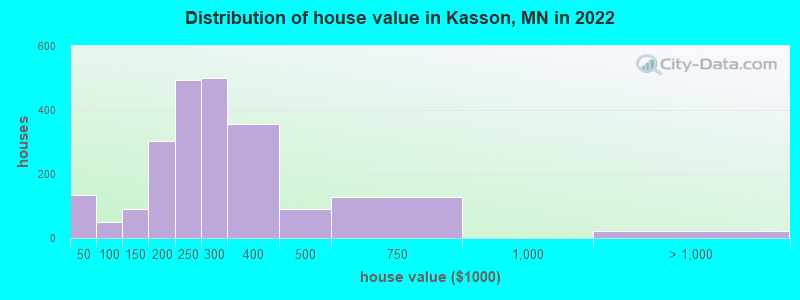
Home value of owner - occupied houses in 2022 in Kasson, MN
-
- 22Less than $10,000
- 19$10,000 to $14,999
- 6$15,000 to $19,999
- 29$20,000 to $24,999
- 18$25,000 to $29,999
- 37$40,000 to $49,999
- 12$60,000 to $69,999
- 60$100,000 to $124,999
- 30$125,000 to $149,999
- 105$150,000 to $174,999
- 197$175,000 to $199,999
- 493$200,000 to $249,999
- 499$250,000 to $299,999
- 356$300,000 to $399,999
- 92$400,000 to $499,999
- 128$500,000 to $749,999
- 22$1,000,000 to $1,499,999
Rent paid by renters in 2022 in Kasson, MN
-
- 36$150 to $199
- 56$650 to $699
- 41$700 to $749
- 25$800 to $899
- 40$900 to $999
- 42$1,000 to $1,249
- 24$1,250 to $1,499


Percentage of workers working in this county: 37.9%
Number of people working at home: 347 (9.6% of all workers)
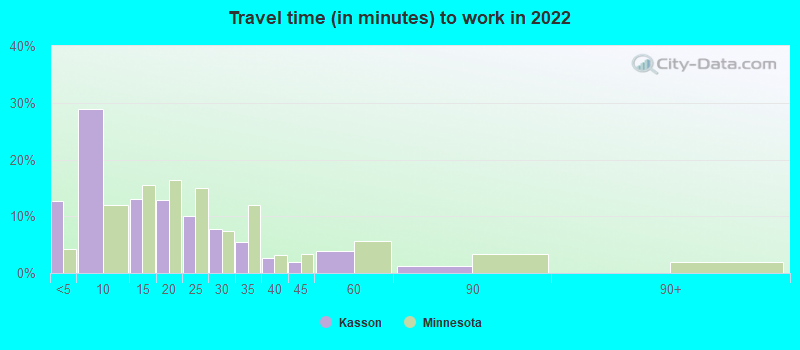
Travel time to work (commute)
- Less than 5 minutes: 203
- 5 to 9 minutes: 352
- 10 to 14 minutes: 210
- 15 to 19 minutes: 389
- 20 to 24 minutes: 599
- 25 to 29 minutes: 538
- 30 to 34 minutes: 542
- 35 to 39 minutes: 102
- 40 to 44 minutes: 62
- 45 to 59 minutes: 93
- 60 to 89 minutes: 76
- 90 or more minutes: 41

Means of transportation to work:
- Drove a car alone: 1,161 (66.2%)
- Carpooled: 237 (13.5%)
- Taxi: 6 (0.3%)
- Bicycle: 15 (0.9%)
- Walked: 6 (0.3%)
- Worked at home: 347 (19.8%)

- Unemployment by race in 2022
- Unemployment rate for White non-Hispanic residents
- 5.2%Males

- Year of entry for the foreign-born population in Kasson, Minnesota
- 1212010 or later
- 952000 to 2009
- 931990 to 1999
- 311980 to 1989
- 61970 to 1979
- 15Before 1970

First ancestries reported:
- German: 687 (30.0%)
- Norwegian: 332 (14.5%)
- Canadian: 175 (7.6%)
- American: 172 (7.5%)
- Swedish: 108 (4.7%)
- English: 94 (4.1%)
- Irish: 84 (3.7%)
- Italian: 66 (2.9%)
- European: 60 (2.6%)
- Ukrainian: 60 (2.6%)
- Scottish: 30 (1.3%)
- Greek: 27 (1.2%)
- Danish: 26 (1.1%)
- French: 20 (0.9%)
- Welsh: 17 (0.7%)
- British: 16 (0.7%)
- Polish: 13 (0.6%)
- Scandinavian: 10 (0.4%)
Most common places of birth for foreign-born residents (%):
| Kasson: | 41.8% (141) |
| Minnesota: | 12.1% (58,312) |
| Kasson: | 35.9% (121) |
| Minnesota: | 2.5% (11,939) |
| Kasson: | 10.1% (34) |
| Minnesota: | 0.3% (1,385) |
| Kasson: | 8.3% (28) |
| Minnesota: | 0.1% (333) |
| Kasson: | 4.2% (14) |
| Minnesota: | 1.4% (6,706) |
| Kasson: | 3.3% (11) |
| Minnesota: | 0.1% (437) |
Place of birth for U.S.-born residents:
- This state: 5,069
- Other state: 1,406
- Northeast: 229
- Midwest: 892
- South: 128
- West: 156
88.0% of Kasson residents lived in the same house 1 years ago.
Out of people who lived in different houses, 29.4% lived in this county.
Out of people who lived in different counties, 84.8% lived in Minnesota.
| Kasson: | 88.0% |
| State average: | 87.4% |
Education attainment for males 25 years and older:
- No schooling: 27
- Nursery to 4th grade: 0
- 5th and 6th grade: 0
- 7th and 8th grade: 0
- 9th grade: 0
- 10th grade: 0
- 11th grade: 16
- 12th grade, no diploma: 7
- High school graduate (or equivalency): 676
- Less than 1 year of college: 139
- Some college more than 1 year, no degree: 303
- Associate degree: 234
- Bachelor's degree: 558
- Master's degree: 174
- Professional school degree: 0
- Doctorate degree: 0

Education attainment for females 25 years and older:
- No schooling: 46
- Nursery to 4th grade: 0
- 5th and 6th grade: 0
- 7th and 8th grade: 0
- 9th grade: 0
- 10th grade: 17
- 11th grade: 0
- 12th grade, no diploma: 23
- High school graduate (or equivalency): 271
- Less than 1 year of college: 297
- Some college more than 1 year, no degree: 194
- Associate degree: 534
- Bachelor's degree: 724
- Master's degree: 196
- Professional school degree: 0
- Doctorate degree: 16


Housing units in structures:
- One, detached: 2,155
- One, attached: 93
- Two: 41
- 3 or 4: 28
- 5 to 9: 53
- 10 to 19: 26
- 20 to 49: 88
- Mobile homes: 227
House/condo owner moved in on average 8 years ago
Renter moved in on average 2 years ago

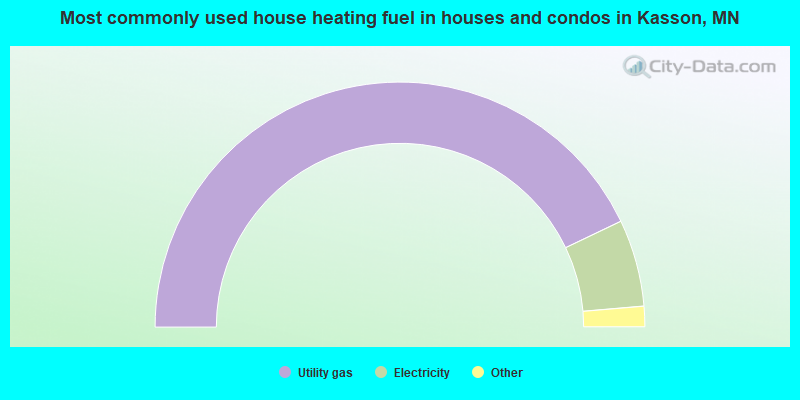
- 85.8%Utility gas
- 11.5%Electricity
- 2.1%Bottled, tank, or LP gas
- 0.6%Wood
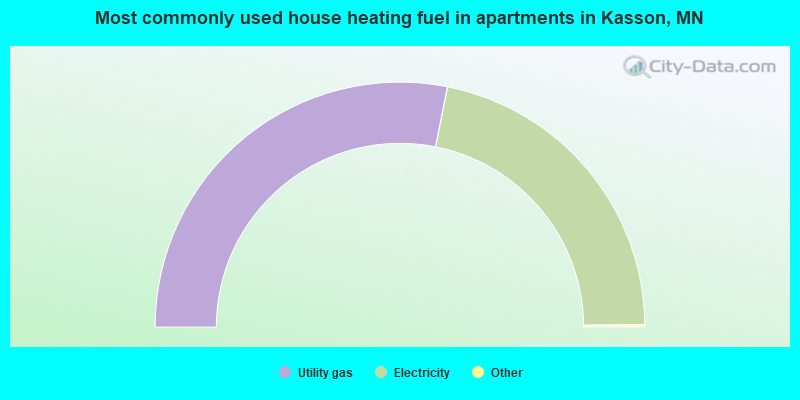
- 56.4%Utility gas
- 43.6%Electricity
Private vs. public school enrollment:
| Here: | 4.9% |
| Minnesota: | 12.9% |
| Here: | 0.0% |
| Minnesota: | 8.6% |
| Here: | 23.2% |
| Minnesota: | 26.2% |


