Lakeville, MN (Minnesota) Houses and Residents
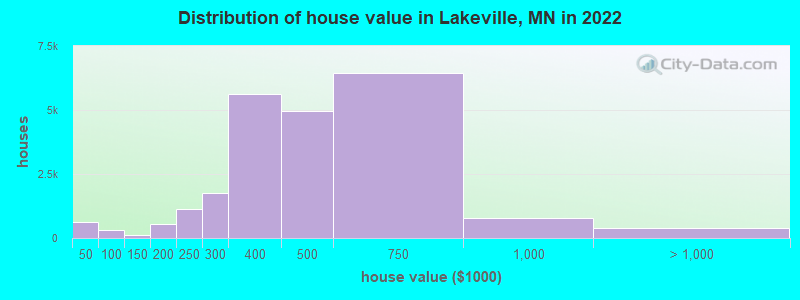
Estimated median house or condo value in 2022: $446,100 (it was $165,400 in 2000 )
Lakeville:
$446,100Minnesota:
$314,600
Lower value quartile - upper value quartile: $332,500 - $602,000Mean price in 2022: Detached houses: $473,647 Here:
$473,647State:
$374,552
Townhouses or other attached units: $315,692 Here:
$315,692State:
$312,049
In 3-to-4-unit structures: $190,500 Here:
$190,500State:
$238,971
In 5-or-more-unit structures: $181,015 Here:
$181,015State:
$258,516
Mobile homes: $40,109 Here:
$40,109State:
$94,605
Total population: 59,866 (Urban population: 41,958, Rural population: 1,170 (48 farm, 1,122 nonfarm ))
Houses: 27,263 (26,823 occupied: 21,894 owner occupied, 4,929 renter occupied )
% of renters here:
18%State:
28%
Housing density: 754 houses/condos per square mile
Median price asked for vacant for-sale houses and condos in 2022: $334,634.
Median contract rent in 2022: $1,462 (lower quartile is $1,112, upper quartile is $1,833)
Median rent asked for vacant for-rent units in 2022: $691
Median gross rent in Lakeville, MN in 2022: $1,673
Housing units in Lakeville with a mortgage: 16,848 (1,814 second mortgage, 150 home equity loan, 1,553 both second mortgage and home equity loan )Houses without a mortgage: 305
Median household income for houses/condos with a mortgage: $149,288
Median household income for apartments without a mortgage: $92,069
Median monthly housing costs: $1,888
Data:
Median house or condo value ($)
Median house or condo value ($ change since 2000)
Median house or condo value ($) - White
Median house or condo value ($) - Black or African American
Median house or condo value ($) - Asian
Median house or condo value ($) - Hispanic or Latino
Median house or condo value ($) - American Indian and Alaska Native
Median house or condo value ($) - Multirace
Median house or condo value ($) - Other Race
Median price asked for mobile homes ($)
Household density (households per square mile)
Mean house or condo value by units in structure - 1, detached ($)
Mean house or condo value by units in structure - 1, attached ($)
Mean house or condo value by units in structure - 2 ($)
Mean house or condo value by units in structure by units in structure - 3 or 4 ($)
Mean house or condo value by units in structure - 5 or more ($)
Mean house or condo value by units in structure - Boat, RV, van, etc. ($)
Mean house or condo value by units in structure - Mobile home ($)
Median contract rent ($)
Median contract rent - Lower quartile ($)
Median contract rent - Upper quartile ($)
Median gross rent ($)
Urban houses (%)
Rural houses (%)
Houses occupied (%)
Houses occupied (% change since 2000)
Houses owner occupied (%)
Houses owner occupied (% change since 2000)
Houses renter occupied (%)
Houses renter occupied (% change since 2000)
Vacant housing units - For rent (%)
Vacant housing units - For rent (% change since 2000)
Vacant housing units - For sale only (%)
Vacant housing units - For sale only (% change since 2000)
Vacant housing units - Rented or sold, not occupied (%)
Vacant housing units - Rented or sold, not occupied (% change since 2000)
Vacant housing units - For seasonal, recreational, or occasional use (%)
Vacant housing units - For seasonal, recreational, or occasional use (% change since 2000)
Vacant housing units - For migrant workers (%)
Vacant housing units - For migrant workers (% change since 2000)
Vacant housing units - Other vacant (%)
Vacant housing units - Other vacant (% change since 2000)
Median monthly housing costs ($)
Median household income for houses/condos with a mortgage ($)
Median household income for houses/condos without a mortgage ($)
Median household income ($)
Median household income ($) - White
Median household income ($) - Black or African American
Median household income ($) - Asian
Median household income ($) - Hispanic or Latino
Median household income ($) - American Indian and Alaska Native
Median household income ($) - Multirace
Median household income ($) - Other Race
Mortgage status - with mortgage (%)
Mortgage status - with second mortgage (%)
Mortgage status - with home equity loan (%)
Mortgage status - with both second mortgage and home equity loan (%)
Mortgage status - without a mortgage (%)
Median year house/condo built
Median year apartment built
Household type by relationship - Male householder living alone (%)
Household type by relationship - Male householder not living alone (%)
Household type by relationship - Female householder living alone (%)
Household type by relationship - Female householder not living alone (%)
Household type by relationship - Opposite-Sex spouse (%)
Household type by relationship - Same-Sex spouse (%)
Household type by relationship - Opposite-Sex unmarried partner (%)
Household type by relationship - Same-Sex unmarried partner (%)
Household type by relationship - In group quarters (%)
Size of family households - 2-person household (%)
Size of family households - 3-person household (%)
Size of family households - 4-person household (%)
Size of family households - 5-person household (%)
Size of family households - 6-person household (%)
Size of family households - 7-or-more-person household (%)
Size of nonfamily households - 1-person household (%)
Size of nonfamily households - 2-person household (%)
Size of nonfamily households - 3-person household (%)
Size of nonfamily households - 4-person household (%)
Size of nonfamily households - 5-person household (%)
Size of nonfamily households - 6-person household (%)
Size of nonfamily households - 7-or-moreperson household (%)
Year house built - Built 2010 or later (%)
Year house built - Built 2000 to 2009 (%)
Year house built - Built 1990 to 1999 (%)
Year house built - Built 1980 to 1989 (%)
Year house built - Built 1970 to 1979 (%)
Year house built - Built 1960 to 1969 (%)
Year house built - Built 1950 to 1959 (%)
Year house built - Built 1940 to 1949 (%)
Year house built - Built 1939 or earlier (%)
Median number of rooms in houses and condos
Median number of rooms in apartments
Median number of bedrooms in owner occupied houses
Mean number of bedrooms in owner occupied houses
Median number of bedrooms in renter occupied houses
Mean number of bedrooms in renter occupied houses
Median number of vehichles in owner occupied houses
Mean number of vehichles in owner occupied houses
Median number of vehichles in renter occupied houses
Mean number of vehichles in renter occupied houses
Rooms in owner-occupied houses - 1 room (%)
Rooms in owner-occupied houses - 2 rooms (%)
Rooms in owner-occupied houses - 3 rooms (%)
Rooms in owner-occupied houses - 4 rooms (%)
Rooms in owner-occupied houses - 5 rooms (%)
Rooms in owner-occupied houses - 6 rooms (%)
Rooms in owner-occupied houses - 7 rooms (%)
Rooms in owner-occupied houses - 8 rooms (%)
Rooms in owner-occupied houses - 9+ rooms (%)
Rooms in renter-occupied houses - 1 room (%)
Rooms in renter-occupied houses - 2 rooms (%)
Rooms in renter-occupied houses - 3 rooms (%)
Rooms in renter-occupied houses - 4 rooms (%)
Rooms in renter-occupied houses - 5 rooms (%)
Rooms in renter-occupied houses - 6 rooms (%)
Rooms in renter-occupied houses - 7 rooms (%)
Rooms in renter-occupied houses - 8 rooms (%)
Rooms in renter-occupied houses - 9+ rooms (%)
Bedrooms in owner-occupied houses - no bedrooms (%)
Bedrooms in owner-occupied houses - 1 bedroom (%)
Bedrooms in owner-occupied houses - 2 bedrooms (%)
Bedrooms in owner-occupied houses - 3 bedrooms (%)
Bedrooms in owner-occupied houses - 4 bedrooms (%)
Bedrooms in owner-occupied houses - 5+ bedrooms (%)
Bedrooms in renter-occupied houses - no bedrooms (%)
Bedrooms in renter-occupied houses - 1 bedroom (%)
Bedrooms in renter-occupied houses - 2 bedrooms (%)
Bedrooms in renter-occupied houses - 3 bedrooms (%)
Bedrooms in renter-occupied houses - 4 bedrooms (%)
Bedrooms in renter-occupied houses - 5+ bedrooms (%)
Vehicles available in owner-occupied houses - no vehicle available (%)
Vehicles available in owner-occupied houses - 1 vehicle available(%)
Vehicles available in owner-occupied houses - 2 Vehicles available (%)
Vehicles available in owner-occupied houses - 3 Vehicles available (%)
Vehicles available in owner-occupied houses - 4 Vehicles available (%)
Vehicles available in owner-occupied houses - 5+ Vehicles available (%)
Vehicles available in renter-occupied houses - no vehicle available (%)
Vehicles available in renter-occupied houses - 1 vehicle available (%)
Vehicles available in renter-occupied houses - 2 Vehicles available (%)
Vehicles available in renter-occupied houses - 3 Vehicles available (%)
Vehicles available in renter-occupied houses - 4 Vehicles available (%)
Vehicles available in renter-occupied houses - 5+ Vehicles available (%)
Housing units in structures - 1, detached (%)
Housing units in structures - 1, attached (%)
Housing units in structures - 2 (%)
Housing units in structures - 3 or 4 (%)
Housing units in structures - 5 to 9 (%)
Housing units in structures - 10 to 19 (%)
Housing units in structures - 20 to 49 (%)
Housing units in structures - 50 or more (%)
Housing units in structures - Mobile home (%)
Housing units in structures - Boat, RV, van, etc. (%)
Housing units in structures - Owners - 1, detached (%)
Housing units in structures - Owners - 1, attached (%)
Housing units in structures - Owners - 2 (%)
Housing units in structures - Owners - 3 or 4 (%)
Housing units in structures - Owners - 5 to 9 (%)
Housing units in structures - Owners - 10 to 19 (%)
Housing units in structures - Owners - 20 to 49 (%)
Housing units in structures - Owners - 50 or more (%)
Housing units in structures - Owners - Mobile home (%)
Housing units in structures - Owners - Boat, RV, van, etc. (%)
Housing units in structures - Renters - 1, detached (%)
Housing units in structures - Renters - 1, attached (%)
Housing units in structures - Renters - 2 (%)
Housing units in structures - Renters - 3 or 4 (%)
Housing units in structures - Renters - 5 to 9 (%)
Housing units in structures - Renters - 10 to 19 (%)
Housing units in structures - Renters - 20 to 49 (%)
Housing units in structures - Renters - 50 or more (%)
Housing units in structures - Renters - Mobile home (%)
Housing units in structures - Renters - Boat, RV, van, etc. (%)
House/condo owner moved in on average (years ago)
Renter moved in on average (years ago)
Year householder moved into unit - Moved in 1999 to March 2000 (%)
Year householder moved into unit - Moved in 1999 to March 2000 (%) - White
Year householder moved into unit - Moved in 1999 to March 2000 (%) - Black or African American
Year householder moved into unit - Moved in 1999 to March 2000 (%) - Asian
Year householder moved into unit - Moved in 1999 to March 2000 (%) - Hispanic or Latino
Year householder moved into unit - Moved in 1999 to March 2000 (%) - American Indian and Alaska Native
Year householder moved into unit - Moved in 1999 to March 2000 (%) - Multirace
Year householder moved into unit - Moved in 1999 to March 2000 (%) - Other Race
Year householder moved into unit - Moved in 1995 to 1998 (%)
Year householder moved into unit - Moved in 1995 to 1998 (%) - White
Year householder moved into unit - Moved in 1995 to 1998 (%) - Black or African American
Year householder moved into unit - Moved in 1995 to 1998 (%) - Asian
Year householder moved into unit - Moved in 1995 to 1998 (%) - Hispanic or Latino
Year householder moved into unit - Moved in 1995 to 1998 (%) - American Indian and Alaska Native
Year householder moved into unit - Moved in 1995 to 1998 (%) - Multirace
Year householder moved into unit - Moved in 1995 to 1998 (%) - Other Race
Year householder moved into unit - Moved in 1990 to 1994 (%)
Year householder moved into unit - Moved in 1990 to 1994 (%) - White
Year householder moved into unit - Moved in 1990 to 1994 (%) - Black or African American
Year householder moved into unit - Moved in 1990 to 1994 (%) - Asian
Year householder moved into unit - Moved in 1990 to 1994 (%) - Hispanic or Latino
Year householder moved into unit - Moved in 1990 to 1994 (%) - American Indian and Alaska Native
Year householder moved into unit - Moved in 1990 to 1994 (%) - Multirace
Year householder moved into unit - Moved in 1990 to 1994 (%) - Other Race
Year householder moved into unit - Moved in 1980 to 1989 (%)
Year householder moved into unit - Moved in 1980 to 1989 (%) - White
Year householder moved into unit - Moved in 1980 to 1989 (%) - Black or African American
Year householder moved into unit - Moved in 1980 to 1989 (%) - Asian
Year householder moved into unit - Moved in 1980 to 1989 (%) - Hispanic or Latino
Year householder moved into unit - Moved in 1980 to 1989 (%) - American Indian and Alaska Native
Year householder moved into unit - Moved in 1980 to 1989 (%) - Multirace
Year householder moved into unit - Moved in 1980 to 1989 (%) - Other Race
Year householder moved into unit - Moved in 1970 to 1979 (%)
Year householder moved into unit - Moved in 1970 to 1979 (%) - White
Year householder moved into unit - Moved in 1970 to 1979 (%) - Black or African American
Year householder moved into unit - Moved in 1970 to 1979 (%) - Asian
Year householder moved into unit - Moved in 1970 to 1979 (%) - Hispanic or Latino
Year householder moved into unit - Moved in 1970 to 1979 (%) - American Indian and Alaska Native
Year householder moved into unit - Moved in 1970 to 1979 (%) - Multirace
Year householder moved into unit - Moved in 1970 to 1979 (%) - Other Race
Year householder moved into unit - Moved in 1969 or earlier (%)
Year householder moved into unit - Moved in 1969 or earlier (%) - White
Year householder moved into unit - Moved in 1969 or earlier (%) - Black or African American
Year householder moved into unit - Moved in 1969 or earlier (%) - Asian
Year householder moved into unit - Moved in 1969 or earlier (%) - Hispanic or Latino
Year householder moved into unit - Moved in 1969 or earlier (%) - American Indian and Alaska Native
Year householder moved into unit - Moved in 1969 or earlier (%) - Multirace
Year householder moved into unit - Moved in 1969 or earlier (%) - Other Race
Housing units lacking complete plumbing facilities (%)
Housing units lacking complete kitchen facilities (%)
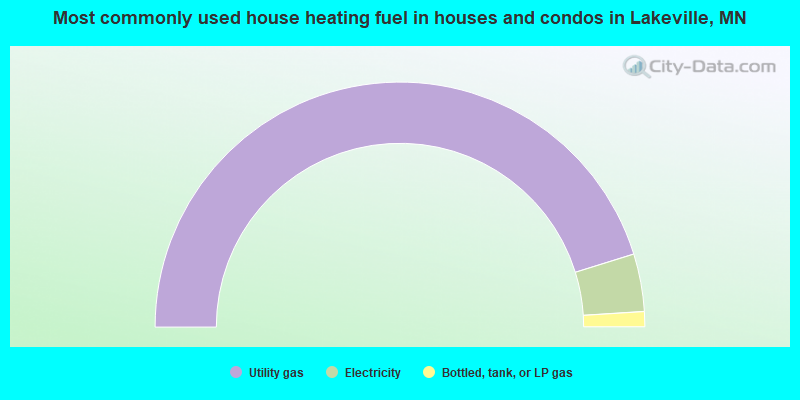
House heating fuel used in houses and condos - Utility gas (%)
House heating fuel used in houses and condos - Bottled, tank, or LP gas (%)
House heating fuel used in houses and condos - Electricity (%)
House heating fuel used in houses and condos - Fuel oil, kerosene, etc. (%)
House heating fuel used in houses and condos - Coal or coke (%)
House heating fuel used in houses and condos - Wood (%)
House heating fuel used in houses and condos - Solar energy (%)
House heating fuel used in houses and condos - Other fuel (%)
House heating fuel used in houses and condos - No fuel used (%)
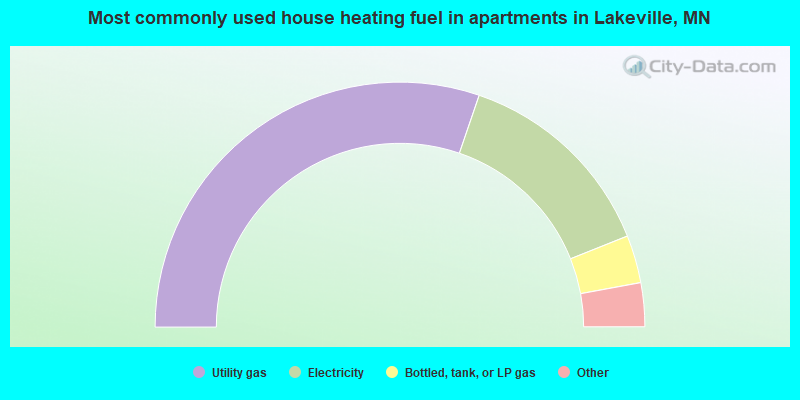
House heating fuel used in apartments - Utility gas (%)
House heating fuel used in apartments - Bottled, tank, or LP gas (%)
House heating fuel used in apartments - Electricity (%)
House heating fuel used in apartments - Fuel oil, kerosene, etc. (%)
House heating fuel used in apartments - Coal or coke (%)
House heating fuel used in apartments - Wood (%)
House heating fuel used in apartments - Solar energy (%)
House heating fuel used in apartments - Other fuel (%)
House heating fuel used in apartments - No fuel used (%)
Latest news about housing in Lakeville, MN collected exclusively by city-data.com from local newspapers, TV, and radio stations
Median year house/condo built: 1998Median year apartment built: 2004Household type by relationship:
Households: 74,551
Male householders: 14,180 (1,996 living alone ), Female householders: 12,643 (3,174 living alone )16,834 spouses (16,785 opposite-sex spouses ), 1,641 unmarried partners , (1,544 opposite-sex unmarried partners ), 26,519 children (25,143 natural , 202 adopted , 1,174 stepchildren ), 415 grandchildren , 309 brothers or sisters , 1,041 parents , 0 foster children , 120 other relatives , 709 non-relatives In group quarters: 140
Size of family households: 7,691 2-persons , 4,000 3-persons , 5,243 4-persons , 2,706 5-persons , 507 6-persons , 50 7-or-more-persons .
Size of nonfamily households: 5,170 1-person , 1,306 2-persons , 113 3-persons , 37 5-persons .
17,982 married couples with children. single-parent households (955 men , 1,965 women ).
87.9% of residents of Lakeville speak English at home. of residents speak Spanish at home (41% speak English very well , 35% speak English well , 20% speak English not well , 4% don't speak English at all ).of residents speak other Indo-European language at home (84% speak English very well , 11% speak English well , 4% speak English not well ).of residents speak Asian or Pacific Island language at home (65% speak English very well , 18% speak English well , 12% speak English not well , 4% don't speak English at all ).of residents speak other language at home (80% speak English very well , 13% speak English well , 7% speak English not well ).
Foreign born population: 6,214 (8.3%)of them are naturalized citizens )
Median number of rooms in houses and condos:
Median number of rooms in apartments
Owner-occupied Renter-occupied
Rooms in owner-occupied houses in Lakeville, Minnesota
0 1 room 0 2 rooms 255 3 rooms 1,168 4 rooms 1,464 5 rooms 2,208 6 rooms 3,637 7 rooms 2,752 8 rooms 10,410 9+ rooms
Rooms in renter-occupied apartments in Lakeville, Minnesota
163 1 room 236 2 rooms 1,121 3 rooms 1,693 4 rooms 630 5 rooms 793 6 rooms 130 7 rooms 0 8 rooms 163 9+ rooms
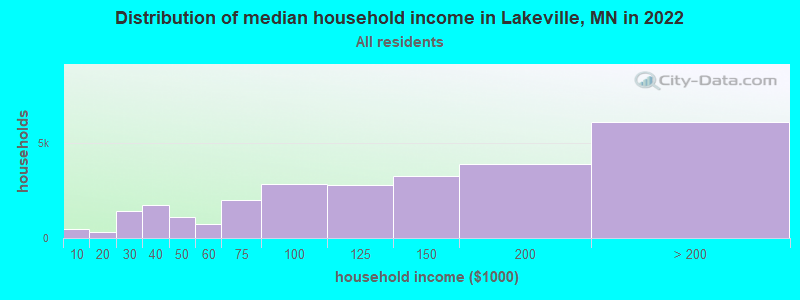
Lakeville, MN household income distribution 451 Less than $10,000329 $10,000 to $19,9991,443 $20,000 to $29,9991,769 $30,000 to $39,9991,115 $40,000 to $49,999759 $50,000 to $59,9991,985 $60,000 to $74,9992,840 $75,000 to $99,9992,799 $100,000 to $124,9993,275 $125,000 to $149,9993,928 $150,000 to $199,9996,130 $200,000 or more
Home value of owner - occupied houses in 2022 in Lakeville, MN 187 Less than $10,00069 $10,000 to $14,99954 $15,000 to $19,99964 $20,000 to $24,99936 $25,000 to $29,99931 $30,000 to $34,99990 $35,000 to $39,999103 $40,000 to $49,999120 $50,000 to $59,99914 $60,000 to $69,99917 $70,000 to $79,99948 $80,000 to $89,9997 $90,000 to $99,99934 $100,000 to $124,99989 $125,000 to $149,999326 $150,000 to $174,999216 $175,000 to $199,9991,131 $200,000 to $249,9991,767 $250,000 to $299,9995,638 $300,000 to $399,9994,952 $400,000 to $499,9996,451 $500,000 to $749,999780 $750,000 to $999,999302 $1,000,000 to $1,499,999108 $2,000,000 or moreRent paid by renters in 2022 in Lakeville, MN 78 $150 to $19910 $250 to $29998 $300 to $34947 $450 to $49975 $500 to $54931 $550 to $59922 $650 to $69920 $700 to $74934 $750 to $799142 $800 to $899184 $900 to $999394 $1,000 to $1,249477 $1,250 to $1,4991,023 $1,500 to $1,999375 $2,000 to $2,49995 $2,500 to $2,99942 $3,000 to $3,499120 $3,500 or more254 No cash rent
Percentage of workers working in this county: 65.7%Number of people working at home: 9,275 (24.1% of all workers )
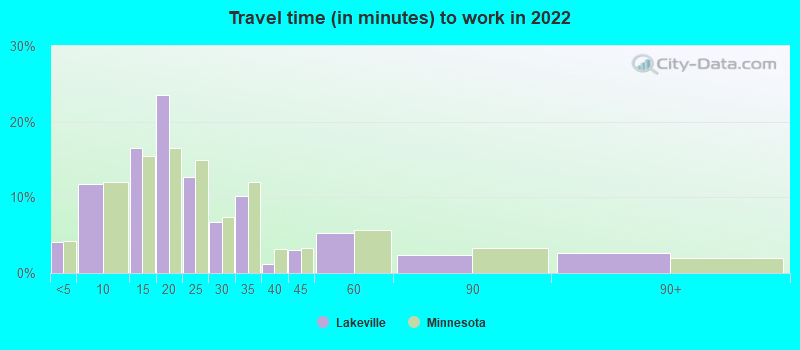
Travel time to work (commute)
Less than 5 minutes: 8155 to 9 minutes: 3,22510 to 14 minutes: 3,18415 to 19 minutes: 4,60620 to 24 minutes: 3,52325 to 29 minutes: 3,38930 to 34 minutes: 4,82035 to 39 minutes: 75840 to 44 minutes: 1,62345 to 59 minutes: 1,86860 to 89 minutes: 18490 or more minutes: 662
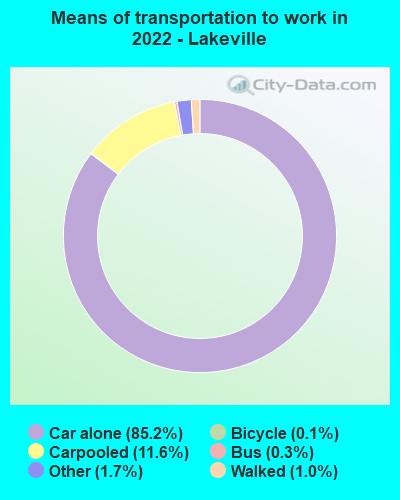
Means of transportation to work:
Drove a car alone: 14,462 (56.2%)Carpooled: 2,292 (8.9%)Bus : 53 (0.2%)Taxi: 496 (1.9%)Bicycle: 18 (0.1%)Walked: 166 (0.6%)Worked at home: 9,275 (36.1%)
Unemployment by race in 2022
Unemployment rate for White non-Hispanic residents 4.0% Males0.8% FemalesUnemployment rate for Black residents 3.5% Males12.9% FemalesUnemployment rate for Asian residents 10.4% Males2.7% FemalesUnemployment rate for other race residents 2.2% FemalesUnemployment rate for two or more race residents 3.9% Males2.0% FemalesUnemployment rate for Hispanic or Latino residents 6.7% Males2.3% Females
Year of entry for the foreign-born population in Lakeville, Minnesota
1,888 2010 or later 1,631 2000 to 2009 1,418 1990 to 1999 416 1980 to 1989 217 1970 to 1979 130 Before 1970
First ancestries reported:
German: 6,120 (21.6%)
Norwegian: 2,349 (8.3%)
American: 2,252 (7.9%)
European: 1,718 (6.1%)
English: 1,653 (5.8%)
Irish: 1,100 (3.9%)
Scandinavian: 838 (3.0%)
Italian: 777 (2.7%)
Swedish: 560 (2.0%)
Polish: 465 (1.6%)
Somali: 319 (1.1%)
African: 305 (1.1%)
Kenyan: 284 (1.0%)
Dutch: 218 (0.8%)
Czech: 187 (0.7%)
Czechoslovakian: 182 (0.6%)
Ethiopian: 171 (0.6%)
Eastern European: 156 (0.6%)
Slovak: 139 (0.5%)
Danish: 132 (0.5%)
Finnish: 115 (0.4%)
Scotch-Irish: 115 (0.4%)
Northern European: 113 (0.4%)
Russian: 113 (0.4%)
Afghan: 105 (0.4%)
French Canadian: 89 (0.3%)
Ukrainian: 83 (0.3%)
French: 80 (0.3%)
Guyanese: 77 (0.3%)
Haitian: 77 (0.3%)
West Indian: 60 (0.2%)
British: 49 (0.2%)
Belgian: 40 (0.1%)
Nigerian: 34 (0.1%)
Lebanese: 33 (0.1%)
Slavic: 33 (0.1%)
Swiss: 33 (0.1%)
Canadian: 32 (0.1%)
Romanian: 32 (0.1%)
Egyptian: 31 (0.1%)
Austrian: 25 (0.09%)
Brazilian: 25 (0.09%)
Hungarian: 20 (0.07%)
Sierra Leonean: 20 (0.07%)
Welsh: 15 (0.05%)
Lithuanian: 12 (0.04%)
Palestinian: 10 (0.04%)
Scottish: 10 (0.04%)
Croatian: 7 (0.02%)
Icelander: 7 (0.02%)
Greek: 7 (0.02%)
Liberian: 4 (0.01%)
Ghanaian: 3 (0.01%)
Most common places of birth for foreign-born residents (%): Mexico Lakeville:
12.1% (753)Minnesota:
12.1% (58,312)
Vietnam Lakeville:
8.2% (513)Minnesota:
3.8% (18,442)
Korea Lakeville:
6.2% (387)Minnesota:
2.4% (11,675)
Canada Lakeville:
6.0% (373)Minnesota:
2.5% (11,939)
Kenya Lakeville:
5.9% (371)Minnesota:
3.3% (15,701)
India Lakeville:
5.8% (359)Minnesota:
6.7% (32,141)
Ethiopia Lakeville:
5.0% (315)Minnesota:
5.1% (24,630)
Cambodia Lakeville:
4.9% (304)Minnesota:
0.9% (4,264)
Laos Lakeville:
3.7% (229)Minnesota:
5.1% (24,591)
Somalia Lakeville:
3.7% (229)Minnesota:
8.0% (38,461)
Germany Lakeville:
2.9% (182)Minnesota:
1.4% (6,670)
Pakistan Lakeville:
2.2% (138)Minnesota:
0.6% (2,729)
Cameroon Lakeville:
2.1% (132)Minnesota:
0.7% (3,598)
Nigeria Lakeville:
2.0% (125)Minnesota:
1.7% (8,263)
El Salvador Lakeville:
1.9% (120)Minnesota:
1.4% (6,841)
China, excluding Hong Kong and Taiwan Lakeville:
1.7% (106)Minnesota:
3.6% (17,119)
Place of birth for U.S.-born residents:
This state: 47,767Other state: 20,240Northeast: 1,773Midwest: 13,142South: 2,683West: 2,642 88.1% of Lakeville residents lived in the same house 1 years ago.
Out of people who lived in different houses, 37.6% lived in this county.
Out of people who lived in different counties, 59.0% lived in Minnesota.
Lakeville:
88.1%State average:
87.4%
Education attainment for males 25 years and older:
No schooling: 428Nursery to 4th grade: 05th and 6th grade: 07th and 8th grade: 09th grade: 010th grade: 011th grade: 5212th grade, no diploma: 392High school graduate (or equivalency): 2,369Less than 1 year of college: 1,665Some college more than 1 year, no degree: 3,421Associate degree: 2,501Bachelor's degree: 8,780Master's degree: 2,796Professional school degree: 774Doctorate degree: 332
Education attainment for females 25 years and older:
No schooling: 409Nursery to 4th grade: 05th and 6th grade: 07th and 8th grade: 09th grade: 010th grade: 011th grade: 13112th grade, no diploma: 215High school graduate (or equivalency): 3,978Less than 1 year of college: 1,096Some college more than 1 year, no degree: 3,592Associate degree: 2,394Bachelor's degree: 8,806Master's degree: 2,998Professional school degree: 848Doctorate degree: 297
Housing units in structures:
One, detached: 19,027One, attached: 3,922Two: 1743 or 4: 4675 to 9: 10810 to 19: 30020 to 49: 36250 or more: 1,885Mobile homes: 907Boats, RVs, vans, etc.: 111Median worth of mobile homes: $42,100
Housing units lacking complete plumbing facilities in 2022: 0.4%Housing units lacking complete kitchen facilities in 2022: 0.6%House/condo owner moved in on average 9 years ago
Renter moved in on average 2 years ago
Private vs. public school enrollment:
Students in private schools in grades 1 to 8 (elementary and middle school): 529 Students in private schools in grades 9 to 12 (high school): 86 Students in private undergraduate colleges: 697 Here:
25.2%Minnesota:
26.2%