Shakopee, MN (Minnesota) Houses and Residents
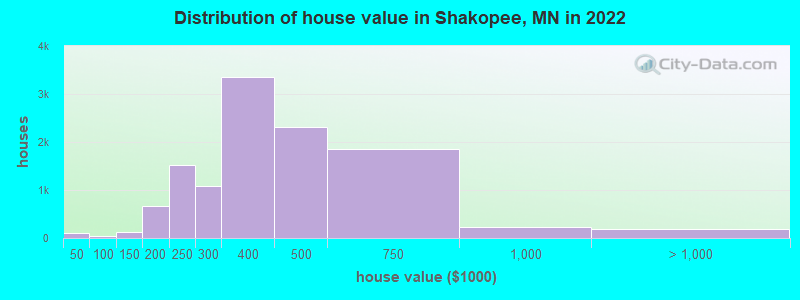
Estimated median house or condo value in 2022: $366,086 (it was $141,300 in 2000 )
Shakopee:
$366,086Minnesota:
$314,600
Lower value quartile - upper value quartile: $277,227 - $505,743Total population: 39,677 (Urban population: 17,244, Rural population: 3,255 (all nonfarm) )
Houses: 16,681 (16,116 occupied: 11,735 owner occupied, 4,320 renter occupied )
% of renters here:
27%State:
28%
Housing density: 618 houses/condos per square mile
Median price asked for vacant for-sale houses and condos in 2022: $185,166.
Median contract rent in 2022: $1,369 (lower quartile is $1,068, upper quartile is $1,863)
Median rent asked for vacant for-rent units in 2022: $2,025
Median gross rent in Shakopee, MN in 2022: $1,528
Housing units in Shakopee with a mortgage: 8,710 (875 second mortgage, 36 home equity loan, 440 both second mortgage and home equity loan )Houses without a mortgage: 230
Median household income for houses/condos with a mortgage: $126,686
Median household income for apartments without a mortgage: $78,541
Median monthly housing costs: $1,537
Data:
Median house or condo value ($)
Median house or condo value ($ change since 2000)
Median house or condo value ($) - White
Median house or condo value ($) - Black or African American
Median house or condo value ($) - Asian
Median house or condo value ($) - Hispanic or Latino
Median house or condo value ($) - American Indian and Alaska Native
Median house or condo value ($) - Multirace
Median house or condo value ($) - Other Race
Median price asked for mobile homes ($)
Household density (households per square mile)
Mean house or condo value by units in structure - 1, detached ($)
Mean house or condo value by units in structure - 1, attached ($)
Mean house or condo value by units in structure - 2 ($)
Mean house or condo value by units in structure by units in structure - 3 or 4 ($)
Mean house or condo value by units in structure - 5 or more ($)
Mean house or condo value by units in structure - Boat, RV, van, etc. ($)
Mean house or condo value by units in structure - Mobile home ($)
Median contract rent ($)
Median contract rent - Lower quartile ($)
Median contract rent - Upper quartile ($)
Median gross rent ($)
Urban houses (%)
Rural houses (%)
Houses occupied (%)
Houses occupied (% change since 2000)
Houses owner occupied (%)
Houses owner occupied (% change since 2000)
Houses renter occupied (%)
Houses renter occupied (% change since 2000)
Vacant housing units - For rent (%)
Vacant housing units - For rent (% change since 2000)
Vacant housing units - For sale only (%)
Vacant housing units - For sale only (% change since 2000)
Vacant housing units - Rented or sold, not occupied (%)
Vacant housing units - Rented or sold, not occupied (% change since 2000)
Vacant housing units - For seasonal, recreational, or occasional use (%)
Vacant housing units - For seasonal, recreational, or occasional use (% change since 2000)
Vacant housing units - For migrant workers (%)
Vacant housing units - For migrant workers (% change since 2000)
Vacant housing units - Other vacant (%)
Vacant housing units - Other vacant (% change since 2000)
Median monthly housing costs ($)
Median household income for houses/condos with a mortgage ($)
Median household income for houses/condos without a mortgage ($)
Median household income ($)
Median household income ($) - White
Median household income ($) - Black or African American
Median household income ($) - Asian
Median household income ($) - Hispanic or Latino
Median household income ($) - American Indian and Alaska Native
Median household income ($) - Multirace
Median household income ($) - Other Race
Mortgage status - with mortgage (%)
Mortgage status - with second mortgage (%)
Mortgage status - with home equity loan (%)
Mortgage status - with both second mortgage and home equity loan (%)
Mortgage status - without a mortgage (%)
Median year house/condo built
Median year apartment built
Household type by relationship - Male householder living alone (%)
Household type by relationship - Male householder not living alone (%)
Household type by relationship - Female householder living alone (%)
Household type by relationship - Female householder not living alone (%)
Household type by relationship - Opposite-Sex spouse (%)
Household type by relationship - Same-Sex spouse (%)
Household type by relationship - Opposite-Sex unmarried partner (%)
Household type by relationship - Same-Sex unmarried partner (%)
Household type by relationship - In group quarters (%)
Size of family households - 2-person household (%)
Size of family households - 3-person household (%)
Size of family households - 4-person household (%)
Size of family households - 5-person household (%)
Size of family households - 6-person household (%)
Size of family households - 7-or-more-person household (%)
Size of nonfamily households - 1-person household (%)
Size of nonfamily households - 2-person household (%)
Size of nonfamily households - 3-person household (%)
Size of nonfamily households - 4-person household (%)
Size of nonfamily households - 5-person household (%)
Size of nonfamily households - 6-person household (%)
Size of nonfamily households - 7-or-moreperson household (%)
Year house built - Built 2010 or later (%)
Year house built - Built 2000 to 2009 (%)
Year house built - Built 1990 to 1999 (%)
Year house built - Built 1980 to 1989 (%)
Year house built - Built 1970 to 1979 (%)
Year house built - Built 1960 to 1969 (%)
Year house built - Built 1950 to 1959 (%)
Year house built - Built 1940 to 1949 (%)
Year house built - Built 1939 or earlier (%)
Median number of rooms in houses and condos
Median number of rooms in apartments
Median number of bedrooms in owner occupied houses
Mean number of bedrooms in owner occupied houses
Median number of bedrooms in renter occupied houses
Mean number of bedrooms in renter occupied houses
Median number of vehichles in owner occupied houses
Mean number of vehichles in owner occupied houses
Median number of vehichles in renter occupied houses
Mean number of vehichles in renter occupied houses
Rooms in owner-occupied houses - 1 room (%)
Rooms in owner-occupied houses - 2 rooms (%)
Rooms in owner-occupied houses - 3 rooms (%)
Rooms in owner-occupied houses - 4 rooms (%)
Rooms in owner-occupied houses - 5 rooms (%)
Rooms in owner-occupied houses - 6 rooms (%)
Rooms in owner-occupied houses - 7 rooms (%)
Rooms in owner-occupied houses - 8 rooms (%)
Rooms in owner-occupied houses - 9+ rooms (%)
Rooms in renter-occupied houses - 1 room (%)
Rooms in renter-occupied houses - 2 rooms (%)
Rooms in renter-occupied houses - 3 rooms (%)
Rooms in renter-occupied houses - 4 rooms (%)
Rooms in renter-occupied houses - 5 rooms (%)
Rooms in renter-occupied houses - 6 rooms (%)
Rooms in renter-occupied houses - 7 rooms (%)
Rooms in renter-occupied houses - 8 rooms (%)
Rooms in renter-occupied houses - 9+ rooms (%)
Bedrooms in owner-occupied houses - no bedrooms (%)
Bedrooms in owner-occupied houses - 1 bedroom (%)
Bedrooms in owner-occupied houses - 2 bedrooms (%)
Bedrooms in owner-occupied houses - 3 bedrooms (%)
Bedrooms in owner-occupied houses - 4 bedrooms (%)
Bedrooms in owner-occupied houses - 5+ bedrooms (%)
Bedrooms in renter-occupied houses - no bedrooms (%)
Bedrooms in renter-occupied houses - 1 bedroom (%)
Bedrooms in renter-occupied houses - 2 bedrooms (%)
Bedrooms in renter-occupied houses - 3 bedrooms (%)
Bedrooms in renter-occupied houses - 4 bedrooms (%)
Bedrooms in renter-occupied houses - 5+ bedrooms (%)
Vehicles available in owner-occupied houses - no vehicle available (%)
Vehicles available in owner-occupied houses - 1 vehicle available(%)
Vehicles available in owner-occupied houses - 2 Vehicles available (%)
Vehicles available in owner-occupied houses - 3 Vehicles available (%)
Vehicles available in owner-occupied houses - 4 Vehicles available (%)
Vehicles available in owner-occupied houses - 5+ Vehicles available (%)
Vehicles available in renter-occupied houses - no vehicle available (%)
Vehicles available in renter-occupied houses - 1 vehicle available (%)
Vehicles available in renter-occupied houses - 2 Vehicles available (%)
Vehicles available in renter-occupied houses - 3 Vehicles available (%)
Vehicles available in renter-occupied houses - 4 Vehicles available (%)
Vehicles available in renter-occupied houses - 5+ Vehicles available (%)
Housing units in structures - 1, detached (%)
Housing units in structures - 1, attached (%)
Housing units in structures - 2 (%)
Housing units in structures - 3 or 4 (%)
Housing units in structures - 5 to 9 (%)
Housing units in structures - 10 to 19 (%)
Housing units in structures - 20 to 49 (%)
Housing units in structures - 50 or more (%)
Housing units in structures - Mobile home (%)
Housing units in structures - Boat, RV, van, etc. (%)
Housing units in structures - Owners - 1, detached (%)
Housing units in structures - Owners - 1, attached (%)
Housing units in structures - Owners - 2 (%)
Housing units in structures - Owners - 3 or 4 (%)
Housing units in structures - Owners - 5 to 9 (%)
Housing units in structures - Owners - 10 to 19 (%)
Housing units in structures - Owners - 20 to 49 (%)
Housing units in structures - Owners - 50 or more (%)
Housing units in structures - Owners - Mobile home (%)
Housing units in structures - Owners - Boat, RV, van, etc. (%)
Housing units in structures - Renters - 1, detached (%)
Housing units in structures - Renters - 1, attached (%)
Housing units in structures - Renters - 2 (%)
Housing units in structures - Renters - 3 or 4 (%)
Housing units in structures - Renters - 5 to 9 (%)
Housing units in structures - Renters - 10 to 19 (%)
Housing units in structures - Renters - 20 to 49 (%)
Housing units in structures - Renters - 50 or more (%)
Housing units in structures - Renters - Mobile home (%)
Housing units in structures - Renters - Boat, RV, van, etc. (%)
House/condo owner moved in on average (years ago)
Renter moved in on average (years ago)
Year householder moved into unit - Moved in 1999 to March 2000 (%)
Year householder moved into unit - Moved in 1999 to March 2000 (%) - White
Year householder moved into unit - Moved in 1999 to March 2000 (%) - Black or African American
Year householder moved into unit - Moved in 1999 to March 2000 (%) - Asian
Year householder moved into unit - Moved in 1999 to March 2000 (%) - Hispanic or Latino
Year householder moved into unit - Moved in 1999 to March 2000 (%) - American Indian and Alaska Native
Year householder moved into unit - Moved in 1999 to March 2000 (%) - Multirace
Year householder moved into unit - Moved in 1999 to March 2000 (%) - Other Race
Year householder moved into unit - Moved in 1995 to 1998 (%)
Year householder moved into unit - Moved in 1995 to 1998 (%) - White
Year householder moved into unit - Moved in 1995 to 1998 (%) - Black or African American
Year householder moved into unit - Moved in 1995 to 1998 (%) - Asian
Year householder moved into unit - Moved in 1995 to 1998 (%) - Hispanic or Latino
Year householder moved into unit - Moved in 1995 to 1998 (%) - American Indian and Alaska Native
Year householder moved into unit - Moved in 1995 to 1998 (%) - Multirace
Year householder moved into unit - Moved in 1995 to 1998 (%) - Other Race
Year householder moved into unit - Moved in 1990 to 1994 (%)
Year householder moved into unit - Moved in 1990 to 1994 (%) - White
Year householder moved into unit - Moved in 1990 to 1994 (%) - Black or African American
Year householder moved into unit - Moved in 1990 to 1994 (%) - Asian
Year householder moved into unit - Moved in 1990 to 1994 (%) - Hispanic or Latino
Year householder moved into unit - Moved in 1990 to 1994 (%) - American Indian and Alaska Native
Year householder moved into unit - Moved in 1990 to 1994 (%) - Multirace
Year householder moved into unit - Moved in 1990 to 1994 (%) - Other Race
Year householder moved into unit - Moved in 1980 to 1989 (%)
Year householder moved into unit - Moved in 1980 to 1989 (%) - White
Year householder moved into unit - Moved in 1980 to 1989 (%) - Black or African American
Year householder moved into unit - Moved in 1980 to 1989 (%) - Asian
Year householder moved into unit - Moved in 1980 to 1989 (%) - Hispanic or Latino
Year householder moved into unit - Moved in 1980 to 1989 (%) - American Indian and Alaska Native
Year householder moved into unit - Moved in 1980 to 1989 (%) - Multirace
Year householder moved into unit - Moved in 1980 to 1989 (%) - Other Race
Year householder moved into unit - Moved in 1970 to 1979 (%)
Year householder moved into unit - Moved in 1970 to 1979 (%) - White
Year householder moved into unit - Moved in 1970 to 1979 (%) - Black or African American
Year householder moved into unit - Moved in 1970 to 1979 (%) - Asian
Year householder moved into unit - Moved in 1970 to 1979 (%) - Hispanic or Latino
Year householder moved into unit - Moved in 1970 to 1979 (%) - American Indian and Alaska Native
Year householder moved into unit - Moved in 1970 to 1979 (%) - Multirace
Year householder moved into unit - Moved in 1970 to 1979 (%) - Other Race
Year householder moved into unit - Moved in 1969 or earlier (%)
Year householder moved into unit - Moved in 1969 or earlier (%) - White
Year householder moved into unit - Moved in 1969 or earlier (%) - Black or African American
Year householder moved into unit - Moved in 1969 or earlier (%) - Asian
Year householder moved into unit - Moved in 1969 or earlier (%) - Hispanic or Latino
Year householder moved into unit - Moved in 1969 or earlier (%) - American Indian and Alaska Native
Year householder moved into unit - Moved in 1969 or earlier (%) - Multirace
Year householder moved into unit - Moved in 1969 or earlier (%) - Other Race
Housing units lacking complete plumbing facilities (%)
Housing units lacking complete kitchen facilities (%)
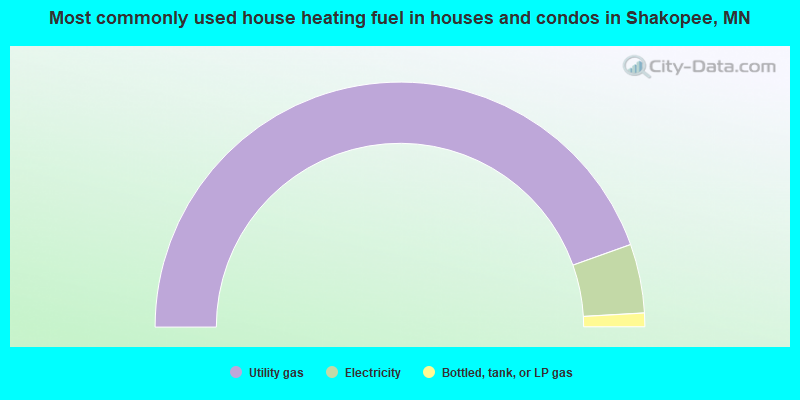
House heating fuel used in houses and condos - Utility gas (%)
House heating fuel used in houses and condos - Bottled, tank, or LP gas (%)
House heating fuel used in houses and condos - Electricity (%)
House heating fuel used in houses and condos - Fuel oil, kerosene, etc. (%)
House heating fuel used in houses and condos - Coal or coke (%)
House heating fuel used in houses and condos - Wood (%)
House heating fuel used in houses and condos - Solar energy (%)
House heating fuel used in houses and condos - Other fuel (%)
House heating fuel used in houses and condos - No fuel used (%)
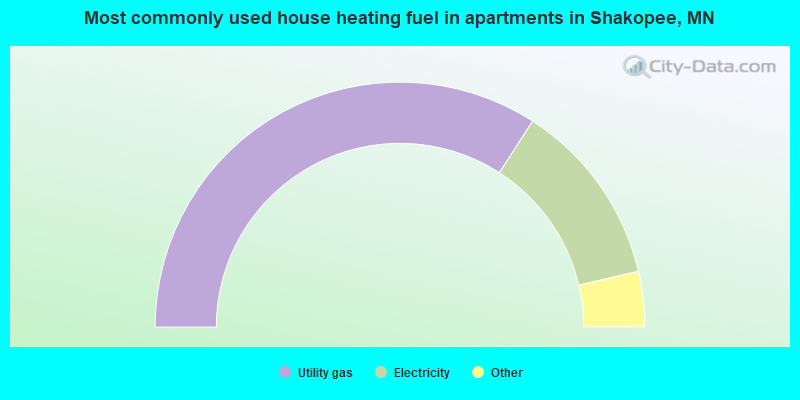
House heating fuel used in apartments - Utility gas (%)
House heating fuel used in apartments - Bottled, tank, or LP gas (%)
House heating fuel used in apartments - Electricity (%)
House heating fuel used in apartments - Fuel oil, kerosene, etc. (%)
House heating fuel used in apartments - Coal or coke (%)
House heating fuel used in apartments - Wood (%)
House heating fuel used in apartments - Solar energy (%)
House heating fuel used in apartments - Other fuel (%)
House heating fuel used in apartments - No fuel used (%)
Latest news about housing in Shakopee, MN collected exclusively by city-data.com from local newspapers, TV, and radio stations
Median year house/condo built: 2002Median year apartment built: 1997Household type by relationship:
Households: 45,060
Male householders: 8,515 (1,669 living alone ), Female householders: 7,380 (1,496 living alone )7,786 spouses (7,739 opposite-sex spouses ), 1,865 unmarried partners , (1,822 opposite-sex unmarried partners ), 13,931 children (13,268 natural , 253 adopted , 409 stepchildren ), 828 grandchildren , 956 brothers or sisters , 1,001 parents , 61 foster children , 873 other relatives , 965 non-relatives In group quarters: 893
Size of family households: 3,613 2-persons , 2,513 3-persons , 3,611 4-persons , 1,089 5-persons , 365 6-persons , 95 7-or-more-persons .
Size of nonfamily households: 3,589 1-person , 1,131 2-persons , 170 3-persons , 54 4-persons , 5 5-persons .
6,894 married couples with children. single-parent households (1,294 men , 2,265 women ).
76.3% of residents of Shakopee speak English at home. of residents speak Spanish at home (65% speak English very well , 18% speak English well , 13% speak English not well , 4% don't speak English at all ).of residents speak other Indo-European language at home (71% speak English very well , 9% speak English well , 9% speak English not well , 12% don't speak English at all ).of residents speak Asian or Pacific Island language at home (43% speak English very well , 33% speak English well , 20% speak English not well , 4% don't speak English at all ).of residents speak other language at home (66% speak English very well , 19% speak English well , 15% speak English not well ).
Foreign born population: 8,425 (18.7%)of them are naturalized citizens )
Median number of rooms in houses and condos:
Median number of rooms in apartments
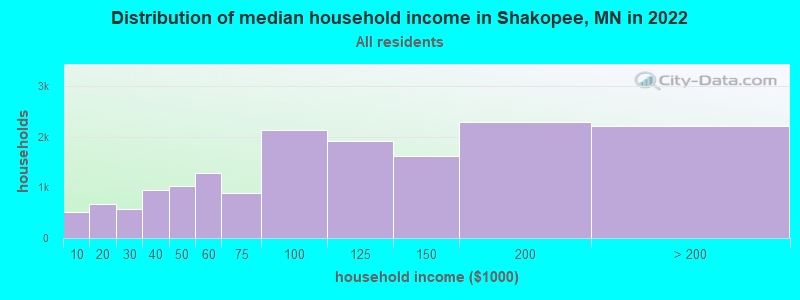
Shakopee, MN household income distribution 511 Less than $10,000667 $10,000 to $19,999573 $20,000 to $29,999944 $30,000 to $39,9991,036 $40,000 to $49,9991,278 $50,000 to $59,999897 $60,000 to $74,9992,140 $75,000 to $99,9991,924 $100,000 to $124,9991,613 $125,000 to $149,9992,293 $150,000 to $199,9992,222 $200,000 or more
Home value of owner - occupied houses in 2022 in Shakopee, MN 84 Less than $10,0002 $20,000 to $24,9993 $30,000 to $34,99911 $35,000 to $39,9999 $60,000 to $69,9992 $80,000 to $89,99931 $90,000 to $99,99982 $100,000 to $124,99945 $125,000 to $149,999192 $150,000 to $174,999468 $175,000 to $199,9991,523 $200,000 to $249,9991,088 $250,000 to $299,9993,353 $300,000 to $399,9992,318 $400,000 to $499,9991,857 $500,000 to $749,999221 $750,000 to $999,999119 $1,000,000 to $1,499,9991 $1,500,000 to $1,999,99975 $2,000,000 or moreRent paid by renters in 2022 in Shakopee, MN 40 Less than $10094 $150 to $19912 $200 to $24964 $250 to $29986 $300 to $34910 $350 to $39934 $400 to $449201 $450 to $49951 $500 to $54936 $600 to $64932 $700 to $74930 $750 to $799198 $800 to $899121 $900 to $9991,148 $1,000 to $1,249558 $1,250 to $1,4991,223 $1,500 to $1,999130 $2,000 to $2,499246 $2,500 to $2,99922 $3,500 or more43 No cash rent
Percentage of workers working in this county: 59.8%Number of people working at home: 5,546 (23.4% of all workers )
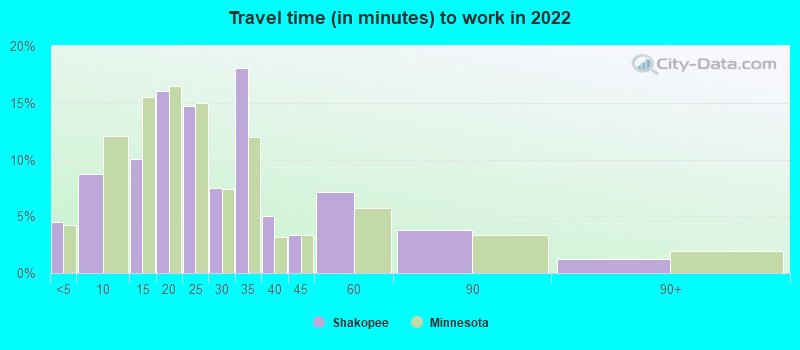
Travel time to work (commute)
Less than 5 minutes: 1,1325 to 9 minutes: 2,31810 to 14 minutes: 2,91215 to 19 minutes: 2,79420 to 24 minutes: 1,79425 to 29 minutes: 1,15930 to 34 minutes: 3,82335 to 39 minutes: 71240 to 44 minutes: 51845 to 59 minutes: 1,00360 to 89 minutes: 56890 or more minutes: 96
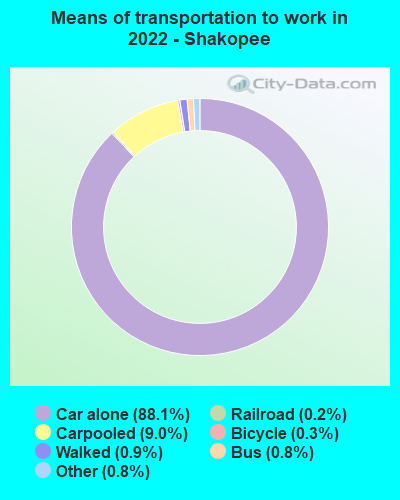
Means of transportation to work:
Drove a car alone: 22,088 (73.7%)Carpooled: 2,318 (7.7%)Bus : 126 (0.4%)Light rail, streetcar or trolley : 47 (0.2%)Taxi: 251 (0.8%)Bicycle: 63 (0.2%)Walked: 231 (0.8%)Worked at home: 4,901 (16.4%)
Unemployment by race in 2022
Unemployment rate for White non-Hispanic residents 2.8% Males0.5% FemalesUnemployment rate for Black residents 12.6% Males18.6% FemalesUnemployment rate for Asian residents 2.0% Males1.5% FemalesUnemployment rate for other race residents 0.9% FemalesUnemployment rate for two or more race residents 8.9% FemalesUnemployment rate for Hispanic or Latino residents 3.5% Males6.5% Females
Year of entry for the foreign-born population in Shakopee, Minnesota
2,993 2010 or later 1,944 2000 to 2009 2,061 1990 to 1999 333 1980 to 1989 53 1970 to 1979 93 Before 1970
First ancestries reported:
German: 4,654 (21.8%)
Somali: 1,459 (6.8%)
Scandinavian: 1,233 (5.8%)
Norwegian: 808 (3.8%)
Irish: 707 (3.3%)
American: 569 (2.7%)
Ethiopian: 550 (2.6%)
Italian: 531 (2.5%)
European: 503 (2.4%)
English: 443 (2.1%)
Russian: 418 (2.0%)
Polish: 412 (1.9%)
Swedish: 333 (1.6%)
Finnish: 189 (0.9%)
Guyanese: 187 (0.9%)
Ukrainian: 179 (0.8%)
Czech: 119 (0.6%)
African: 109 (0.5%)
Dutch: 91 (0.4%)
Eastern European: 86 (0.4%)
Trinidadian and Tobagonian: 58 (0.3%)
Scottish: 55 (0.3%)
Ghanaian: 48 (0.2%)
Danish: 47 (0.2%)
French Canadian: 43 (0.2%)
Northern European: 35 (0.2%)
Portuguese: 34 (0.2%)
Scotch-Irish: 27 (0.1%)
Czechoslovakian: 25 (0.1%)
Israeli: 23 (0.1%)
French: 23 (0.1%)
Latvian: 20 (0.09%)
Slovak: 20 (0.09%)
German Russian: 18 (0.08%)
Pennsylvania German: 12 (0.06%)
Kenyan: 12 (0.06%)
Hungarian: 11 (0.05%)
Belgian: 10 (0.05%)
Romanian: 8 (0.04%)
Canadian: 5 (0.02%)
Armenian: 4 (0.02%)
Swiss: 4 (0.02%) Most common places of birth for foreign-born residents (%): Vietnam Shakopee:
16.9% (1,399)Minnesota:
3.8% (18,442)
Mexico Shakopee:
14.1% (1,167)Minnesota:
12.1% (58,312)
Somalia Shakopee:
12.0% (992)Minnesota:
8.0% (38,461)
India Shakopee:
8.1% (669)Minnesota:
6.7% (32,141)
Cambodia Shakopee:
7.5% (619)Minnesota:
0.9% (4,264)
Ethiopia Shakopee:
7.1% (587)Minnesota:
5.1% (24,630)
Guatemala Shakopee:
4.8% (394)Minnesota:
1.4% (6,706)
Russia Shakopee:
4.7% (392)Minnesota:
1.3% (6,329)
Ukraine Shakopee:
4.5% (370)Minnesota:
1.0% (4,646)
Asia, n.e.c. Shakopee:
2.9% (241)Minnesota:
0.1% (476)
Poland Shakopee:
2.5% (206)Minnesota:
0.4% (1,875)
China, excluding Hong Kong and Taiwan Shakopee:
1.8% (146)Minnesota:
3.6% (17,119)
Place of birth for U.S.-born residents:
This state: 28,984Other state: 7,333Northeast: 378Midwest: 4,344South: 1,362West: 1,250 88.9% of Shakopee residents lived in the same house 1 years ago.
Out of people who lived in different houses, 18.4% lived in this county.
Out of people who lived in different counties, 86.2% lived in Minnesota.
Shakopee:
88.9%State average:
87.4%
Education attainment for males 25 years and older:
No schooling: 122Nursery to 4th grade: 235th and 6th grade: 227th and 8th grade: 489th grade: 1410th grade: 10811th grade: 7712th grade, no diploma: 556High school graduate (or equivalency): 4,014Less than 1 year of college: 693Some college more than 1 year, no degree: 1,612Associate degree: 1,800Bachelor's degree: 3,617Master's degree: 987Professional school degree: 145Doctorate degree: 285
Education attainment for females 25 years and older:
No schooling: 690Nursery to 4th grade: 795th and 6th grade: 2037th and 8th grade: 599th grade: 5610th grade: 8311th grade: 22012th grade, no diploma: 324High school graduate (or equivalency): 3,074Less than 1 year of college: 1,267Some college more than 1 year, no degree: 1,281Associate degree: 1,799Bachelor's degree: 3,961Master's degree: 1,451Professional school degree: 494Doctorate degree: 228
Housing units in structures:
One, detached: 10,016One, attached: 3,667Two: 1483 or 4: 2165 to 9: 40710 to 19: 29920 to 49: 39150 or more: 1,501Mobile homes: 20Boats, RVs, vans, etc.: 12Housing units lacking complete plumbing facilities in 2022: 0.4%Housing units lacking complete kitchen facilities in 2022: 0.3%House/condo owner moved in on average 8 years ago
Renter moved in on average 3 years ago
Private vs. public school enrollment:
Students in private schools in grades 1 to 8 (elementary and middle school): 676 Here:
12.6%Minnesota:
12.9%
Students in private schools in grades 9 to 12 (high school): 29 Students in private undergraduate colleges: 200 Here:
12.9%Minnesota:
26.2%