Villas, NJ (New Jersey) Houses and Residents
| Villas: | $309,343 |
| New Jersey: | $428,900 |
Mean price in 2022:
Detached houses: $296,029
Here: $296,029 State: $537,591
Total population: 9,483 (Urban population: 9,064, Rural population: 0)
Houses: 6,274 (4,396 occupied: 4,205 owner occupied, 733 renter occupied)
| % of renters here: | 15% |
| State: | 35% |
Housing density: 1,579 houses/condos per square mile
Median price asked for vacant for-sale houses and condos in 2022: $462,414.
Median contract rent in 2022: $1,269 (lower quartile is $1,054, upper quartile is $1,674)
Median rent asked for vacant for-rent units in 2022: $1,147
Median gross rent in Villas, NJ in 2022: $1,449
Housing units in Villas with a mortgage: 2,514 (159 second mortgage, 34 home equity loan, 103 both second mortgage and home equity loan)
Houses without a mortgage: 124
Median household income for houses/condos with a mortgage: $76,456
Median household income for apartments without a mortgage: $81,861
Median monthly housing costs: $1,285
Compare current foreclosures in Villas, NJ:
| Photo | Address | Area | Beds / Baths | Price | Details |
|---|---|---|---|---|---|

|
#1
E Saint Johns Ave
Villas, NJ 08251
|
916 sq. feet
|
- baths - beds |
show details | |

|
#2
Hazelwood Ave
Villas, NJ 08251
|
1,008 sq. feet
|
- baths - beds |
show details | |

|
#3
Sandlewood Rd
Villas, NJ 08251
|
936 sq. feet
|
- baths - beds |
show details | |

|
#4
Woodland Ave
Villas, NJ 08251
|
668 sq. feet
|
- baths - beds |
show details | |

|
#5
E Virginia Ave
Villas, NJ 08251
|
- sq. feet
|
- baths - beds |
show details | |

|
#6
Bucknell Ave
Villas, NJ 08251
|
640 sq. feet
|
- baths - beds |
show details | |

|
#7
Iowa Ave
Villas, NJ 08251
|
- sq. feet
|
- baths - beds |
show details | |

|
#8
Cedardale Ave
Villas, NJ 08251
|
- sq. feet
|
- baths - beds |
show details | |

|
#9
W Bates Ave
Villas, NJ 08251
|
1,440 sq. feet
|
- baths - beds |
show details | |

|
#10
N 9th St
Villas, NJ 08251
|
580 sq. feet
|
- baths - beds |
show details |
| Photo | Address | Area | Beds / Baths | Price | Details |
|---|---|---|---|---|---|

|
#11
Rose Ln
Villas, NJ 08251
|
- sq. feet
|
- baths - beds |
show details | |

|
#12
Star Ave
Villas, NJ 08251
|
1,125 sq. feet
|
- baths - beds |
show details | |

|
#13
Rose Ln
Villas, NJ 08251
|
986 sq. feet
|
- baths - beds |
show details | |

|
#14
E Delaware Pkwy
Villas, NJ 08251
|
539 sq. feet
|
- baths - beds |
show details | |

|
#15
N 14th St
Villas, NJ 08251
|
880 sq. feet
|
- baths - beds |
show details | |

|
#16
E Miami Ave
Villas, NJ 08251
|
468 sq. feet
|
- baths - beds |
show details | |

|
#17
Village Rd
Villas, NJ 08251
|
- sq. feet
|
- baths - beds |
show details | |

|
#18
S 6th St
Villas, NJ 08251
|
- sq. feet
|
- baths - beds |
show details | |

|
#19
E Bates Ave
Villas, NJ 08251
|
859 sq. feet
|
- baths - beds |
show details | |

|
#20
Matthews Ave
Villas, NJ 08251
|
1,148 sq. feet
|
- baths - beds |
show details |
| Photo | Address | Area | Beds / Baths | Price | Details |
|---|---|---|---|---|---|

|
#21
Star Ave
Villas, NJ 08251
|
1,020 sq. feet
|
- baths - beds |
show details | |

|
#22
Millman Blvd
Villas, NJ 08251
|
1,212 sq. feet
|
- baths - beds |
show details | |

|
#23
Village Rd
Villas, NJ 08251
|
660 sq. feet
|
- baths - beds |
show details | |

|
#24
Baywyn Rd
Villas, NJ 08251
|
976 sq. feet
|
- baths - beds |
show details | |

|
#25
Ellery Rd
Villas, NJ 08251
|
- sq. feet
|
- baths - beds |
show details | |

|
#26
E Hudson Ave
Villas, NJ 08251
|
- sq. feet
|
- baths - beds |
show details | |

|
#27
Lafayette Ave
Villas, NJ 08251
|
- sq. feet
|
- baths - beds |
show details | |

|
#28
N 14th St
Villas, NJ 08251
|
- sq. feet
|
- baths - beds |
show details | |

|
#29
Langs Ave
Villas, NJ 08251
|
- sq. feet
|
- baths - beds |
show details | |

|
#30
E Atlantic Ave
Villas, NJ 08251
|
- sq. feet
|
- baths - beds |
show details |
| Photo | Address | Area | Beds / Baths | Price | Details |
|---|---|---|---|---|---|

|
#31
Langs Ave
Villas, NJ 08251
|
- sq. feet
|
- baths - beds |
show details | |

|
#32
Millman Blvd
Villas, NJ 08251
|
- sq. feet
|
- baths - beds |
show details | |

|
#33
S 15th St
Villas, NJ 08251
|
- sq. feet
|
- baths - beds |
show details | |

|
#34
Bay Dr
Villas, NJ 08251
|
- sq. feet
|
- baths - beds |
show details | |

|
#35
E Saint Johns Ave
Villas, NJ 08251
|
- sq. feet
|
- baths - beds |
show details | |

|
#36
W New York Ave
Villas, NJ 08251
|
- sq. feet
|
- baths - beds |
show details | |

|
#37
E Florida Ave
Villas, NJ 08251
|
- sq. feet
|
- baths - beds |
show details | |

|
#38
W Atlantic Ave
Villas, NJ 08251
|
- sq. feet
|
- baths - beds |
show details | |

|
Check over 1 million property listings on Foreclosure.com!
|
browse all offers | |||

Latest news about housing in Villas, NJ collected exclusively by city-data.com from local newspapers, TV, and radio stations

 | Apt/Condo/Townhome in Cherry Hill Area (0 replies) |
| Villas, North Cape May (Lower Township) real estate (1 reply) |
| Villas on Delaware Bay -- What's up with the real estate market? (20 replies) |
| Brigantine beach house rental - safe area? (7 replies) |
| Where do poor white people in new jersey live? (268 replies) |
| Alpine, NJ vs Greenwich, CT (21 replies) |

Median year apartment built: 1973
Household type by relationship:
Households: 9,938- Male householders: 1,994 (408 living alone), Female householders: 2,413 (648 living alone)
2,006 spouses (2,006 opposite-sex spouses), 541 unmarried partners, (541 opposite-sex unmarried partners), 2,331 children (2,114 natural, 78 adopted, 138 stepchildren), 321 grandchildren, 16 brothers or sisters, 81 parents, 0 foster children, 167 other relatives, 46 non-relatives
- In group quarters: 19
Size of family households: 1,624 2-persons, 1,160 3-persons, 405 4-persons, 80 5-persons, 78 6-persons, 89 7-or-more-persons.
Size of nonfamily households: 1,262 1-person, 268 2-persons.
1,005 married couples with children.
894 single-parent households (311 men, 583 women).
95.5% of residents of Villas speak English at home.
2.8% of residents speak Spanish at home (63% speak English very well, 15% speak English well, 22% speak English not well).
1.4% of residents speak other Indo-European language at home (73% speak English very well, 27% speak English well).
Foreign born population: 342 (3.4%)
(37.4% of them are naturalized citizens)
| Here: | 5.7 |
| State: | 6.8 |
| Here: | 4.6 |
| State: | 3.9 |

- Bedrooms in owner-occupied houses and condos in Villas, New Jersey
- 39no bedroom
- 431 bedroom
- 1,3062 bedrooms
- 2,1263 bedrooms
- 5954 bedrooms
- 975+ bedrooms

- Bedrooms in renter-occupied apartments in Villas, New Jersey
- 0no bedroom
- 501 bedroom
- 2932 bedrooms
- 3493 bedrooms
- 424 bedrooms
- 05+ bedrooms

- Cars and other vehicles available in Villas in owner-occupied houses/condos
- 80no vehicle
- 1,7891 vehicle
- 1,8362 vehicles
- 4043 vehicles
- 984 vehicles
- 05+ vehicles

- Cars and other vehicles available in Villas in renter-occupied apartments
- 79no vehicle
- 2851 vehicle
- 3302 vehicles
- 403 vehicles
- 04 vehicles
- 05+ vehicles

- Rooms in owner-occupied houses in Villas, New Jersey
- 01 room
- 392 rooms
- 1873 rooms
- 4964 rooms
- 1,2645 rooms
- 9386 rooms
- 6467 rooms
- 2088 rooms
- 4289+ rooms

- Rooms in renter-occupied apartments in Villas, New Jersey
- 01 room
- 02 rooms
- 1133 rooms
- 1034 rooms
- 2335 rooms
- 1326 rooms
- 1517 rooms
- 08 rooms
- 09+ rooms


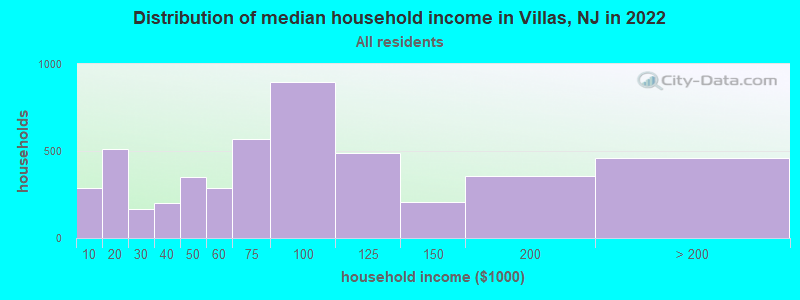
Villas, NJ household income distribution

- 286Less than $10,000
- 511$10,000 to $19,999
- 164$20,000 to $29,999
- 203$30,000 to $39,999
- 352$40,000 to $49,999
- 290$50,000 to $59,999
- 571$60,000 to $74,999
- 896$75,000 to $99,999
- 487$100,000 to $124,999
- 209$125,000 to $149,999
- 357$150,000 to $199,999
- 458$200,000 or more
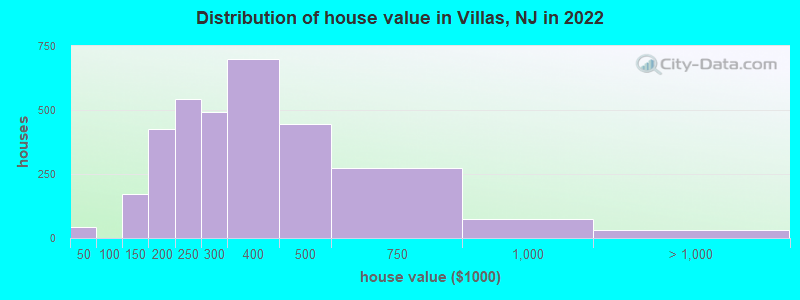
Home value of owner - occupied houses in 2022 in Villas, NJ
-
- 18$10,000 to $14,999
- 4$15,000 to $19,999
- 20$25,000 to $29,999
- 36$100,000 to $124,999
- 135$125,000 to $149,999
- 148$150,000 to $174,999
- 276$175,000 to $199,999
- 542$200,000 to $249,999
- 492$250,000 to $299,999
- 698$300,000 to $399,999
- 446$400,000 to $499,999
- 274$500,000 to $749,999
- 74$750,000 to $999,999
- 29$1,000,000 to $1,499,999
Rent paid by renters in 2022 in Villas, NJ
-
- 55$450 to $499
- 16$550 to $599
- 29$900 to $999
- 224$1,000 to $1,249
- 92$1,250 to $1,499
- 72$1,500 to $1,999
- 37$2,000 to $2,499
- 97No cash rent


Percentage of workers working in this county: 86.3%
Number of people working at home: 146 (3.3% of all workers)
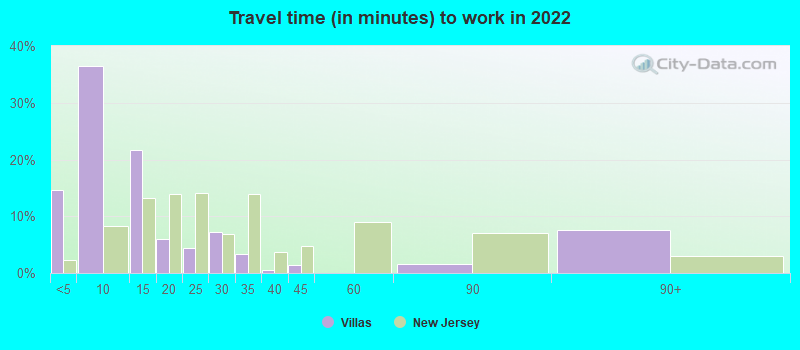
Travel time to work (commute)
- Less than 5 minutes: 143
- 5 to 9 minutes: 874
- 10 to 14 minutes: 893
- 15 to 19 minutes: 616
- 20 to 24 minutes: 664
- 25 to 29 minutes: 130
- 30 to 34 minutes: 417
- 35 to 39 minutes: 55
- 40 to 44 minutes: 120
- 45 to 59 minutes: 57
- 60 to 89 minutes: 49
- 90 or more minutes: 69
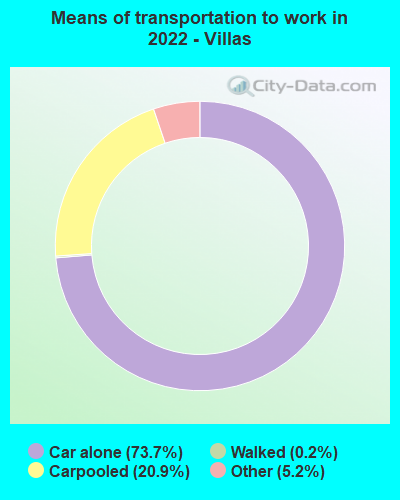
Means of transportation to work:
- Drove a car alone: 671 (61.6%)
- Carpooled: 219 (20.1%)
- Taxi: 54 (5.0%)
- Walked: 2 (0.2%)
- Worked at home: 146 (13.4%)

- Unemployment by race in 2022
- Unemployment rate for White non-Hispanic residents
- 0.3%Males
- 11.5%Females

- Year of entry for the foreign-born population in Villas, New Jersey
- 1502010 or later
- 552000 to 2009
- 461990 to 1999
- 231980 to 1989
- 201970 to 1979
- 137Before 1970

First ancestries reported:
- Irish: 1,039 (32.8%)
- Italian: 402 (12.7%)
- English: 233 (7.4%)
- American: 175 (5.5%)
- German: 138 (4.4%)
- Polish: 98 (3.1%)
- French: 93 (2.9%)
- European: 84 (2.7%)
- Swedish: 63 (2.0%)
- French Canadian: 62 (2.0%)
- Scottish: 40 (1.3%)
- Hungarian: 32 (1.0%)
- Welsh: 21 (0.7%)
- Bulgarian: 18 (0.6%)
- African: 14 (0.4%)
- Scotch-Irish: 8 (0.3%)
- Pennsylvania German: 4 (0.1%)
- Eastern European: 3 (0.09%)
Most common places of birth for foreign-born residents (%):
| Villas: | 56.4% (177) |
| New Jersey: | 2.2% (46,813) |
| Villas: | 18.5% (58) |
| New Jersey: | 1.5% (33,198) |
| Villas: | 8.9% (28) |
| New Jersey: | 0.2% (4,579) |
| Villas: | 4.8% (15) |
| New Jersey: | 0.2% (3,249) |
| Villas: | 3.5% (11) |
| New Jersey: | 0.4% (8,146) |
| Villas: | 1.9% (6) |
| New Jersey: | 4.8% (102,527) |
Place of birth for U.S.-born residents:
- This state: 4,820
- Other state: 4,573
- Northeast: 3,821
- Midwest: 115
- South: 472
- West: 88
88.2% of Villas residents lived in the same house 1 years ago.
Out of people who lived in different houses, 34.6% lived in this county.
Out of people who lived in different counties, 68.1% lived in New Jersey.
| Villas: | 88.2% |
| State average: | 90.4% |
Education attainment for males 25 years and older:
- No schooling: 55
- Nursery to 4th grade: 52
- 5th and 6th grade: 8
- 7th and 8th grade: 12
- 9th grade: 33
- 10th grade: 69
- 11th grade: 2
- 12th grade, no diploma: 115
- High school graduate (or equivalency): 1,543
- Less than 1 year of college: 307
- Some college more than 1 year, no degree: 249
- Associate degree: 116
- Bachelor's degree: 614
- Master's degree: 233
- Professional school degree: 15
- Doctorate degree: 0

Education attainment for females 25 years and older:
- No schooling: 111
- Nursery to 4th grade: 0
- 5th and 6th grade: 0
- 7th and 8th grade: 11
- 9th grade: 23
- 10th grade: 69
- 11th grade: 9
- 12th grade, no diploma: 0
- High school graduate (or equivalency): 1,455
- Less than 1 year of college: 482
- Some college more than 1 year, no degree: 275
- Associate degree: 503
- Bachelor's degree: 816
- Master's degree: 161
- Professional school degree: 14
- Doctorate degree: 32


Housing units in structures:
- One, detached: 6,076
- One, attached: 87
- Two: 9
- 3 or 4: 7
- 5 to 9: 34
- 10 to 19: 56
Housing units lacking complete kitchen facilities in 2022: 1.8%
House/condo owner moved in on average 9 years ago
Renter moved in on average 6 years ago

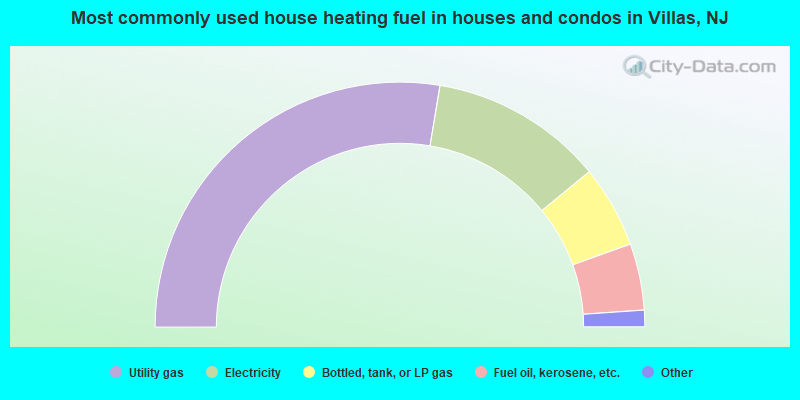
- 55.3%Utility gas
- 22.9%Electricity
- 10.9%Bottled, tank, or LP gas
- 8.8%Fuel oil, kerosene, etc.
- 1.5%Other fuel
- 0.6%Solar energy

- 52.4%Electricity
- 26.1%Utility gas
- 10.7%Bottled, tank, or LP gas
- 7.2%Fuel oil, kerosene, etc.
- 3.5%Other fuel
Private vs. public school enrollment:
| Here: | 6.4% |
| New Jersey: | 12.3% |
| Here: | 10.1% |
| New Jersey: | 13.1% |
| Here: | 16.0% |
| New Jersey: | 33.2% |


