Winchester, VA (Virginia) Houses and Residents
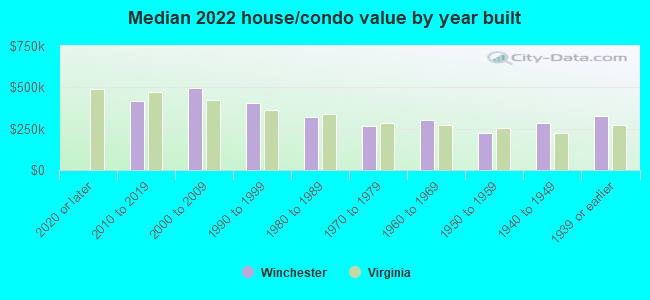
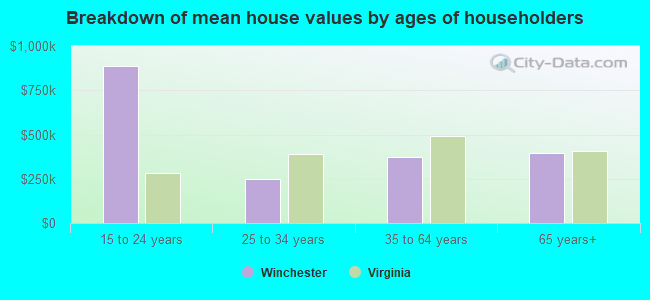
| Winchester: | $329,566 |
| Virginia: | $365,700 |
Total population: 27,543 (Urban population: 23,585, Rural population: 0)
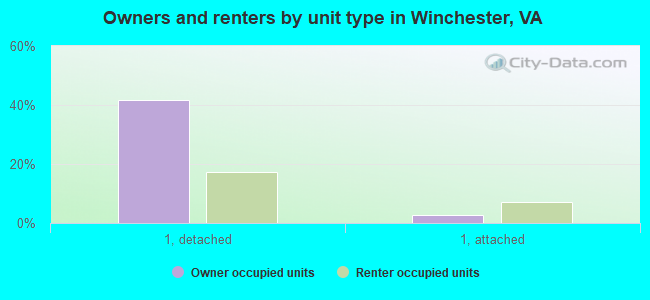
Houses: 12,805 (11,627 occupied: 5,283 owner occupied, 6,740 renter occupied)
| % of renters here: | 56% |
| State: | 33% |
Housing density: 1,372 houses/condos per square mile
Median price asked for vacant for-sale houses and condos in 2022: $539,804.
Median contract rent in 2022: $1,192 (lower quartile is $1,135, upper quartile is $1,361)
Median rent asked for vacant for-rent units in 2022: $1,343
Median gross rent in Winchester, VA in 2022: $1,354
Housing units in Winchester with a mortgage: 3,629 (298 second mortgage, 0 home equity loan, 286 both second mortgage and home equity loan)
Houses without a mortgage: 48
Median household income for houses/condos with a mortgage: $108,484
Median household income for apartments without a mortgage: $66,531
Median monthly housing costs: $1,254
Compare current foreclosures in Winchester, VA:
| Photo | Address | Area | Beds / Baths | Price | Details |
|---|---|---|---|---|---|

|
#1
Bethel Grange Rd
Winchester, VA 22603
|
1,576 sq. feet
|
1 baths 3 beds |
$405,000
|
show details |

|
#2
Dogwood Rd
Winchester, VA 22602
|
1,186 sq. feet
|
1 baths 4 beds |
show details | |

|
#3
Blue Ridge Ln
Winchester, VA 22602
|
1,040 sq. feet
|
1 baths 3 beds |
show details | |

|
#4
Mcdonald Rd
Winchester, VA 22602
|
1,215 sq. feet
|
1 baths 3 beds |
show details | |

|
#5
Fox Run Ln
Winchester, VA 22602
|
984 sq. feet
|
2 baths 3 beds |
show details | |

|
#6
Bluebird Trl
Winchester, VA 22602
|
856 sq. feet
|
1 baths 2 beds |
show details | |

|
#7
Riflemen Ln
Winchester, VA 22601
|
2,040 sq. feet
|
3 baths 4 beds |
show details | |

|
#8
Bentley Ave
Winchester, VA 22602
|
1,795 sq. feet
|
2 baths 3 beds |
show details | |

|
#9
Ross St
Winchester, VA 22601
|
960 sq. feet
|
1 baths 2 beds |
show details | |

|
#10
Winns Cir
Winchester, VA 22602
|
2,590 sq. feet
|
2 baths 4 beds |
show details |
| Photo | Address | Area | Beds / Baths | Price | Details |
|---|---|---|---|---|---|

|
#11
Morningside Dr
Winchester, VA 22601
|
1,456 sq. feet
|
1 baths 4 beds |
show details | |

|
#12
Quail Dr
Winchester, VA 22602
|
1,560 sq. feet
|
3 baths 3 beds |
show details | |

|
#13
Woodrow Rd
Winchester, VA 22602
|
2,064 sq. feet
|
3 baths 3 beds |
show details | |

|
#14
Smithfield Ave
Winchester, VA 22601
|
1,676 sq. feet
|
2 baths 3 beds |
show details | |

|
#15
Primrose Pl
Winchester, VA 22602
|
1,730 sq. feet
|
2 baths 3 beds |
show details | |

|
#16
W Cork St
Winchester, VA 22601
|
1,122 sq. feet
|
1 baths 3 beds |
show details | |

|
#17
Tudor Dr
Winchester, VA 22603
|
1,200 sq. feet
|
1 baths 3 beds |
show details | |

|
#18
Shawnee Dr
Winchester, VA 22601
|
1,065 sq. feet
|
1 baths 3 beds |
show details | |

|
#19
Babbs Mountain Rd
Winchester, VA 22603
|
2,128 sq. feet
|
1 baths 4 beds |
show details | |

|
#20
Babbs Mountain Rd
Winchester, VA 22603
|
2,856 sq. feet
|
3 baths 4 beds |
show details |
| Photo | Address | Area | Beds / Baths | Price | Details |
|---|---|---|---|---|---|

|
#21
Stony Hill Rd
Winchester, VA 22603
|
1,288 sq. feet
|
2 baths 3 beds |
show details | |

|
#22
Mill Race Dr
Winchester, VA 22602
|
2,528 sq. feet
|
2 baths 4 beds |
show details | |

|
#23
Gray Ave
Winchester, VA 22601
|
1,862 sq. feet
|
1 baths 3 beds |
show details | |

|
#24
Fishel Rd
Winchester, VA 22602
|
1,112 sq. feet
|
1 baths 2 beds |
show details | |

|
#25
Kern St
Winchester, VA 22601
|
1,916 sq. feet
|
2 baths 3 beds |
show details | |

|
#26
Fishel Rd
Winchester, VA 22602
|
2,081 sq. feet
|
2 baths 2 beds |
show details | |

|
#27
Jackson Ave
Winchester, VA 22601
|
1,511 sq. feet
|
1 baths 3 beds |
show details | |

|
#28
Soldiers Rest Ln
Winchester, VA 22602
|
3,837 sq. feet
|
3 baths 4 beds |
show details | |

|
#29
Masters Ln
Winchester, VA 22601
|
1,258 sq. feet
|
1 baths 2 beds |
show details | |

|
#30
Forest Ridge Rd
Winchester, VA 22602
|
2,190 sq. feet
|
3 baths 6 beds |
show details |
| Photo | Address | Area | Beds / Baths | Price | Details |
|---|---|---|---|---|---|

|
#31
Oak Side Ln
Winchester, VA 22603
|
1,554 sq. feet
|
2 baths 3 beds |
show details | |

|
#32
Hunting Ridge Rd
Winchester, VA 22603
|
2,732 sq. feet
|
3 baths 4 beds |
show details | |

|
#33
Rossum Ln
Winchester, VA 22602
|
796 sq. feet
|
1 baths 2 beds |
show details | |

|
#34
Germany Rd
Winchester, VA 22602
|
1,966 sq. feet
|
3 baths 3 beds |
show details | |

|
#35
Northwestern Pike
Winchester, VA 22603
|
1,846 sq. feet
|
1 baths 3 beds |
show details | |

|
#36
Bryarly Rd
Winchester, VA 22603
|
1,113 sq. feet
|
1 baths 2 beds |
show details | |

|
#37
Hammack Ln
Winchester, VA 22602
|
3,268 sq. feet
|
2 baths 4 beds |
show details | |

|
#38
Battle Ave
Winchester, VA 22601
|
954 sq. feet
|
1 baths 3 beds |
show details | |

|
#39
Glenridge Dr
Winchester, VA 22602
|
2,240 sq. feet
|
3 baths 3 beds |
show details | |

|
#40
Woodys Pl
Winchester, VA 22602
|
2,184 sq. feet
|
2 baths 3 beds |
show details |
| Photo | Address | Area | Beds / Baths | Price | Details |
|---|---|---|---|---|---|

|
#41
Baker St
Winchester, VA 22601
|
1,224 sq. feet
|
1 baths 4 beds |
show details | |

|
#42
Amherst St
Winchester, VA 22601
|
1,571 sq. feet
|
1 baths 3 beds |
show details | |

|
#43
York Ave
Winchester, VA 22601
|
817 sq. feet
|
1 baths 2 beds |
show details | |

|
#44
Country Club Cir
Winchester, VA 22602
|
3,016 sq. feet
|
3 baths 4 beds |
show details | |

|
#45
Banbury Ter
Winchester, VA 22601
|
1,200 sq. feet
|
1 baths 3 beds |
show details | |

|
#46
Hickory Ln
Winchester, VA 22603
|
1,269 sq. feet
|
1 baths 3 beds |
show details | |

|
#47
Foxglove Dr
Winchester, VA 22602
|
1,860 sq. feet
|
2 baths 3 beds |
show details | |

|
#48
Valley Pike
Winchester, VA 22602
|
- sq. feet
|
- baths - beds |
show details | |

|
#49
Hart Trl
Winchester, VA 22602
|
- sq. feet
|
- baths - beds |
show details | |

|
Check over 1 million property listings on Foreclosure.com!
|
browse all offers | |||

Latest news about housing in Winchester, VA collected exclusively by city-data.com from local newspapers, TV, and radio stations

 | Housing advice for teacher moving to Winchester? (3 replies) |
| Apartments Purcellville to Winchester (3 replies) |
| Retiring to Winchester, Va (21 replies) |
| Job relocation to Winchester. Seeking Winchester VA or Purcellville information. Thanks so much (13 replies) |
| New Housing Developments in Winchester/Stephenson, VA (55 replies) |
| Looking for Apartments in Winchester, VA (7 replies) |

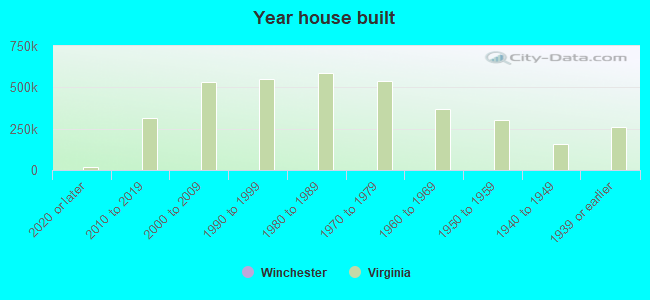
Median year apartment built: 1967
Household type by relationship:
Households: 29,032- Male householders: 5,616 (1,862 living alone), Female householders: 5,971 (2,286 living alone)
4,134 spouses (4,109 opposite-sex spouses), 1,182 unmarried partners, (1,173 opposite-sex unmarried partners), 7,381 children (6,947 natural, 112 adopted, 321 stepchildren), 858 grandchildren, 391 brothers or sisters, 367 parents, 0 foster children, 491 other relatives, 1,485 non-relatives
- In group quarters: 1,150
Size of family households: 2,804 2-persons, 2,013 3-persons, 1,374 4-persons, 396 5-persons, 107 6-persons, 240 7-or-more-persons.
Size of nonfamily households: 3,547 1-person, 734 2-persons, 486 3-persons, 7 4-persons, 15 6-persons.
2,873 married couples with children.
2,503 single-parent households (1,340 men, 1,163 women).
80.0% of residents of Winchester speak English at home.
15.3% of residents speak Spanish at home (54% speak English very well, 19% speak English well, 20% speak English not well, 7% don't speak English at all).
3.3% of residents speak other Indo-European language at home (49% speak English very well, 41% speak English well, 9% speak English not well, 1% don't speak English at all).
0.5% of residents speak Asian or Pacific Island language at home (53% speak English very well, 47% speak English well).
0.6% of residents speak other language at home (33% speak English very well, 67% speak English well).
Foreign born population: 3,278 (11.3%)
(41.5% of them are naturalized citizens)
| Here: | 6.8 |
| State: | 7.0 |
| Here: | 4.6 |
| State: | 4.3 |

- Bedrooms in owner-occupied houses and condos in Winchester, Virginia
- 0no bedroom
- 171 bedroom
- 6832 bedrooms
- 2,5333 bedrooms
- 1,4744 bedrooms
- 5775+ bedrooms
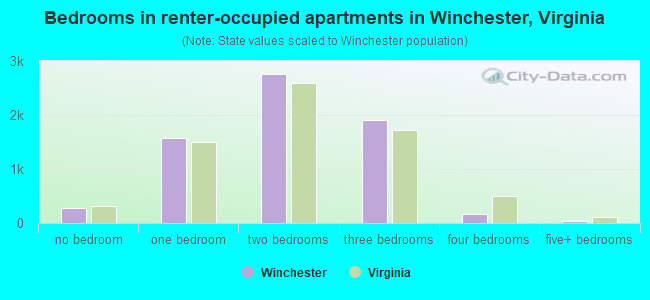
- Bedrooms in renter-occupied apartments in Winchester, Virginia
- 282no bedroom
- 1,5781 bedroom
- 2,7622 bedrooms
- 1,9133 bedrooms
- 1684 bedrooms
- 365+ bedrooms
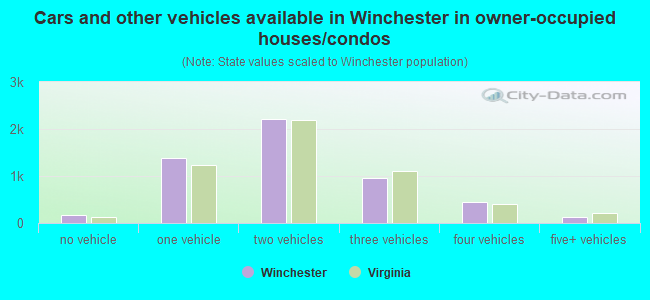
- Cars and other vehicles available in Winchester in owner-occupied houses/condos
- 173no vehicle
- 1,3771 vehicle
- 2,2042 vehicles
- 9583 vehicles
- 4444 vehicles
- 1285+ vehicles
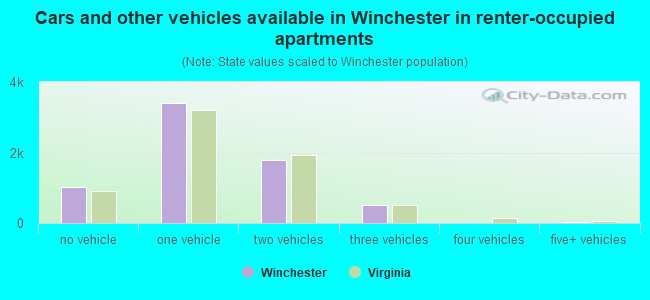
- Cars and other vehicles available in Winchester in renter-occupied apartments
- 1,025no vehicle
- 3,4011 vehicle
- 1,7832 vehicles
- 5053 vehicles
- 84 vehicles
- 195+ vehicles

- Rooms in owner-occupied houses in Winchester, Virginia
- 01 room
- 02 rooms
- 543 rooms
- 2264 rooms
- 1,1025 rooms
- 7246 rooms
- 7637 rooms
- 7138 rooms
- 1,7029+ rooms
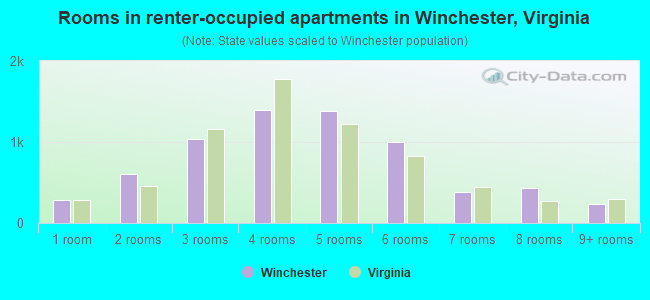
- Rooms in renter-occupied apartments in Winchester, Virginia
- 2821 room
- 6102 rooms
- 1,0393 rooms
- 1,3904 rooms
- 1,3775 rooms
- 1,0016 rooms
- 3787 rooms
- 4328 rooms
- 2309+ rooms

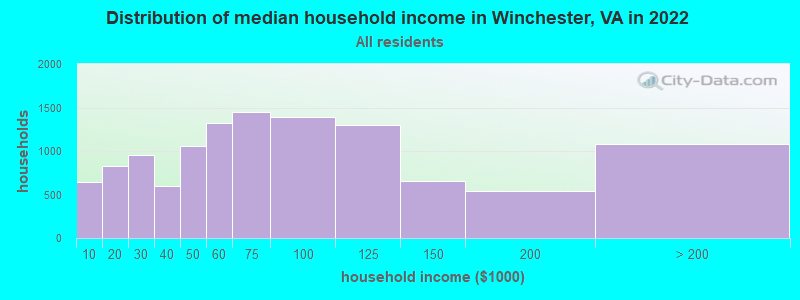
Winchester, VA household income distribution

- 644Less than $10,000
- 828$10,000 to $19,999
- 950$20,000 to $29,999
- 595$30,000 to $39,999
- 1,052$40,000 to $49,999
- 1,327$50,000 to $59,999
- 1,446$60,000 to $74,999
- 1,394$75,000 to $99,999
- 1,302$100,000 to $124,999
- 654$125,000 to $149,999
- 545$150,000 to $199,999
- 1,086$200,000 or more
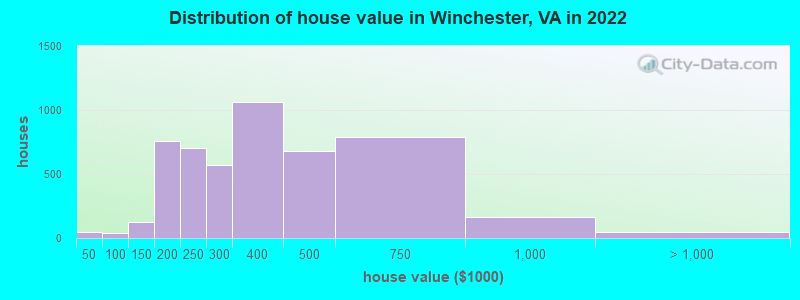
Home value of owner - occupied houses in 2022 in Winchester, VA
-
- 11$10,000 to $14,999
- 38$20,000 to $24,999
- 30$50,000 to $59,999
- 11$80,000 to $89,999
- 94$100,000 to $124,999
- 30$125,000 to $149,999
- 410$150,000 to $174,999
- 348$175,000 to $199,999
- 701$200,000 to $249,999
- 569$250,000 to $299,999
- 1,059$300,000 to $399,999
- 678$400,000 to $499,999
- 786$500,000 to $749,999
- 166$750,000 to $999,999
- 46$1,000,000 to $1,499,999
Rent paid by renters in 2022 in Winchester, VA
-
- 61$100 to $149
- 40$150 to $199
- 64$200 to $249
- 28$250 to $299
- 10$300 to $349
- 28$350 to $399
- 41$400 to $449
- 37$450 to $499
- 64$550 to $599
- 267$600 to $649
- 107$650 to $699
- 139$700 to $749
- 433$750 to $799
- 710$800 to $899
- 860$900 to $999
- 1,437$1,000 to $1,249
- 821$1,250 to $1,499
- 714$1,500 to $1,999
- 9$2,000 to $2,499
- 398No cash rent

Percentage of workers working in this county: 49.9%
Number of people working at home: 2,200 (15.2% of all workers)
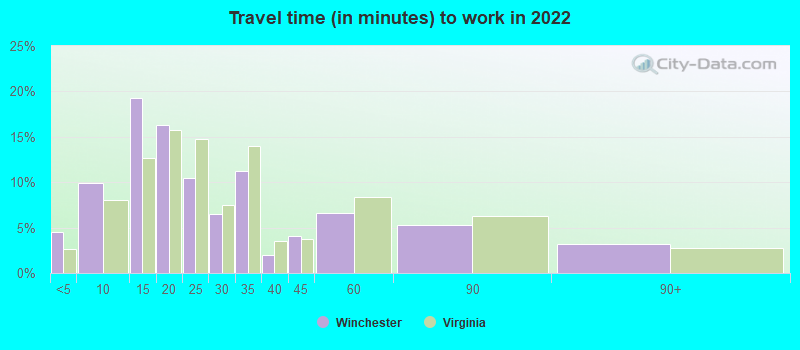
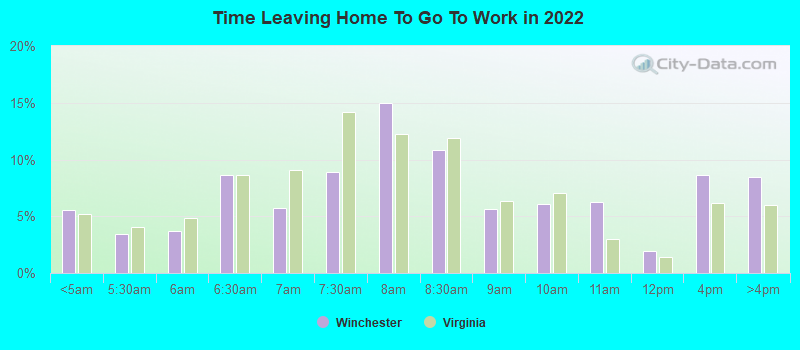
Travel time to work (commute)
- Less than 5 minutes: 1,373
- 5 to 9 minutes: 2,802
- 10 to 14 minutes: 3,289
- 15 to 19 minutes: 2,138
- 20 to 24 minutes: 1,187
- 25 to 29 minutes: 582
- 30 to 34 minutes: 812
- 35 to 39 minutes: 61
- 40 to 44 minutes: 497
- 45 to 59 minutes: 679
- 60 to 89 minutes: 704
- 90 or more minutes: 362
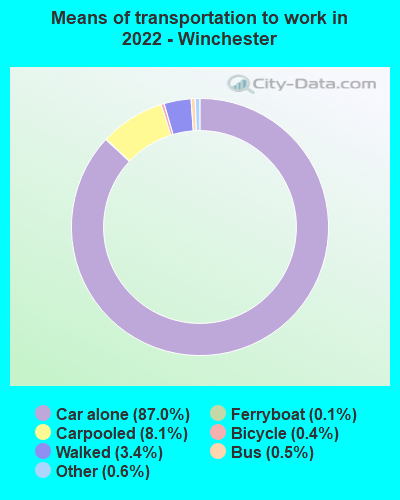
Means of transportation to work:
- Drove a car alone: 20,050 (77.4%)
- Carpooled: 1,890 (7.3%)
- Bus: 75 (0.3%)
- Ferryboat: 34 (0.1%)
- Taxi: 163 (0.6%)
- Bicycle: 90 (0.3%)
- Walked: 837 (3.2%)
- Worked at home: 2,200 (8.5%)
- Unemployment by race in 2022
- Unemployment rate for White non-Hispanic residents
- 1.8%Males
- 3.1%Females
- Unemployment rate for Black residents
- 4.2%Males
- Unemployment rate for Asian residents
- 30.4%Males
- Unemployment rate for other race residents
- 10.8%Females
- Unemployment rate for two or more race residents
- 42.3%Males
- 2.1%Females
- Unemployment rate for Hispanic or Latino residents
- 5.2%Females
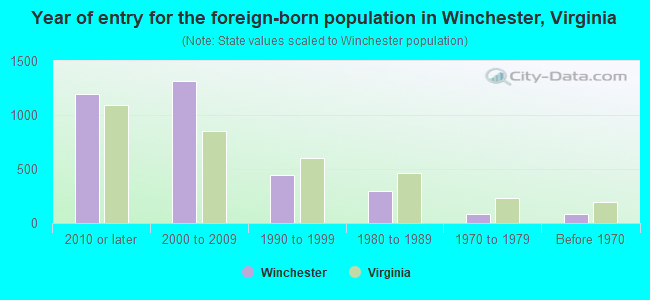
- Year of entry for the foreign-born population in Winchester, Virginia
- 1,1942010 or later
- 1,3172000 to 2009
- 4481990 to 1999
- 3001980 to 1989
- 811970 to 1979
- 84Before 1970
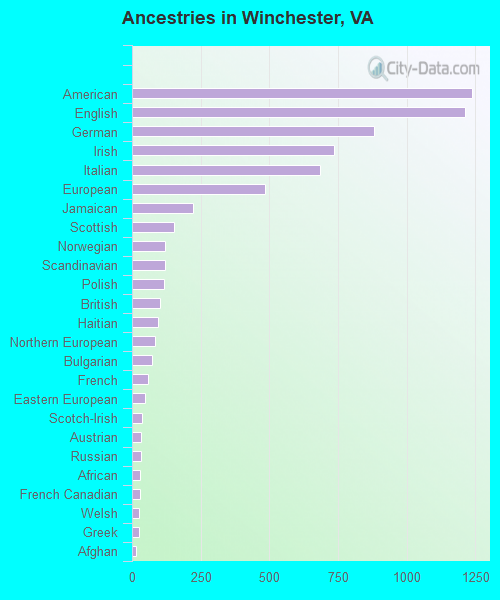
First ancestries reported:
- American: 1,238 (11.0%)
- English: 1,211 (10.7%)
- German: 880 (7.8%)
- Irish: 737 (6.5%)
- Italian: 685 (6.1%)
- European: 485 (4.3%)
- Jamaican: 222 (2.0%)
- Scottish: 153 (1.4%)
- Norwegian: 120 (1.1%)
- Scandinavian: 119 (1.1%)
- Polish: 115 (1.0%)
- British: 101 (0.9%)
- Haitian: 93 (0.8%)
- Northern European: 82 (0.7%)
- Bulgarian: 73 (0.6%)
- French: 60 (0.5%)
- Eastern European: 49 (0.4%)
- Scotch-Irish: 37 (0.3%)
- Austrian: 34 (0.3%)
- Russian: 34 (0.3%)
- African: 29 (0.3%)
- French Canadian: 28 (0.2%)
- Welsh: 27 (0.2%)
- Greek: 25 (0.2%)
- Afghan: 16 (0.1%)
- Israeli: 15 (0.1%)
- Lithuanian: 14 (0.1%)
- Slovak: 14 (0.1%)
- Dutch: 12 (0.1%)
- Finnish: 12 (0.1%)
- Hungarian: 9 (0.08%)
- Turkish: 9 (0.08%)
- Egyptian: 7 (0.06%)
- Swedish: 6 (0.05%)
- Ukrainian: 5 (0.04%)
- Portuguese: 4 (0.04%)
Most common places of birth for foreign-born residents (%):
| Winchester: | 36.1% (1,252) |
| Virginia: | 9.9% (107,534) |
| Winchester: | 14.8% (515) |
| Virginia: | 5.3% (57,498) |
| Winchester: | 7.0% (243) |
| Virginia: | 1.0% (10,734) |
| Winchester: | 4.1% (141) |
| Virginia: | 0.4% (4,246) |
| Winchester: | 3.4% (117) |
| Virginia: | 0.8% (8,186) |
| Winchester: | 3.0% (104) |
| Virginia: | 3.3% (35,938) |
| Winchester: | 2.9% (101) |
| Virginia: | 1.8% (19,426) |
| Winchester: | 2.8% (98) |
| Virginia: | 2.4% (26,366) |
| Winchester: | 2.7% (92) |
| Virginia: | 0.9% (9,440) |
| Winchester: | 2.5% (85) |
| Virginia: | 4.8% (52,629) |
| Winchester: | 2.0% (71) |
| Virginia: | 0.5% (5,147) |
| Winchester: | 2.0% (68) |
| Virginia: | 3.0% (32,892) |
| Winchester: | 1.9% (66) |
| Virginia: | 9.0% (97,830) |
Place of birth for U.S.-born residents:
- This state: 14,650
- Other state: 10,449
- Northeast: 3,444
- Midwest: 1,736
- South: 4,142
- West: 1,191
85.3% of Winchester residents lived in the same house 1 years ago.
Out of people who lived in different houses, 16.7% lived in this county.
Out of people who lived in different counties, 71.3% lived in Virginia.
| Winchester: | 85.3% |
| State average: | 86.6% |
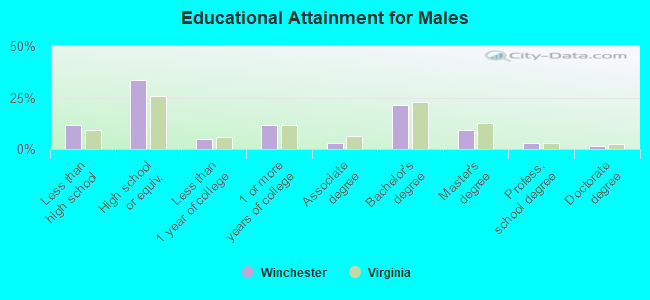
Education attainment for males 25 years and older:
- No schooling: 73
- Nursery to 4th grade: 101
- 5th and 6th grade: 91
- 7th and 8th grade: 65
- 9th grade: 222
- 10th grade: 218
- 11th grade: 102
- 12th grade, no diploma: 253
- High school graduate (or equivalency): 3,268
- Less than 1 year of college: 483
- Some college more than 1 year, no degree: 1,114
- Associate degree: 284
- Bachelor's degree: 2,056
- Master's degree: 910
- Professional school degree: 304
- Doctorate degree: 146
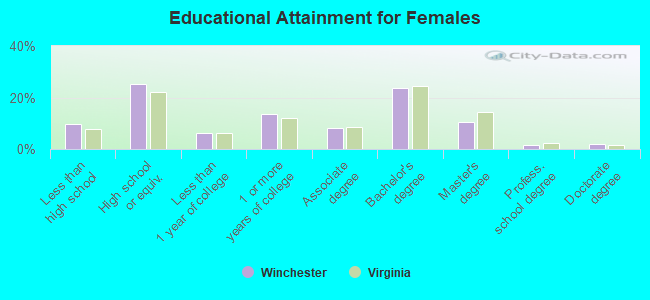
Education attainment for females 25 years and older:
- No schooling: 138
- Nursery to 4th grade: 91
- 5th and 6th grade: 96
- 7th and 8th grade: 150
- 9th grade: 112
- 10th grade: 161
- 11th grade: 56
- 12th grade, no diploma: 180
- High school graduate (or equivalency): 2,556
- Less than 1 year of college: 622
- Some college more than 1 year, no degree: 1,369
- Associate degree: 823
- Bachelor's degree: 2,403
- Master's degree: 1,049
- Professional school degree: 174
- Doctorate degree: 186


Housing units in structures:
- One, detached: 7,472
- One, attached: 1,188
- Two: 212
- 3 or 4: 1,072
- 5 to 9: 1,070
- 10 to 19: 1,210
- 20 to 49: 163
- 50 or more: 412
Housing units lacking complete kitchen facilities in 2022: 1.6%
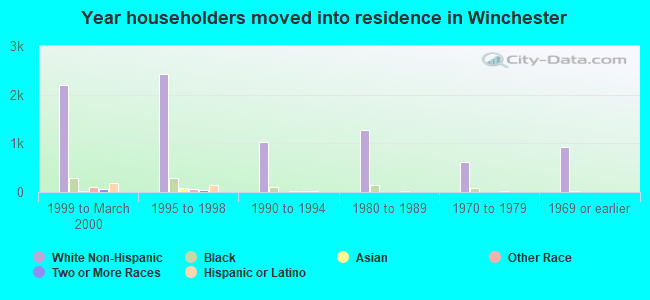
House/condo owner moved in on average 14 years ago
Renter moved in on average 2 years ago
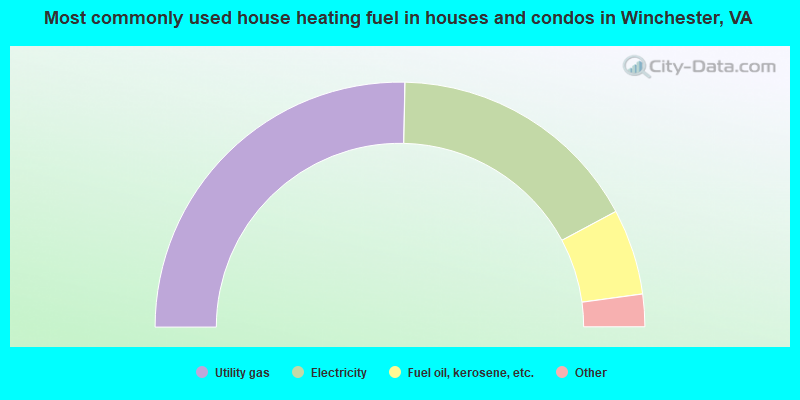
- 50.6%Utility gas
- 33.7%Electricity
- 11.3%Fuel oil, kerosene, etc.
- 1.7%Bottled, tank, or LP gas
- 1.7%Other fuel
- 0.9%Wood
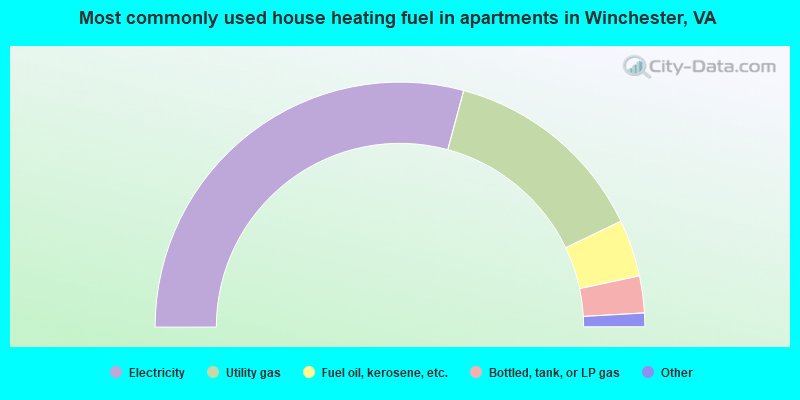
- 58.4%Electricity
- 27.4%Utility gas
- 7.5%Fuel oil, kerosene, etc.
- 4.9%Bottled, tank, or LP gas
- 0.7%No fuel used
- 0.6%Other fuel
- 0.6%Wood
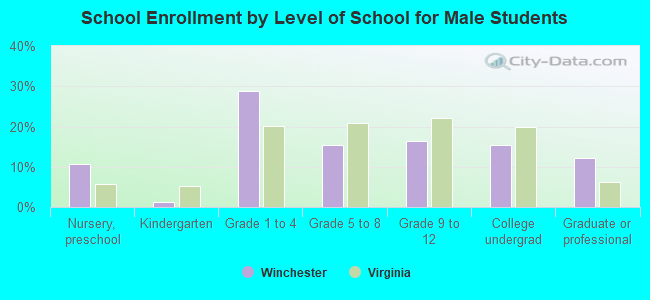
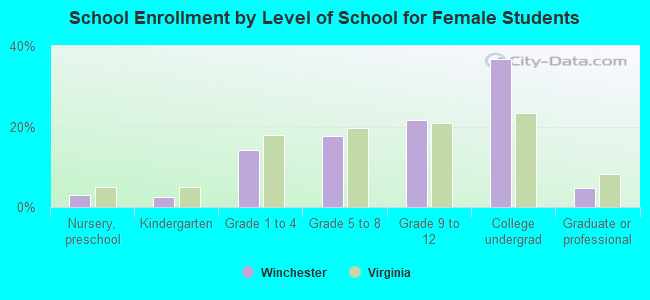
Private vs. public school enrollment:
| Here: | 12.0% |
| Virginia: | 13.2% |
| Here: | 1.3% |
| Virginia: | 10.2% |
| Here: | 52.8% |
| Virginia: | 18.7% |