Winona, MN (Minnesota) Houses and Residents
Estimated median house or condo value in 2022: $193,718 (it was $89,800 in 2000 )
Winona:
$193,718Minnesota:
$314,600
Lower value quartile - upper value quartile: $138,370 - $256,674Mean price in 2022: Detached houses: $256,772 Here:
$256,772State:
$374,552
Townhouses or other attached units: $282,984 Here:
$282,984State:
$312,049
In 2-unit structures: $215,180 Here:
$215,180State:
$323,045
In 3-to-4-unit structures: $325,533 Here:
$325,533State:
$238,971
In 5-or-more-unit structures: $115,220 Here:
$115,220State:
$258,516
Mobile homes: $126,608 Here:
$126,608State:
$94,605
Total population: 27,384 (Urban population: 25,321 (all inside urban clusters), Rural population: 1,668 (19 farm, 1,649 nonfarm ))
Houses: 11,800 (11,137 occupied: 6,482 owner occupied, 4,738 renter occupied )
% of renters here:
42%State:
28%
Housing density: 647 houses/condos per square mile
Median price asked for vacant for-sale houses and condos in 2022: $75,163.
Median contract rent in 2022: $692 (lower quartile is $491, upper quartile is $923)
Median rent asked for vacant for-rent units in 2022: $583
Median gross rent in Winona, MN in 2022: $787
Housing units in Winona with a mortgage: 4,200 (524 second mortgage, 11 home equity loan, 465 both second mortgage and home equity loan )Houses without a mortgage: 134
Median household income for houses/condos with a mortgage: $87,572
Median household income for apartments without a mortgage: $60,516
Median monthly housing costs: $848
Data:
Median house or condo value ($)
Median house or condo value ($ change since 2000)
Median house or condo value ($) - White
Median house or condo value ($) - Black or African American
Median house or condo value ($) - Asian
Median house or condo value ($) - Hispanic or Latino
Median house or condo value ($) - American Indian and Alaska Native
Median house or condo value ($) - Multirace
Median house or condo value ($) - Other Race
Median price asked for mobile homes ($)
Household density (households per square mile)
Mean house or condo value by units in structure - 1, detached ($)
Mean house or condo value by units in structure - 1, attached ($)
Mean house or condo value by units in structure - 2 ($)
Mean house or condo value by units in structure by units in structure - 3 or 4 ($)
Mean house or condo value by units in structure - 5 or more ($)
Mean house or condo value by units in structure - Boat, RV, van, etc. ($)
Mean house or condo value by units in structure - Mobile home ($)
Median contract rent ($)
Median contract rent - Lower quartile ($)
Median contract rent - Upper quartile ($)
Median gross rent ($)
Urban houses (%)
Rural houses (%)
Houses occupied (%)
Houses occupied (% change since 2000)
Houses owner occupied (%)
Houses owner occupied (% change since 2000)
Houses renter occupied (%)
Houses renter occupied (% change since 2000)
Vacant housing units - For rent (%)
Vacant housing units - For rent (% change since 2000)
Vacant housing units - For sale only (%)
Vacant housing units - For sale only (% change since 2000)
Vacant housing units - Rented or sold, not occupied (%)
Vacant housing units - Rented or sold, not occupied (% change since 2000)
Vacant housing units - For seasonal, recreational, or occasional use (%)
Vacant housing units - For seasonal, recreational, or occasional use (% change since 2000)
Vacant housing units - For migrant workers (%)
Vacant housing units - For migrant workers (% change since 2000)
Vacant housing units - Other vacant (%)
Vacant housing units - Other vacant (% change since 2000)
Median monthly housing costs ($)
Median household income for houses/condos with a mortgage ($)
Median household income for houses/condos without a mortgage ($)
Median household income ($)
Median household income ($) - White
Median household income ($) - Black or African American
Median household income ($) - Asian
Median household income ($) - Hispanic or Latino
Median household income ($) - American Indian and Alaska Native
Median household income ($) - Multirace
Median household income ($) - Other Race
Mortgage status - with mortgage (%)
Mortgage status - with second mortgage (%)
Mortgage status - with home equity loan (%)
Mortgage status - with both second mortgage and home equity loan (%)
Mortgage status - without a mortgage (%)
Median year house/condo built
Median year apartment built
Household type by relationship - Male householder living alone (%)
Household type by relationship - Male householder not living alone (%)
Household type by relationship - Female householder living alone (%)
Household type by relationship - Female householder not living alone (%)
Household type by relationship - Opposite-Sex spouse (%)
Household type by relationship - Same-Sex spouse (%)
Household type by relationship - Opposite-Sex unmarried partner (%)
Household type by relationship - Same-Sex unmarried partner (%)
Household type by relationship - In group quarters (%)
Size of family households - 2-person household (%)
Size of family households - 3-person household (%)
Size of family households - 4-person household (%)
Size of family households - 5-person household (%)
Size of family households - 6-person household (%)
Size of family households - 7-or-more-person household (%)
Size of nonfamily households - 1-person household (%)
Size of nonfamily households - 2-person household (%)
Size of nonfamily households - 3-person household (%)
Size of nonfamily households - 4-person household (%)
Size of nonfamily households - 5-person household (%)
Size of nonfamily households - 6-person household (%)
Size of nonfamily households - 7-or-moreperson household (%)
Year house built - Built 2010 or later (%)
Year house built - Built 2000 to 2009 (%)
Year house built - Built 1990 to 1999 (%)
Year house built - Built 1980 to 1989 (%)
Year house built - Built 1970 to 1979 (%)
Year house built - Built 1960 to 1969 (%)
Year house built - Built 1950 to 1959 (%)
Year house built - Built 1940 to 1949 (%)
Year house built - Built 1939 or earlier (%)
Median number of rooms in houses and condos
Median number of rooms in apartments
Median number of bedrooms in owner occupied houses
Mean number of bedrooms in owner occupied houses
Median number of bedrooms in renter occupied houses
Mean number of bedrooms in renter occupied houses
Median number of vehichles in owner occupied houses
Mean number of vehichles in owner occupied houses
Median number of vehichles in renter occupied houses
Mean number of vehichles in renter occupied houses
Rooms in owner-occupied houses - 1 room (%)
Rooms in owner-occupied houses - 2 rooms (%)
Rooms in owner-occupied houses - 3 rooms (%)
Rooms in owner-occupied houses - 4 rooms (%)
Rooms in owner-occupied houses - 5 rooms (%)
Rooms in owner-occupied houses - 6 rooms (%)
Rooms in owner-occupied houses - 7 rooms (%)
Rooms in owner-occupied houses - 8 rooms (%)
Rooms in owner-occupied houses - 9+ rooms (%)
Rooms in renter-occupied houses - 1 room (%)
Rooms in renter-occupied houses - 2 rooms (%)
Rooms in renter-occupied houses - 3 rooms (%)
Rooms in renter-occupied houses - 4 rooms (%)
Rooms in renter-occupied houses - 5 rooms (%)
Rooms in renter-occupied houses - 6 rooms (%)
Rooms in renter-occupied houses - 7 rooms (%)
Rooms in renter-occupied houses - 8 rooms (%)
Rooms in renter-occupied houses - 9+ rooms (%)
Bedrooms in owner-occupied houses - no bedrooms (%)
Bedrooms in owner-occupied houses - 1 bedroom (%)
Bedrooms in owner-occupied houses - 2 bedrooms (%)
Bedrooms in owner-occupied houses - 3 bedrooms (%)
Bedrooms in owner-occupied houses - 4 bedrooms (%)
Bedrooms in owner-occupied houses - 5+ bedrooms (%)
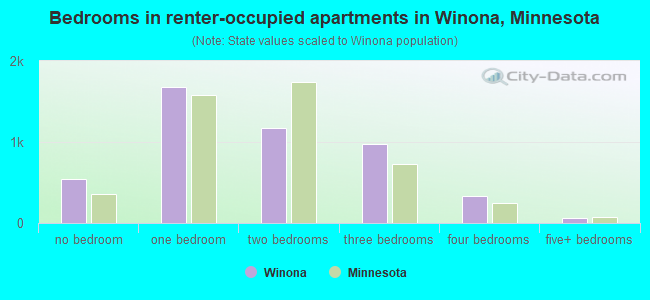
Bedrooms in renter-occupied houses - no bedrooms (%)
Bedrooms in renter-occupied houses - 1 bedroom (%)
Bedrooms in renter-occupied houses - 2 bedrooms (%)
Bedrooms in renter-occupied houses - 3 bedrooms (%)
Bedrooms in renter-occupied houses - 4 bedrooms (%)
Bedrooms in renter-occupied houses - 5+ bedrooms (%)
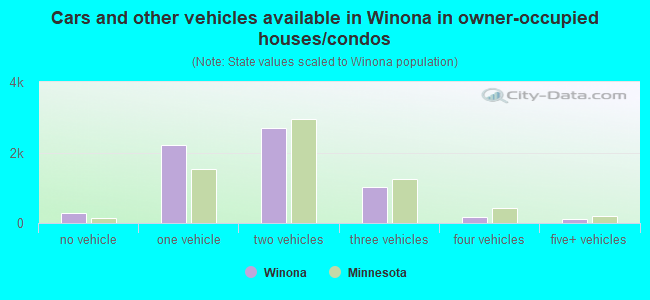
Vehicles available in owner-occupied houses - no vehicle available (%)
Vehicles available in owner-occupied houses - 1 vehicle available(%)
Vehicles available in owner-occupied houses - 2 Vehicles available (%)
Vehicles available in owner-occupied houses - 3 Vehicles available (%)
Vehicles available in owner-occupied houses - 4 Vehicles available (%)
Vehicles available in owner-occupied houses - 5+ Vehicles available (%)
Vehicles available in renter-occupied houses - no vehicle available (%)
Vehicles available in renter-occupied houses - 1 vehicle available (%)
Vehicles available in renter-occupied houses - 2 Vehicles available (%)
Vehicles available in renter-occupied houses - 3 Vehicles available (%)
Vehicles available in renter-occupied houses - 4 Vehicles available (%)
Vehicles available in renter-occupied houses - 5+ Vehicles available (%)
Housing units in structures - 1, detached (%)
Housing units in structures - 1, attached (%)
Housing units in structures - 2 (%)
Housing units in structures - 3 or 4 (%)
Housing units in structures - 5 to 9 (%)
Housing units in structures - 10 to 19 (%)
Housing units in structures - 20 to 49 (%)
Housing units in structures - 50 or more (%)
Housing units in structures - Mobile home (%)
Housing units in structures - Boat, RV, van, etc. (%)
Housing units in structures - Owners - 1, detached (%)
Housing units in structures - Owners - 1, attached (%)
Housing units in structures - Owners - 2 (%)
Housing units in structures - Owners - 3 or 4 (%)
Housing units in structures - Owners - 5 to 9 (%)
Housing units in structures - Owners - 10 to 19 (%)
Housing units in structures - Owners - 20 to 49 (%)
Housing units in structures - Owners - 50 or more (%)
Housing units in structures - Owners - Mobile home (%)
Housing units in structures - Owners - Boat, RV, van, etc. (%)
Housing units in structures - Renters - 1, detached (%)
Housing units in structures - Renters - 1, attached (%)
Housing units in structures - Renters - 2 (%)
Housing units in structures - Renters - 3 or 4 (%)
Housing units in structures - Renters - 5 to 9 (%)
Housing units in structures - Renters - 10 to 19 (%)
Housing units in structures - Renters - 20 to 49 (%)
Housing units in structures - Renters - 50 or more (%)
Housing units in structures - Renters - Mobile home (%)
Housing units in structures - Renters - Boat, RV, van, etc. (%)
House/condo owner moved in on average (years ago)
Renter moved in on average (years ago)
Year householder moved into unit - Moved in 1999 to March 2000 (%)
Year householder moved into unit - Moved in 1999 to March 2000 (%) - White
Year householder moved into unit - Moved in 1999 to March 2000 (%) - Black or African American
Year householder moved into unit - Moved in 1999 to March 2000 (%) - Asian
Year householder moved into unit - Moved in 1999 to March 2000 (%) - Hispanic or Latino
Year householder moved into unit - Moved in 1999 to March 2000 (%) - American Indian and Alaska Native
Year householder moved into unit - Moved in 1999 to March 2000 (%) - Multirace
Year householder moved into unit - Moved in 1999 to March 2000 (%) - Other Race
Year householder moved into unit - Moved in 1995 to 1998 (%)
Year householder moved into unit - Moved in 1995 to 1998 (%) - White
Year householder moved into unit - Moved in 1995 to 1998 (%) - Black or African American
Year householder moved into unit - Moved in 1995 to 1998 (%) - Asian
Year householder moved into unit - Moved in 1995 to 1998 (%) - Hispanic or Latino
Year householder moved into unit - Moved in 1995 to 1998 (%) - American Indian and Alaska Native
Year householder moved into unit - Moved in 1995 to 1998 (%) - Multirace
Year householder moved into unit - Moved in 1995 to 1998 (%) - Other Race
Year householder moved into unit - Moved in 1990 to 1994 (%)
Year householder moved into unit - Moved in 1990 to 1994 (%) - White
Year householder moved into unit - Moved in 1990 to 1994 (%) - Black or African American
Year householder moved into unit - Moved in 1990 to 1994 (%) - Asian
Year householder moved into unit - Moved in 1990 to 1994 (%) - Hispanic or Latino
Year householder moved into unit - Moved in 1990 to 1994 (%) - American Indian and Alaska Native
Year householder moved into unit - Moved in 1990 to 1994 (%) - Multirace
Year householder moved into unit - Moved in 1990 to 1994 (%) - Other Race
Year householder moved into unit - Moved in 1980 to 1989 (%)
Year householder moved into unit - Moved in 1980 to 1989 (%) - White
Year householder moved into unit - Moved in 1980 to 1989 (%) - Black or African American
Year householder moved into unit - Moved in 1980 to 1989 (%) - Asian
Year householder moved into unit - Moved in 1980 to 1989 (%) - Hispanic or Latino
Year householder moved into unit - Moved in 1980 to 1989 (%) - American Indian and Alaska Native
Year householder moved into unit - Moved in 1980 to 1989 (%) - Multirace
Year householder moved into unit - Moved in 1980 to 1989 (%) - Other Race
Year householder moved into unit - Moved in 1970 to 1979 (%)
Year householder moved into unit - Moved in 1970 to 1979 (%) - White
Year householder moved into unit - Moved in 1970 to 1979 (%) - Black or African American
Year householder moved into unit - Moved in 1970 to 1979 (%) - Asian
Year householder moved into unit - Moved in 1970 to 1979 (%) - Hispanic or Latino
Year householder moved into unit - Moved in 1970 to 1979 (%) - American Indian and Alaska Native
Year householder moved into unit - Moved in 1970 to 1979 (%) - Multirace
Year householder moved into unit - Moved in 1970 to 1979 (%) - Other Race
Year householder moved into unit - Moved in 1969 or earlier (%)
Year householder moved into unit - Moved in 1969 or earlier (%) - White
Year householder moved into unit - Moved in 1969 or earlier (%) - Black or African American
Year householder moved into unit - Moved in 1969 or earlier (%) - Asian
Year householder moved into unit - Moved in 1969 or earlier (%) - Hispanic or Latino
Year householder moved into unit - Moved in 1969 or earlier (%) - American Indian and Alaska Native
Year householder moved into unit - Moved in 1969 or earlier (%) - Multirace
Year householder moved into unit - Moved in 1969 or earlier (%) - Other Race
Housing units lacking complete plumbing facilities (%)
Housing units lacking complete kitchen facilities (%)
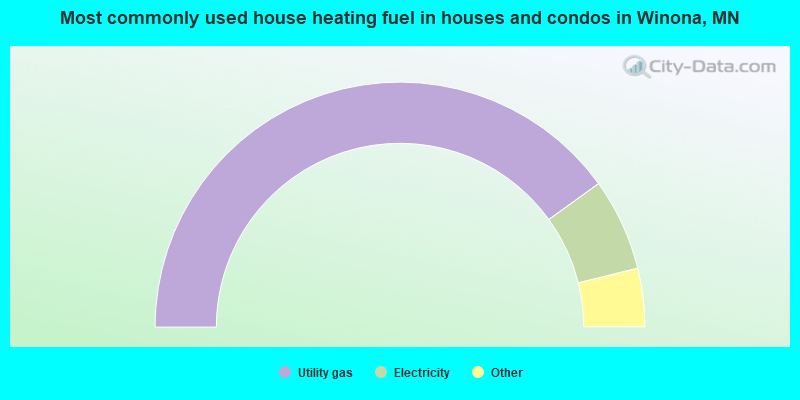
House heating fuel used in houses and condos - Utility gas (%)
House heating fuel used in houses and condos - Bottled, tank, or LP gas (%)
House heating fuel used in houses and condos - Electricity (%)
House heating fuel used in houses and condos - Fuel oil, kerosene, etc. (%)
House heating fuel used in houses and condos - Coal or coke (%)
House heating fuel used in houses and condos - Wood (%)
House heating fuel used in houses and condos - Solar energy (%)
House heating fuel used in houses and condos - Other fuel (%)
House heating fuel used in houses and condos - No fuel used (%)
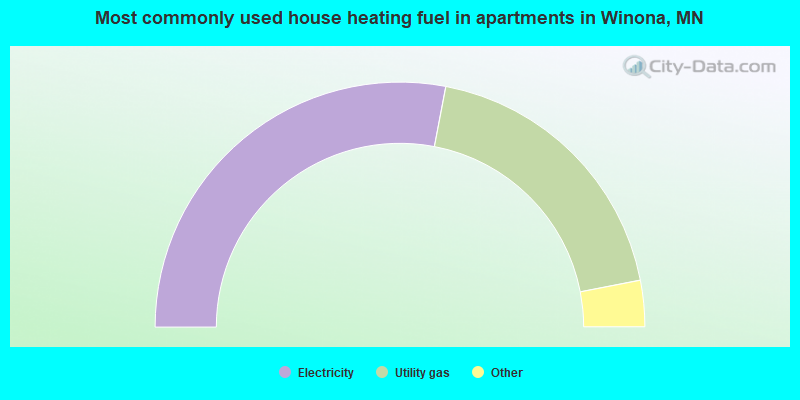
House heating fuel used in apartments - Utility gas (%)
House heating fuel used in apartments - Bottled, tank, or LP gas (%)
House heating fuel used in apartments - Electricity (%)
House heating fuel used in apartments - Fuel oil, kerosene, etc. (%)
House heating fuel used in apartments - Coal or coke (%)
House heating fuel used in apartments - Wood (%)
House heating fuel used in apartments - Solar energy (%)
House heating fuel used in apartments - Other fuel (%)
House heating fuel used in apartments - No fuel used (%)
Latest news about housing in Winona, MN collected exclusively by city-data.com from local newspapers, TV, and radio stations
Median year house/condo built: 1950Median year apartment built: 1967Household type by relationship:
Households: 26,183
Male householders: 5,412 (2,209 living alone ), Female householders: 5,531 (2,359 living alone )3,358 spouses (3,328 opposite-sex spouses ), 1,069 unmarried partners , (1,030 opposite-sex unmarried partners ), 4,395 children (4,131 natural , 50 adopted , 213 stepchildren ), 288 grandchildren , 131 brothers or sisters , 22 parents , 0 foster children , 84 other relatives , 2,652 non-relatives In group quarters: 3,237
Size of family households: 2,777 2-persons , 910 3-persons , 525 4-persons , 308 5-persons , 42 6-persons , 135 7-or-more-persons .
Size of nonfamily households: 4,753 1-person , 1,229 2-persons , 292 3-persons , 144 4-persons , 71 5-persons , 56 7-or-more-persons .
2,112 married couples with children. single-parent households (280 men , 576 women ).
94.6% of residents of Winona speak English at home. of residents speak Spanish at home (79% speak English very well , 8% speak English well , 13% speak English not well ).of residents speak other Indo-European language at home (50% speak English very well , 43% speak English well , 3% speak English not well , 4% don't speak English at all ).of residents speak Asian or Pacific Island language at home (87% speak English very well , 8% speak English well , 5% speak English not well ).of residents speak other language at home (79% speak English very well , 21% speak English well ).
Foreign born population: 904 (3.5%)of them are naturalized citizens )
Median number of rooms in houses and condos:
Median number of rooms in apartments
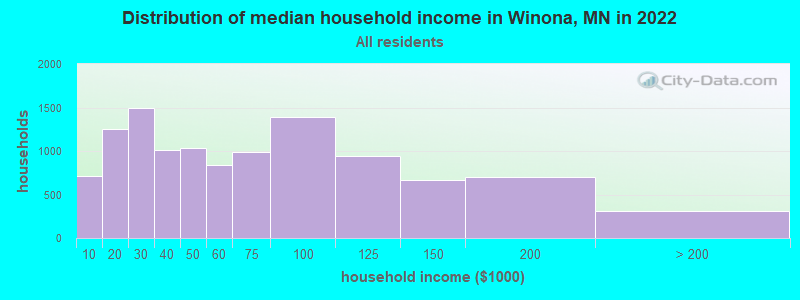
Winona, MN household income distribution 716 Less than $10,0001,256 $10,000 to $19,9991,493 $20,000 to $29,9991,006 $30,000 to $39,9991,033 $40,000 to $49,999836 $50,000 to $59,999993 $60,000 to $74,9991,386 $75,000 to $99,999944 $100,000 to $124,999664 $125,000 to $149,999705 $150,000 to $199,999308 $200,000 or more
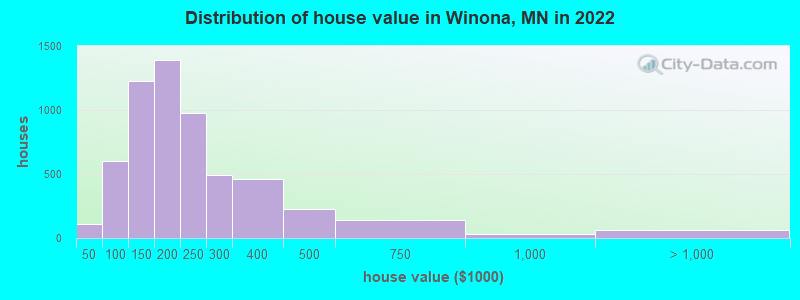
Home value of owner - occupied houses in 2022 in Winona, MN 33 Less than $10,00018 $10,000 to $14,99914 $15,000 to $19,99910 $25,000 to $29,99930 $40,000 to $49,99937 $50,000 to $59,99932 $60,000 to $69,999130 $70,000 to $79,999214 $80,000 to $89,999156 $90,000 to $99,999680 $100,000 to $124,999546 $125,000 to $149,999790 $150,000 to $174,999597 $175,000 to $199,999977 $200,000 to $249,999490 $250,000 to $299,999462 $300,000 to $399,999225 $400,000 to $499,999140 $500,000 to $749,99934 $750,000 to $999,99924 $1,000,000 to $1,499,9996 $1,500,000 to $1,999,99927 $2,000,000 or moreRent paid by renters in 2022 in Winona, MN 16 Less than $10056 $100 to $14966 $150 to $19919 $200 to $24974 $250 to $29938 $300 to $349115 $350 to $399497 $400 to $449302 $450 to $499331 $500 to $549188 $550 to $599414 $600 to $649275 $650 to $699301 $700 to $749290 $750 to $799472 $800 to $899308 $900 to $999502 $1,000 to $1,249279 $1,250 to $1,49959 $1,500 to $1,99928 $2,000 to $2,49937 $3,500 or more36 No cash rent
Percentage of workers working in this county: 90.6%Number of people working at home: 1,288 (8.9% of all workers )
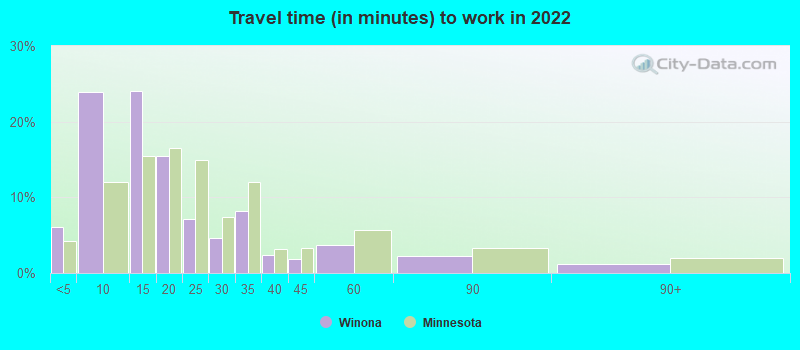
Travel time to work (commute)
Less than 5 minutes: 1,1025 to 9 minutes: 4,14710 to 14 minutes: 3,97215 to 19 minutes: 1,79220 to 24 minutes: 33225 to 29 minutes: 15430 to 34 minutes: 37935 to 39 minutes: 10740 to 44 minutes: 21145 to 59 minutes: 34160 to 89 minutes: 42090 or more minutes: 79
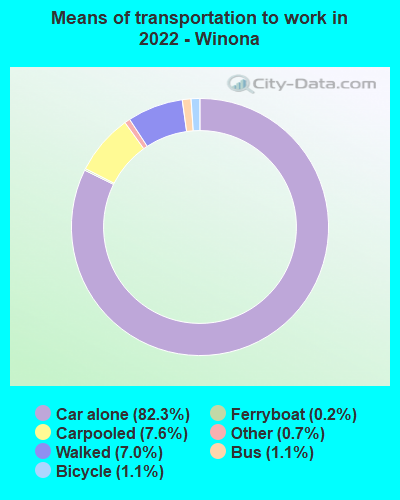
Means of transportation to work:
Drove a car alone: 15,363 (75.2%)Carpooled: 1,453 (7.1%)Bus : 138 (0.7%)Ferryboat: 31 (0.2%)Taxi: 171 (0.8%)Bicycle: 200 (1.0%)Walked: 1,326 (6.5%)Worked at home: 1,288 (6.3%)
Unemployment by race in 2022
Unemployment rate for White non-Hispanic residents 2.8% Males1.8% FemalesUnemployment rate for Asian residents 2.9% FemalesUnemployment rate for other race residents 5.0% MalesUnemployment rate for Hispanic or Latino residents 3.5% Males1.6% Females
Year of entry for the foreign-born population in Winona, Minnesota
663 2010 or later 136 2000 to 2009 23 1990 to 1999 150 1980 to 1989 42 1970 to 1979 175 Before 1970
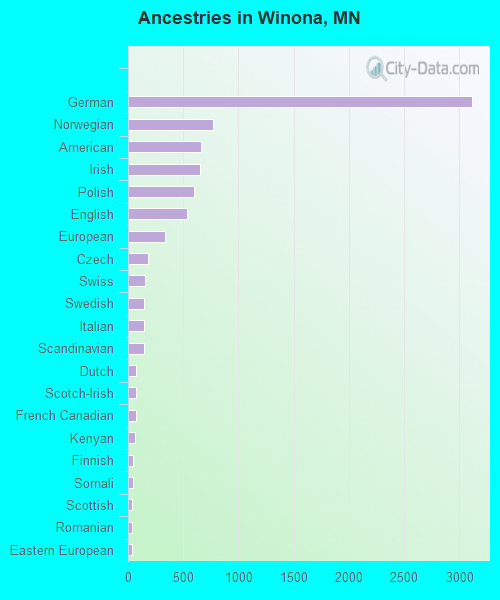
First ancestries reported:
German: 3,115 (33.4%)
Norwegian: 768 (8.2%)
American: 664 (7.1%)
Irish: 654 (7.0%)
Polish: 595 (6.4%)
English: 531 (5.7%)
European: 337 (3.6%)
Czech: 177 (1.9%)
Swiss: 158 (1.7%)
Swedish: 148 (1.6%)
Italian: 146 (1.6%)
Scandinavian: 143 (1.5%)
Dutch: 72 (0.8%)
Scotch-Irish: 72 (0.8%)
French Canadian: 69 (0.7%)
Kenyan: 60 (0.6%)
Finnish: 49 (0.5%)
Somali: 41 (0.4%)
Scottish: 39 (0.4%)
Romanian: 33 (0.4%)
Eastern European: 32 (0.3%)
Hungarian: 28 (0.3%)
Greek: 24 (0.3%)
Turkish: 23 (0.2%)
Egyptian: 22 (0.2%)
Liberian: 19 (0.2%)
African: 15 (0.2%)
Ukrainian: 15 (0.2%)
Lithuanian: 12 (0.1%)
Bulgarian: 11 (0.1%)
British West Indian: 11 (0.1%)
Russian: 9 (0.10%)
Cajun: 8 (0.09%)
Danish: 6 (0.06%)
Portuguese: 6 (0.06%)
British: 4 (0.04%) Most common places of birth for foreign-born residents (%): Malaysia Winona:
10.6% (96)Minnesota:
0.2% (914)
Kenya Winona:
9.5% (86)Minnesota:
3.3% (15,701)
Africa, n.e.c. Winona:
8.5% (77)Minnesota:
0.6% (3,113)
Mexico Winona:
7.6% (69)Minnesota:
12.1% (58,312)
Tanzania Winona:
6.4% (58)Minnesota:
0.2% (966)
Canada Winona:
4.9% (44)Minnesota:
2.5% (11,939)
China, excluding Hong Kong and Taiwan Winona:
4.6% (42)Minnesota:
3.6% (17,119)
Bangladesh Winona:
4.2% (38)Minnesota:
0.2% (1,174)
Ukraine Winona:
4.0% (36)Minnesota:
1.0% (4,646)
Somalia Winona:
3.8% (34)Minnesota:
8.0% (38,461)
Thailand Winona:
3.7% (33)Minnesota:
4.0% (19,333)
Other Caribbean Winona:
3.4% (31)Minnesota:
0.1% (320)
Venezuela Winona:
3.4% (31)Minnesota:
0.4% (2,003)
Cameroon Winona:
3.1% (28)Minnesota:
0.7% (3,598)
Spain Winona:
2.9% (26)Minnesota:
0.2% (998)
Egypt Winona:
2.9% (26)Minnesota:
0.6% (2,929)
Peru Winona:
2.9% (26)Minnesota:
0.4% (1,963)
Korea Winona:
2.7% (24)Minnesota:
2.4% (11,675)
Turkey Winona:
2.3% (21)Minnesota:
0.2% (981)
Romania Winona:
2.2% (20)Minnesota:
0.2% (967)
Nigeria Winona:
2.1% (19)Minnesota:
1.7% (8,263)
Ireland Winona:
2.0% (18)Minnesota:
0.2% (807)
Germany Winona:
1.9% (17)Minnesota:
1.4% (6,670)
Laos Winona:
1.9% (17)Minnesota:
5.1% (24,591)
Italy Winona:
1.7% (15)Minnesota:
0.2% (952)
Place of birth for U.S.-born residents:
This state: 16,520Other state: 8,543Northeast: 548Midwest: 6,377South: 827West: 754 77.2% of Winona residents lived in the same house 1 years ago.
Out of people who lived in different houses, 34.8% lived in this county.
Out of people who lived in different counties, 63.8% lived in Minnesota.
Winona:
77.2%State average:
87.4%
Education attainment for males 25 years and older:
No schooling: 153Nursery to 4th grade: 55th and 6th grade: 07th and 8th grade: 189th grade: 3910th grade: 5411th grade: 18212th grade, no diploma: 66High school graduate (or equivalency): 2,039Less than 1 year of college: 673Some college more than 1 year, no degree: 1,021Associate degree: 652Bachelor's degree: 1,632Master's degree: 531Professional school degree: 122Doctorate degree: 173
Education attainment for females 25 years and older:
No schooling: 18Nursery to 4th grade: 05th and 6th grade: 07th and 8th grade: 89th grade: 1910th grade: 7211th grade: 14912th grade, no diploma: 95High school graduate (or equivalency): 2,021Less than 1 year of college: 389Some college more than 1 year, no degree: 1,076Associate degree: 1,041Bachelor's degree: 1,577Master's degree: 1,005Professional school degree: 70Doctorate degree: 188
Housing units in structures:
One, detached: 6,761One, attached: 444Two: 9333 or 4: 9395 to 9: 47610 to 19: 80820 to 49: 95450 or more: 454Mobile homes: 28Housing units lacking complete plumbing facilities in 2022: 0.8%Housing units lacking complete kitchen facilities in 2022: 2.3%House/condo owner moved in on average 13 years ago
Renter moved in on average 0 years ago
Private vs. public school enrollment:
Students in private schools in grades 1 to 8 (elementary and middle school): 550 Here:
37.9%Minnesota:
12.9%
Students in private schools in grades 9 to 12 (high school): 186 Students in private undergraduate colleges: 900 Here:
15.0%Minnesota:
26.2%