Algonquin Park neighborhood in Livonia, Michigan (MI), 48150 detailed profile
Settings
X

Business Search - 14 Million verified businesses
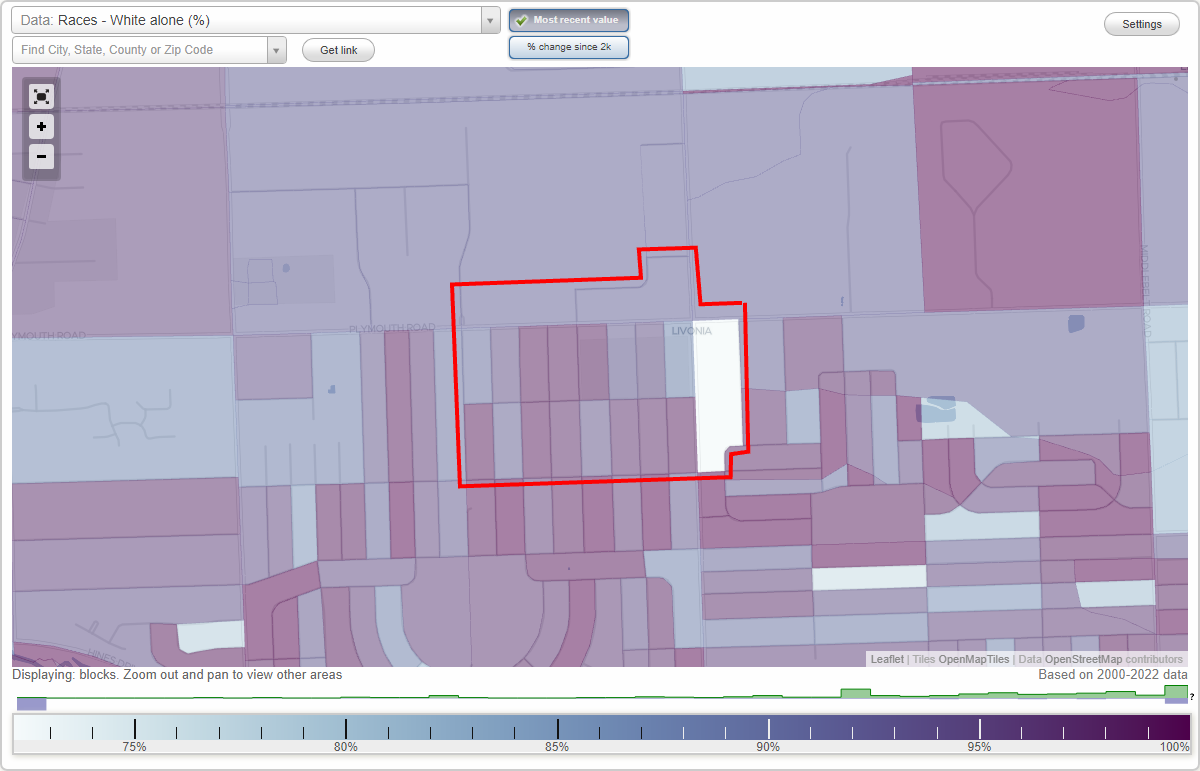
Area: 0.281 square miles
Population: 2,819
Population density:
| Algonquin Park: | 10,037 people per square mile |
| Livonia: | 2,626 people per square mile |

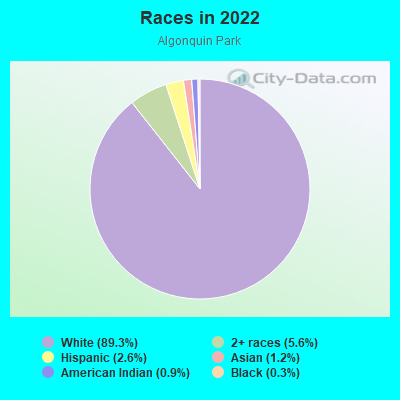
- 2,62589.3%White
- 1655.6%Two or more races
- 752.6%Hispanic or Latino
- 361.2%Asian
- 270.9%American Indian
- 100.3%Black
Median household income in 2022:
| Algonquin Park: | $95,717 |
| Livonia: | $92,125 |
Distribution of median household income
![Distribution of median household income]()
- 20Less than $10,000
- 138$10,000 to $19,999
- 51$20,000 to $29,999
- 52$30,000 to $39,999
- 213$40,000 to $49,999
- 97$50,000 to $59,999
- 106$60,000 to $74,999
- 143$75,000 to $99,999
- 117$100,000 to $124,999
- 96$125,000 to $149,999
- 112$150,000 to $199,999
- 150$200,000 or more

Distribution of owner-occupied house/condo value
![Distribution of owner-occupied house/condo value]()
- 8Less than $50,000
- 46$50,000 to $99,999
- 35$100,000 to $149,999
- 137$150,000 to $199,999
- 378$200,000 to $249,999
- 221$250,000 to $299,999
- 231$300,000 to $399,999
- 38$400,000 to $499,999
- 15$500,000 to $749,999

Distribution of rent paid by renters
![Distribution of rent paid by renters]()
- 13$700 to $799
- 16$900 to $999
- 74$1,000 to $1,249
- 58$1,250 to $1,499
- 14$1,500 to $1,999

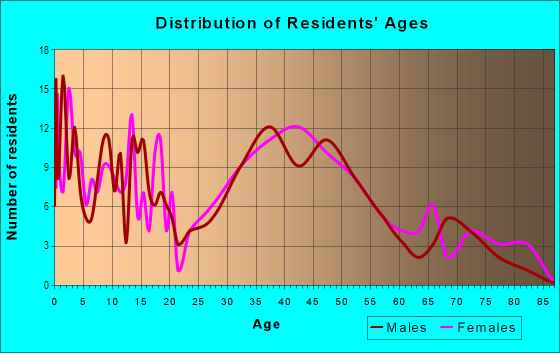
| Males: | 1,561 |
| Females: | 1,258 |
Males:
| This neighborhood: | 41.7 years |
| Whole city: | 42.2 years |
| This neighborhood: | 43.3 years |
| Whole city: | 46.5 years |
Average household size:
| Algonquin Park: | 2.5 people |
| Livonia: | 2.4 people |
Percentage of family households:
| Algonquin Park: | 54.4% |
| Livonia: | 44.1% |
| Here: | 52.1% |
| Livonia: | 50.1% |
Percentage of married-couple families with children (among all households):
| Algonquin Park: | 28.1% |
| Livonia: | 33.5% |
Percentage of single-mother households (among all households):
| Algonquin Park: | 12.6% |
| Livonia: | 6.6% |
Percentage of never married males 15 years old and over:
Percentage of never married females 15 years old and over:
| Algonquin Park: | 24.6% |
| Livonia: | 16.7% |
Percentage of never married females 15 years old and over:
| Algonquin Park: | 14.3% |
| city: | 12.0% |
Percentage of people that speak English not well or not at all:
| Algonquin Park: | 0.3% |
| Livonia: | 1.4% |
Percentage of people born in this state:
Percentage of people born in another U.S. state:
Percentage of native residents but born outside the U.S.:
Percentage of foreign born residents:
| Here: | 84.0% |
| Livonia: | 78.1% |
Percentage of people born in another U.S. state:
| Algonquin Park: | 10.3% |
| Livonia: | 13.0% |
Percentage of native residents but born outside the U.S.:
| Here: | 0.6% |
| city: | 0.4% |
Percentage of foreign born residents:
| Here: | 5.6% |
| Livonia: | 8.4% |
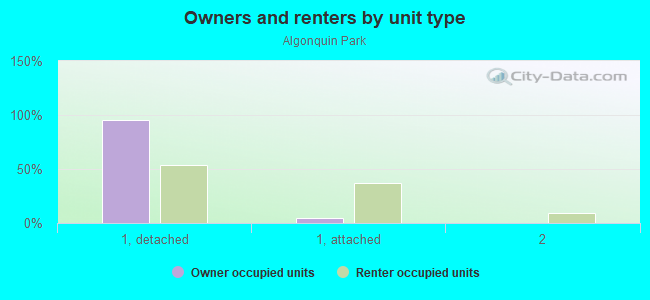
Owner-occupied
Renter-occupied

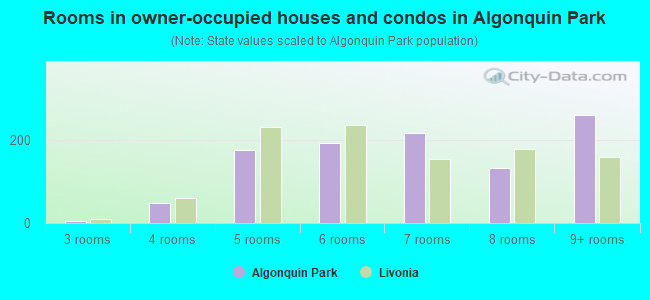
- Rooms in owner-occupied houses and condos in Algonquin Park
- 01 room
- 02 rooms
- 43 rooms
- 494 rooms
- 1755 rooms
- 1926 rooms
- 2177 rooms
- 1328 rooms
- 2609+ rooms
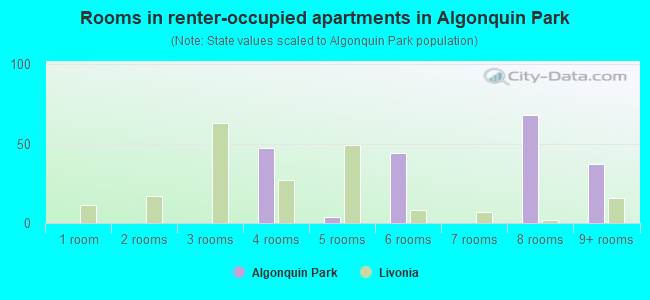
- Rooms in renter-occupied apartments in Algonquin Park
- 01 room
- 02 rooms
- 03 rooms
- 474 rooms
- 45 rooms
- 446 rooms
- 07 rooms
- 688 rooms
- 379+ rooms
Owner-occupied
Renter-occupied
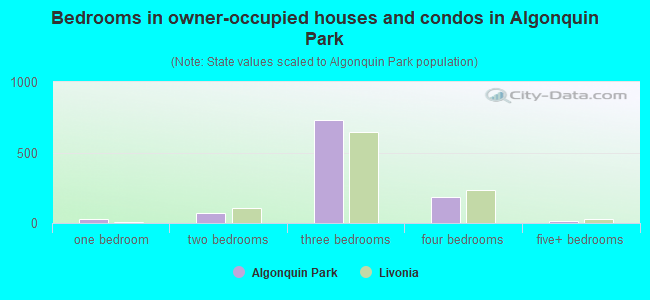
- Bedrooms in owner-occupied houses and condos in Algonquin Park
- 0no bedroom
- 281 bedroom
- 742 bedrooms
- 7283 bedrooms
- 1844 bedrooms
- 115+ bedrooms
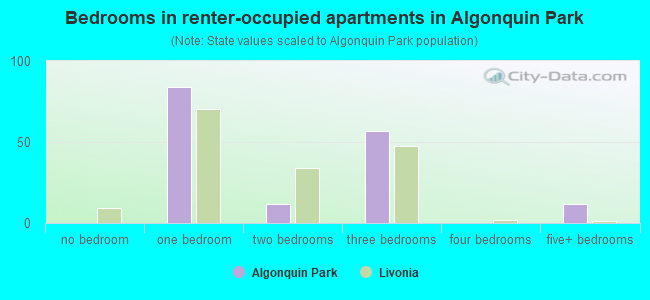
- Bedrooms in renter-occupied apartments in Algonquin Park
- 0no bedroom
- 841 bedroom
- 122 bedrooms
- 573 bedrooms
- 04 bedrooms
- 125+ bedrooms
Average number of cars or other vehicles available in houses/condos:
Average number of cars or other vehicles available in apartments:
| This neighborhood: | 1.9 |
| Livonia: | 2.0 |
Average number of cars or other vehicles available in apartments:
| Here: | 3.6 |
| city: | 1.3 |
Percentage of units with a mortgage:
| Algonquin Park: | 70.7% |
| Livonia: | 60.8% |
Average estimated value of detached houses in 2022 (97.0% of all units):
| Algonquin Park: | $267,907 |
| Livonia: | $291,361 |
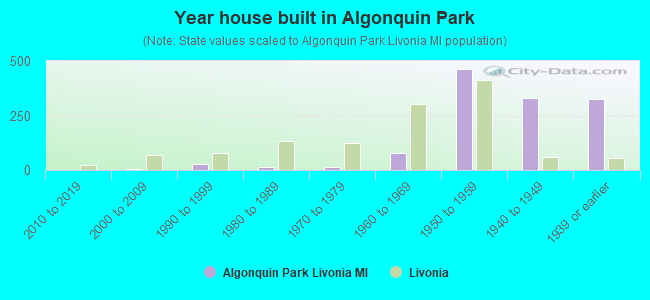
- Year house built in Algonquin Park
- 02020 or later
- 02010 to 2019
- 52000 to 2009
- 261990 to 1999
- 141980 to 1989
- 131970 to 1979
- 801960 to 1969
- 4631950 to 1959
- 3321940 to 1949
- 3251939 or earlier
City-data.com crime index for city in 2020 (higher means more crime):
| City: | 122.1 |
| U.S. average: | 219.5 |
Travel time to work (commute)
![Travel time to work (commute)]()
- 9Less than 5 minutes
- 555 to 9 minutes
- 7310 to 14 minutes
- 8615 to 19 minutes
- 14220 to 24 minutes
- 6825 to 29 minutes
- 9530 to 34 minutes
- 3035 to 39 minutes
- 1040 to 44 minutes
- 4945 to 59 minutes
- 4860 to 89 minutes
- 1790 or more minutes

Means of transportation to work
![Means of transportation to work]()
- 82.7%1,119Drove a car alone
- 1.1%15Carpooled
- 0.4%6Bus
- 0.4%6Other means
- 16.1%218Worked at home

Time leaving home to go to work
![Time leaving home to go to work]()
- 1812:00 a.m. to 4:59 a.m.
- 285:00 a.m. to 5:29 a.m.
- 455:30 a.m. to 5:59 a.m.
- 616:00 a.m. to 6:29 a.m.
- 416:30 a.m. to 6:59 a.m.
- 657:00 a.m. to 7:29 a.m.
- 697:30 a.m. to 7:59 a.m.
- 808:00 a.m. to 8:29 a.m.
- 438:30 a.m. to 8:59 a.m.
- 709:00 a.m. to 9:59 a.m.
- 4810:00 a.m. to 10:59 a.m.
- 1011:00 a.m. to 11:59 a.m.
- 4512:00 p.m. to 3:59 p.m.
- 314:00 p.m. to 11:59 p.m.

Occupations of males:
- Percentage of males in management occupations (except farmers):
Here: 11.3% city: 12.8%
- Percentage of males in business and financial operations occupations:
Here: 7.0% city: 6.2%
- Percentage of males in computer and mathematical occupations:
Here: 8.3% city: 6.7%
- Percentage of males in architecture and engineering occupations:
Here: 8.2% city: 8.4%
- Percentage of males in life, physical, and social science occupations:
Here: 1.2% city: 0.4%
- Percentage of males in community and social services occupations:
Here: 1.4% city: 1.0%
- Percentage of males in education, training, and library occupations:
Here: 11.3% city: 3.2%
- Percentage of males in arts, design, entertainment, sports, and media occupations:
Here: 1.5% city: 2.5%
- Percentage of males in healthcare practitioners and technical occupations:
Here: 2.5% city: 2.3%
- Percentage of males in service occupations:
Here: 11.9% city: 11.5%
- Percentage of males in sales and office occupations:
Here: 17.7% city: 15.7%
- Percentage of males in construction, extraction, and maintenance occupations:
Here: 6.4% city: 7.2%
- Percentage of males in production occupations:
Here: 6.4% city: 8.0%
- Percentage of males in transportation occupations:
Here: 2.0% city: 4.8%
- Percentage of males in material moving occupations:
Here: 1.5% city: 3.4%
Occupations of females:
- Percentage of females in management occupations (except farmers):
Here: 11.5% city: 11.2%
- Percentage of females in business and financial operations occupations:
Here: 4.7% city: 7.4%
- Percentage of females in architecture and engineering occupations:
Here: 4.5% city: 2.2%
- Percentage of females in community and social services occupations:
Here: 2.0% city: 2.5%
- Percentage of females in education, training, and library occupations:
Here: 12.3% city: 9.0%
- Percentage of females in arts, design, entertainment, sports, and media occupations:
Here: 2.7% city: 2.5%
- Percentage of females in healthcare practitioners and technical occupations:
Here: 16.7% city: 12.3%
- Percentage of females in service occupations:
Here: 15.8% city: 14.3%
- Percentage of females in sales and office occupations:
Here: 23.4% city: 29.2%
- Percentage of females in construction, extraction, and maintenance occupations:
Here: 2.3% city: 0.3%
- Percentage of females in production occupations:
Here: 3.9% city: 2.1%
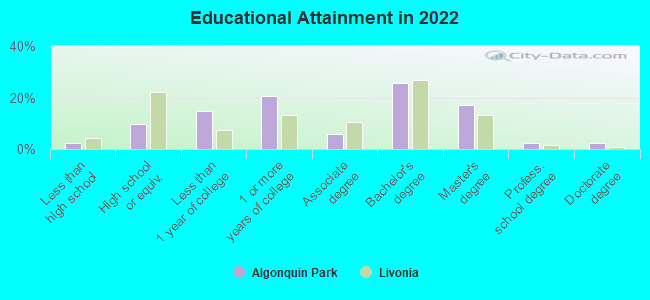
Education in this neighborhood (subdivision or community):
- Percentage of people 3 years and older in K-12 schools:
Algonquin Park: 13.5% Livonia: 13.6%
- Percentage of people 3 years and older in undergraduate colleges:
Algonquin Park: 7.5% Livonia: 4.0%
- Percentage of people 3 years and older in grad. or professional schools:
Algonquin Park: 1.8% Livonia: 1.7%
- Percentage of students K-12 enrolled in private schools:
Algonquin Park: 28.9% Livonia: 13.5%
Percentage of population below poverty level:
| Algonquin Park: | 7.5% |
| Livonia: | 4.6% |
Median year owner moved in (as recorded in 2022):
| Algonquin Park: | 2002 |
| Livonia: | 2008 |
Percentage of married-couple families with both working:
| Algonquin Park: | 79.2% |
| Livonia: | 74.3% |
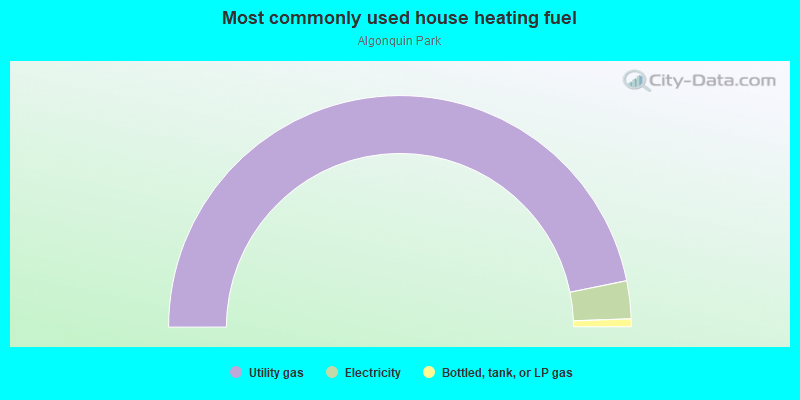
- 93.5%Utility gas
- 5.3%Electricity
- 1.1%Bottled, tank, or LP gas
Roads and streets:
Plymouth Rd
Length: 0.82 miles
Direction: E-W
Address range: 31000 to 32399
Direction: E-W
Address range: 31000 to 32399
Orangelawn St
Length: 0.77 miles
Direction: E-W
Address range: 31150 to 32299
Direction: E-W
Address range: 31150 to 32299
Elmira St
Length: 0.68 miles
Direction: E-W
Address range: 31400 to 32399
Direction: E-W
Address range: 31400 to 32399
Merriman Rd
Length: 0.47 miles
Direction: N-S
Address range: 9901 to 11849
Direction: N-S
Address range: 9901 to 11849
Enterprise Dr
Length: 0.47 miles
Directions: E-W, N-S, SW-NE
Address range: 31700 to 31799
Directions: E-W, N-S, SW-NE
Address range: 31700 to 31799
Arden St
Length: 0.33 miles
Direction: N-S
Address range: 9900 to 11599
Direction: N-S
Address range: 9900 to 11599
Berwick St
Length: 0.33 miles
Direction: N-S
Address range: 9900 to 11599
Direction: N-S
Address range: 9900 to 11599
Auburndale St
Length: 0.33 miles
Direction: N-S
Address range: 9900 to 11599
Direction: N-S
Address range: 9900 to 11599
Melrose (Melrose St)
Length: 0.33 miles
Direction: N-S
Address range: 9900 to 11599
Direction: N-S
Address range: 9900 to 11599
Cranston St
Length: 0.33 miles
Direction: N-S
Address range: 9900 to 11599
Direction: N-S
Address range: 9900 to 11599
Blackburn St
Length: 0.33 miles
Direction: N-S
Address range: 9900 to 11599
Direction: N-S
Address range: 9900 to 11599
Hubbard St
Length: 0.33 miles
Direction: N-S
Address range: 9900 to 11599
Direction: N-S
Address range: 9900 to 11599
Ingram St
Length: 0.33 miles
Direction: N-S
Address range: 9900 to 11599
Direction: N-S
Address range: 9900 to 11599
Denne St
Length: 0.33 miles
Directions: N-S, SW-NE
Address range: 9900 to 11599
Directions: N-S, SW-NE
Address range: 9900 to 11599
Dalhay St
Length: 0.05 miles
Directions: E-W, SW-NE
Address range: 31127 to 31199
Directions: E-W, SW-NE
Address range: 31127 to 31199
Other features:
Ashcroft Drn
Length: 0.09 miles
Direction: E-W
Direction: E-W