Altamont Park neighborhood in Peoria, Illinois (IL), 61604 detailed profile
Settings
X


Business Search - 14 Million verified businesses
Area: 0.124 square miles
Population: 429
Population density:
| Altamont Park: | 3,460 people per square mile |
| Peoria: | 2,460 people per square mile |

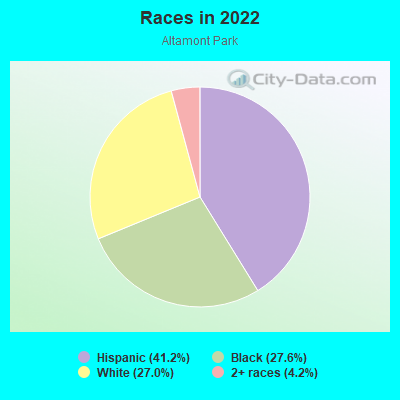
- 23841.2%Hispanic or Latino
- 15927.6%Black
- 15627.0%White
- 244.2%Two or more races
Distribution of median household income
![Distribution of median household income]()
- 56Less than $10,000
- 40$10,000 to $19,999
- 31$20,000 to $29,999
- 38$30,000 to $39,999
- 54$40,000 to $49,999
- 18$50,000 to $59,999
- 44$60,000 to $74,999
- 54$75,000 to $99,999
- 27$100,000 to $124,999
- 48$125,000 to $149,999
- 18$200,000 or more

Distribution of owner-occupied house/condo value
![Distribution of owner-occupied house/condo value]()
- 157Less than $50,000
- 103$50,000 to $99,999
- 46$100,000 to $149,999
- 2$150,000 to $199,999
- 2$200,000 to $249,999
- 27$300,000 to $399,999
- 18$750,000 to $999,999

Distribution of rent paid by renters
![Distribution of rent paid by renters]()
- 2$100 to $199
- 44$200 to $299
- 89$300 to $399
- 16$400 to $499
- 28$500 to $599
- 34$600 to $699
- 16$700 to $799
- 21$800 to $899
- 48$900 to $999
- 12$1,000 to $1,249

Median rent in 2022:
| Altamont Park: | $413 |
| Peoria: | $696 |
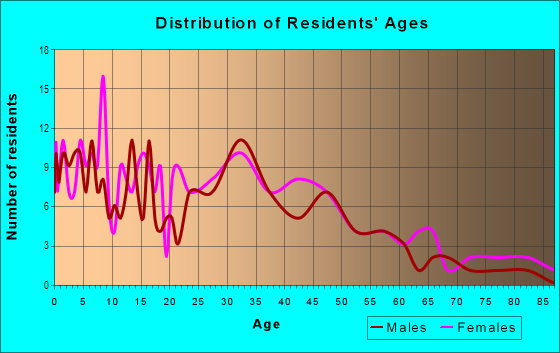
| Males: | 151 |
| Females: | 277 |
Males:
| This neighborhood: | 61.0 years |
| Whole city: | 33.8 years |
| This neighborhood: | 58.1 years |
| Whole city: | 36.0 years |
Average household size:
| Altamont Park: | 1.5 people |
| Peoria: | 2.2 people |
Percentage of family households:
| Altamont Park: | 50.9% |
| Peoria: | 41.0% |
| Here: | 31.1% |
| Peoria: | 33.8% |
Percentage of married-couple families with children (among all households):
| Altamont Park: | 31.6% |
| Peoria: | 22.1% |
Percentage of single-mother households (among all households):
| Altamont Park: | 12.1% |
| Peoria: | 16.8% |
Percentage of never married males 15 years old and over:
Percentage of never married females 15 years old and over:
| Altamont Park: | 15.1% |
| Peoria: | 19.6% |
Percentage of never married females 15 years old and over:
| Altamont Park: | 18.1% |
| city: | 19.0% |
Percentage of people that speak English not well or not at all:
| Altamont Park: | 6.5% |
| Peoria: | 1.6% |
Percentage of people born in this state:
Percentage of people born in another U.S. state:
Percentage of native residents but born outside the U.S.:
Percentage of foreign born residents:
| Here: | 72.7% |
| Peoria: | 72.0% |
Percentage of people born in another U.S. state:
| Altamont Park: | 16.6% |
| Peoria: | 18.8% |
Percentage of native residents but born outside the U.S.:
| Here: | 2.4% |
| city: | 1.4% |
Percentage of foreign born residents:
| Here: | 8.3% |
| Peoria: | 7.8% |
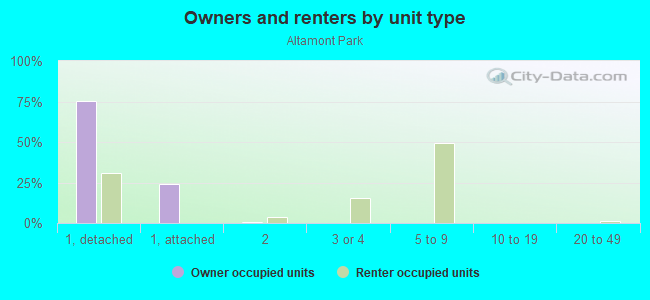
Owner-occupied
Renter-occupied

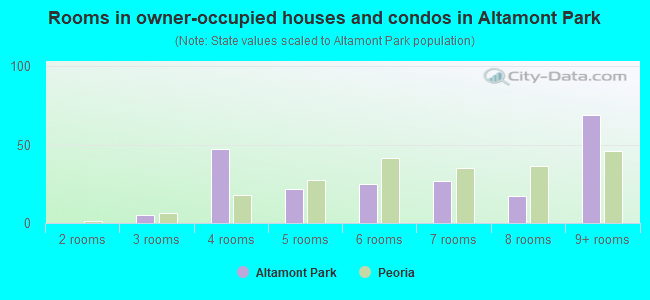
- Rooms in owner-occupied houses and condos in Altamont Park
- 01 room
- 02 rooms
- 53 rooms
- 474 rooms
- 225 rooms
- 256 rooms
- 277 rooms
- 178 rooms
- 699+ rooms
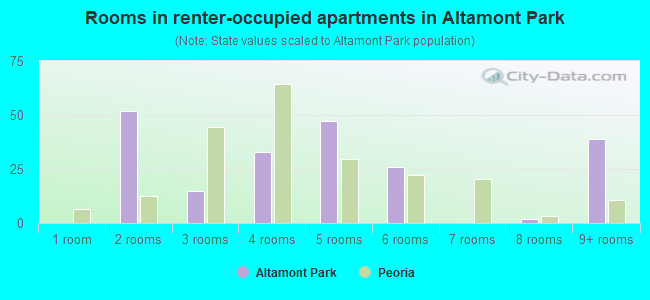
- Rooms in renter-occupied apartments in Altamont Park
- 01 room
- 522 rooms
- 153 rooms
- 334 rooms
- 475 rooms
- 266 rooms
- 07 rooms
- 28 rooms
- 399+ rooms
Owner-occupied
Renter-occupied
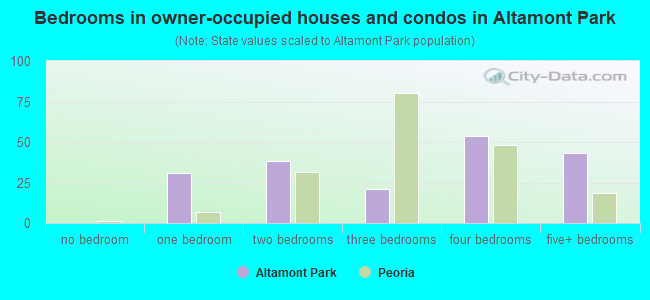
- Bedrooms in owner-occupied houses and condos in Altamont Park
- 0no bedroom
- 311 bedroom
- 382 bedrooms
- 213 bedrooms
- 544 bedrooms
- 435+ bedrooms
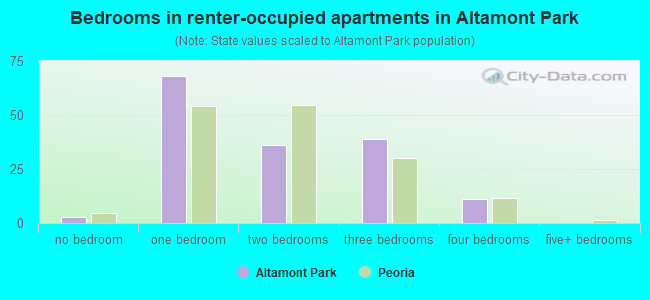
- Bedrooms in renter-occupied apartments in Altamont Park
- 3no bedroom
- 681 bedroom
- 362 bedrooms
- 393 bedrooms
- 114 bedrooms
- 05+ bedrooms
Average number of cars or other vehicles available in houses/condos:
Average number of cars or other vehicles available in apartments:
| This neighborhood: | 2.9 |
| Peoria: | 1.8 |
Average number of cars or other vehicles available in apartments:
| Here: | 1.7 |
| city: | 1.1 |
Percentage of units with a mortgage:
| Altamont Park: | 72.9% |
| Peoria: | 63.0% |
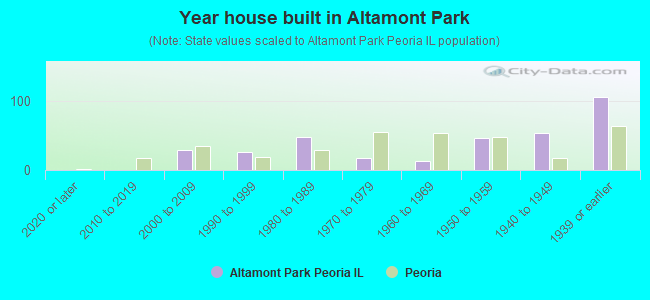
- Year house built in Altamont Park
- 02020 or later
- 02010 to 2019
- 292000 to 2009
- 261990 to 1999
- 481980 to 1989
- 171970 to 1979
- 131960 to 1969
- 461950 to 1959
- 541940 to 1949
- 1051939 or earlier
City-data.com crime index for city in 2020 (higher means more crime):
| City: | 443.5 |
| U.S. average: | 219.5 |
Travel time to work (commute)
![Travel time to work (commute)]()
- 11Less than 5 minutes
- 225 to 9 minutes
- 9610 to 14 minutes
- 5715 to 19 minutes
- 4520 to 24 minutes
- 2430 to 34 minutes
- 3945 to 59 minutes

Means of transportation to work
![Means of transportation to work]()
- 82.9%167Drove a car alone
- 8.4%17Carpooled
- 7.9%16Bus
- 17.9%36Walked
- 1.0%2Other means
- 12.4%25Worked at home

Time leaving home to go to work
![Time leaving home to go to work]()
- 2312:00 a.m. to 4:59 a.m.
- 285:00 a.m. to 5:29 a.m.
- 15:30 a.m. to 5:59 a.m.
- 216:00 a.m. to 6:29 a.m.
- 236:30 a.m. to 6:59 a.m.
- 187:00 a.m. to 7:29 a.m.
- 357:30 a.m. to 7:59 a.m.
- 108:00 a.m. to 8:29 a.m.
- 118:30 a.m. to 8:59 a.m.
- 139:00 a.m. to 9:59 a.m.
- 2810:00 a.m. to 10:59 a.m.
- 211:00 a.m. to 11:59 a.m.
- 2412:00 p.m. to 3:59 p.m.
- 244:00 p.m. to 11:59 p.m.

Occupations of males:
- Percentage of males in computer and mathematical occupations:
Here: 4.1% city: 6.1%
- Percentage of males in architecture and engineering occupations:
Here: 1.7% city: 9.0%
- Percentage of males in arts, design, entertainment, sports, and media occupations:
Here: 7.1% city: 1.9%
- Percentage of males in service occupations:
Here: 55.6% city: 15.9%
- Percentage of males in sales and office occupations:
Here: 10.3% city: 12.1%
- Percentage of males in farming, fishing, and forestry occupations:
Here: 15.7% city: 1.0%
- Percentage of males in construction, extraction, and maintenance occupations:
Here: 2.6% city: 5.4%
- Percentage of males in production occupations:
Here: 17.1% city: 7.6%
- Percentage of males in transportation occupations:
Here: 1.5% city: 5.1%
- Percentage of males in material moving occupations:
Here: 14.5% city: 6.4%
Occupations of females:
- Percentage of females in management occupations (except farmers):
Here: 6.3% city: 8.2%
- Percentage of females in architecture and engineering occupations:
Here: 1.3% city: 1.7%
- Percentage of females in life, physical, and social science occupations:
Here: 4.8% city: 1.4%
- Percentage of females in community and social services occupations:
Here: 1.9% city: 3.4%
- Percentage of females in healthcare practitioners and technical occupations:
Here: 5.1% city: 14.9%
- Percentage of females in service occupations:
Here: 12.0% city: 24.2%
- Percentage of females in sales and office occupations:
Here: 82.9% city: 23.2%
- Percentage of females in transportation occupations:
Here: 1.2% city: 0.4%
- Percentage of females in material moving occupations:
Here: 2.4% city: 2.4%
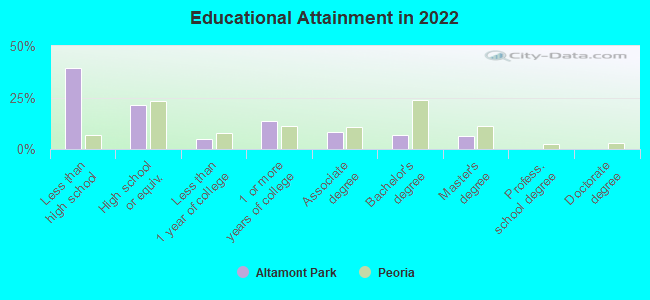
Education in this neighborhood (subdivision or community):
- Percentage of people 3 years and older in K-12 schools:
Altamont Park: 38.2% Peoria: 17.8%
- Percentage of people 3 years and older in undergraduate colleges:
Altamont Park: 2.7% Peoria: 7.5%
- Percentage of people 3 years and older in grad. or professional schools:
Altamont Park: 3.2% Peoria: 2.5%
- Percentage of students K-12 enrolled in private schools:
Altamont Park: 6.5% Peoria: 16.0%
Percentage of population below poverty level:
| Altamont Park: | 22.1% |
| Peoria: | 17.4% |
Median year renter moved in (as recorded in 2022):
| Altamont Park: | 2014 |
| Peoria: | 2020 |
Percentage of married-couple families with both working:
| Altamont Park: | 105.3% |
| Peoria: | 71.4% |
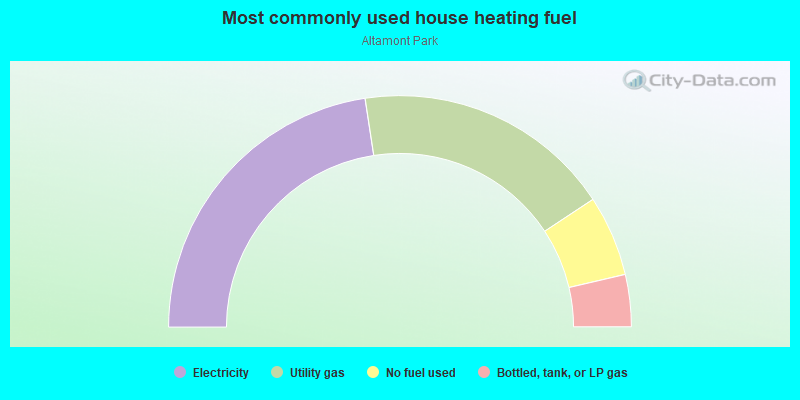
- 45.2%Electricity
- 36.2%Utility gas
- 11.3%No fuel used
- 7.3%Bottled, tank, or LP gas
Roads and streets:
W Thrush Ave
Length: 0.23 miles
Direction: E-W
Address range: 900 to 1107
Direction: E-W
Address range: 900 to 1107
N Broadway St
Length: 0.19 miles
Directions: E-W, N-S
Address range: 2200 to 2399
Directions: E-W, N-S
Address range: 2200 to 2399