Battenfield neighborhood in Lansing, Michigan (MI), 48910 detailed profile
Settings
X


Business Search - 14 Million verified businesses
Area: 0.093 square miles
Population: 243
Population density:
| Battenfield: | 2,626 people per square mile |
| Lansing: | 3,223 people per square mile |

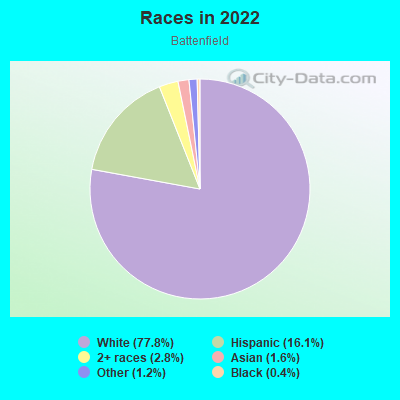
- 19377.8%White
- 4016.1%Hispanic or Latino
- 72.8%Two or more races
- 41.6%Asian
- 31.2%Some other race
- 10.4%Black
Median household income in 2022:
| Battenfield: | $56,614 |
| Lansing: | $48,962 |
Distribution of median household income
![Distribution of median household income]()
- 11Less than $10,000
- 22$10,000 to $19,999
- 28$20,000 to $29,999
- 9$30,000 to $39,999
- 14$40,000 to $49,999
- 2$50,000 to $59,999
- 10$60,000 to $74,999
- 22$75,000 to $99,999
- 10$100,000 to $124,999
- 4$125,000 to $149,999
- 2$150,000 to $199,999
- 1$200,000 or more

Distribution of owner-occupied house/condo value
![Distribution of owner-occupied house/condo value]()
- 15Less than $50,000
- 58$50,000 to $99,999
- 12$100,000 to $149,999
- 5$150,000 to $199,999
- 2$200,000 to $249,999
- 4$250,000 to $299,999

Distribution of rent paid by renters
![Distribution of rent paid by renters]()
- 4$200 to $299
- 2$300 to $399
- 1$400 to $499
- 10$500 to $599
- 8$600 to $699
- 17$700 to $799
- 10$800 to $899
- 5$900 to $999
- 2$1,000 to $1,249
- 1$1,500 to $1,999

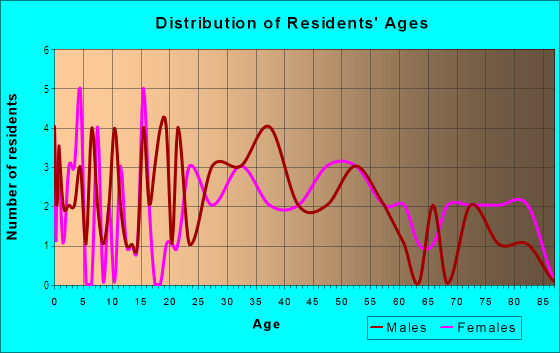
| Males: | 137 |
| Females: | 105 |
Males:
| This neighborhood: | 36.2 years |
| Whole city: | 33.0 years |
| This neighborhood: | 37.7 years |
| Whole city: | 34.5 years |
Average household size:
| Battenfield: | 2.3 people |
| Lansing: | 2.1 people |
Percentage of family households:
| Battenfield: | 37.3% |
| Lansing: | 33.9% |
| Here: | 29.5% |
| Lansing: | 27.4% |
Percentage of married-couple families with children (among all households):
| Battenfield: | 10.4% |
| Lansing: | 23.0% |
Percentage of single-mother households (among all households):
| Battenfield: | 18.9% |
| Lansing: | 14.1% |
Percentage of never married males 15 years old and over:
Percentage of never married females 15 years old and over:
| Battenfield: | 15.8% |
| Lansing: | 24.9% |
Percentage of never married females 15 years old and over:
| Battenfield: | 28.8% |
| city: | 21.6% |
Percentage of people that speak English not well or not at all:
| Battenfield: | 0.0% |
| Lansing: | 2.3% |
Percentage of people born in this state:
Percentage of people born in another U.S. state:
Percentage of native residents but born outside the U.S.:
Percentage of foreign born residents:
| Here: | 76.3% |
| Lansing: | 72.5% |
Percentage of people born in another U.S. state:
| Battenfield: | 17.8% |
| Lansing: | 19.1% |
Percentage of native residents but born outside the U.S.:
| Here: | 0.5% |
| city: | 0.8% |
Percentage of foreign born residents:
| Here: | 5.4% |
| Lansing: | 7.6% |
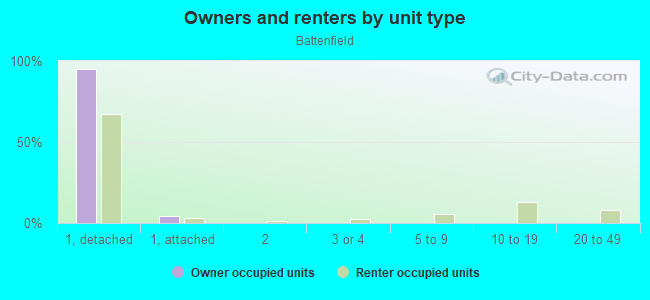
Owner-occupied
Renter-occupied

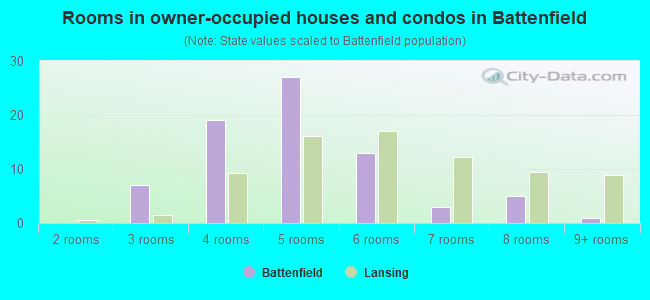
- Rooms in owner-occupied houses and condos in Battenfield
- 01 room
- 02 rooms
- 73 rooms
- 194 rooms
- 275 rooms
- 136 rooms
- 37 rooms
- 58 rooms
- 19+ rooms
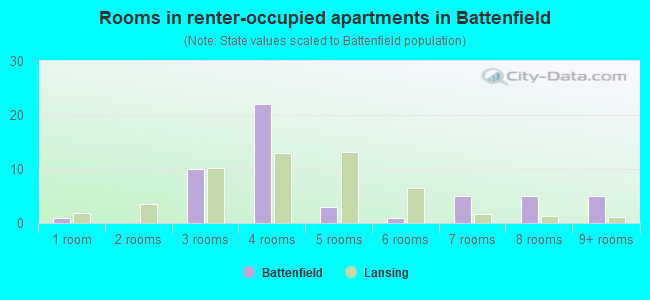
- Rooms in renter-occupied apartments in Battenfield
- 11 room
- 02 rooms
- 103 rooms
- 224 rooms
- 35 rooms
- 16 rooms
- 57 rooms
- 58 rooms
- 59+ rooms
Owner-occupied
Renter-occupied
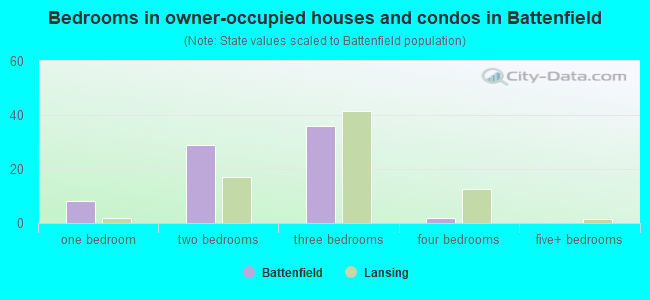
- Bedrooms in owner-occupied houses and condos in Battenfield
- 0no bedroom
- 81 bedroom
- 292 bedrooms
- 363 bedrooms
- 24 bedrooms
- 05+ bedrooms
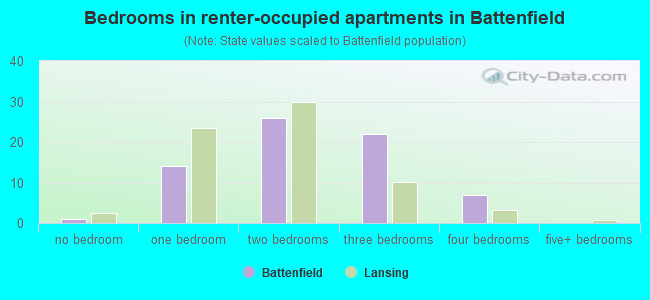
- Bedrooms in renter-occupied apartments in Battenfield
- 1no bedroom
- 141 bedroom
- 262 bedrooms
- 223 bedrooms
- 74 bedrooms
- 05+ bedrooms
Average number of cars or other vehicles available in houses/condos:
Average number of cars or other vehicles available in apartments:
| This neighborhood: | 1.7 |
| Lansing: | 1.7 |
Average number of cars or other vehicles available in apartments:
| Here: | 1.0 |
| city: | 1.1 |
Percentage of units with a mortgage:
| Battenfield: | 61.1% |
| Lansing: | 65.6% |
Average estimated value of detached houses in 2022 (91.2% of all units):
| Battenfield: | $75,789 |
| Lansing: | $121,378 |
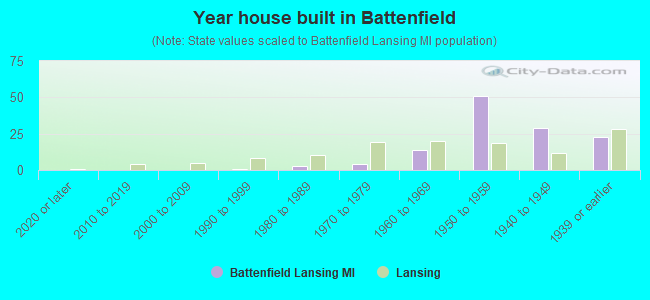
- Year house built in Battenfield
- 02020 or later
- 02010 to 2019
- 02000 to 2009
- 11990 to 1999
- 31980 to 1989
- 41970 to 1979
- 141960 to 1969
- 511950 to 1959
- 291940 to 1949
- 231939 or earlier
City-data.com crime index for city in 2020 (higher means more crime):
| City: | 553.0 |
| U.S. average: | 219.5 |
Travel time to work (commute)
![Travel time to work (commute)]()
- 1Less than 5 minutes
- 135 to 9 minutes
- 5010 to 14 minutes
- 2615 to 19 minutes
- 1920 to 24 minutes
- 125 to 29 minutes
- 1030 to 34 minutes
- 235 to 39 minutes
- 140 to 44 minutes
- 145 to 59 minutes
- 260 to 89 minutes
- 190 or more minutes

Means of transportation to work
![Means of transportation to work]()
- 64.1%60Drove a car alone
- 15.0%14Carpooled
- 3.2%3Walked
- 19.2%18Worked at home

Time leaving home to go to work
![Time leaving home to go to work]()
- 812:00 a.m. to 4:59 a.m.
- 15:00 a.m. to 5:29 a.m.
- 45:30 a.m. to 5:59 a.m.
- 66:00 a.m. to 6:29 a.m.
- 146:30 a.m. to 6:59 a.m.
- 147:00 a.m. to 7:29 a.m.
- 307:30 a.m. to 7:59 a.m.
- 78:00 a.m. to 8:29 a.m.
- 48:30 a.m. to 8:59 a.m.
- 119:00 a.m. to 9:59 a.m.
- 410:00 a.m. to 10:59 a.m.
- 311:00 a.m. to 11:59 a.m.
- 812:00 p.m. to 3:59 p.m.
- 124:00 p.m. to 11:59 p.m.

Occupations of males:
- Percentage of males in computer and mathematical occupations:
Here: 19.8% city: 6.1%
- Percentage of males in service occupations:
Here: 13.2% city: 17.2%
- Percentage of males in sales and office occupations:
Here: 14.6% city: 13.3%
- Percentage of males in farming, fishing, and forestry occupations:
Here: 47.4% city: 1.5%
- Percentage of males in production occupations:
Here: 4.6% city: 9.4%
Occupations of females:
- Percentage of females in business and financial operations occupations:
Here: 7.9% city: 6.7%
- Percentage of females in computer and mathematical occupations:
Here: 22.5% city: 2.4%
- Percentage of females in life, physical, and social science occupations:
Here: 2.6% city: 1.6%
- Percentage of females in community and social services occupations:
Here: 6.8% city: 2.9%
- Percentage of females in education, training, and library occupations:
Here: 10.2% city: 8.7%
- Percentage of females in arts, design, entertainment, sports, and media occupations:
Here: 2.3% city: 1.7%
- Percentage of females in healthcare practitioners and technical occupations:
Here: 14.6% city: 6.7%
- Percentage of females in service occupations:
Here: 14.1% city: 25.0%
- Percentage of females in sales and office occupations:
Here: 21.6% city: 25.9%
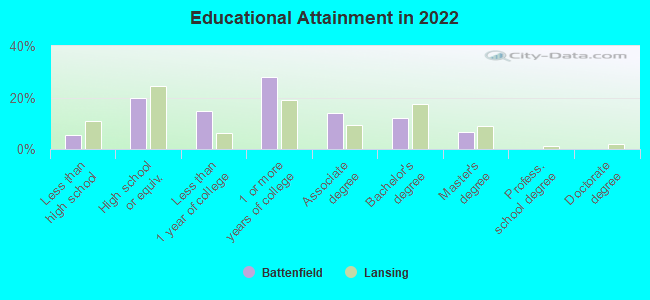
Education in this neighborhood (subdivision or community):
- Percentage of people 3 years and older in K-12 schools:
Battenfield: 16.5% Lansing: 14.3%
- Percentage of people 3 years and older in undergraduate colleges:
Battenfield: 8.2% Lansing: 4.6%
- Percentage of people 3 years and older in grad. or professional schools:
Battenfield: 1.7% Lansing: 2.6%
- Percentage of students K-12 enrolled in private schools:
Battenfield: 0.0% Lansing: 7.9%
Percentage of population below poverty level:
| Battenfield: | 17.6% |
| Lansing: | 22.2% |
Median year owner moved in (as recorded in 2022):
Median year renter moved in (as recorded in 2022):
| Battenfield: | 2007 |
| Lansing: | 2012 |
Median year renter moved in (as recorded in 2022):
| Battenfield: | 2019 |
| Lansing: | 2020 |
Percentage of married-couple families with both working:
| Battenfield: | 138.8% |
| Lansing: | 59.6% |
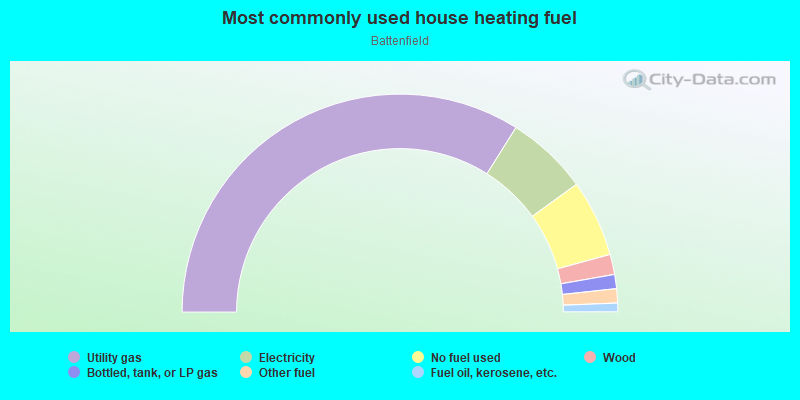
- 67.8%Utility gas
- 12.2%Electricity
- 11.4%No fuel used
- 3.0%Wood
- 2.1%Bottled, tank, or LP gas
- 2.1%Other fuel
- 1.3%Fuel oil, kerosene, etc.
Roads and streets:
Devonshire Ave
Length: 0.37 miles
Direction: N-S
Address range: 4500 to 5099
Direction: N-S
Address range: 4500 to 5099
Alpha St
Length: 0.37 miles
Direction: N-S
Address range: 4500 to 5099
Direction: N-S
Address range: 4500 to 5099
E Jolly Rd
Length: 0.16 miles
Direction: E-W
Address range: 1100 to 1314
Direction: E-W
Address range: 1100 to 1314
Tranter St
Length: 0.13 miles
Direction: N-S
Address range: 4800 to 5099
Direction: N-S
Address range: 4800 to 5099
Kendon Dr
Length: 0.08 miles
Direction: E-W
Address range: 1100 to 1199
Direction: E-W
Address range: 1100 to 1199
Samantha St
Length: 0.08 miles
Direction: E-W
Address range: 1100 to 1199
Direction: E-W
Address range: 1100 to 1199