Broadway Area neighborhood in Ann Arbor, Michigan (MI), 48105 detailed profile
Settings
X

Business Search - 14 Million verified businesses
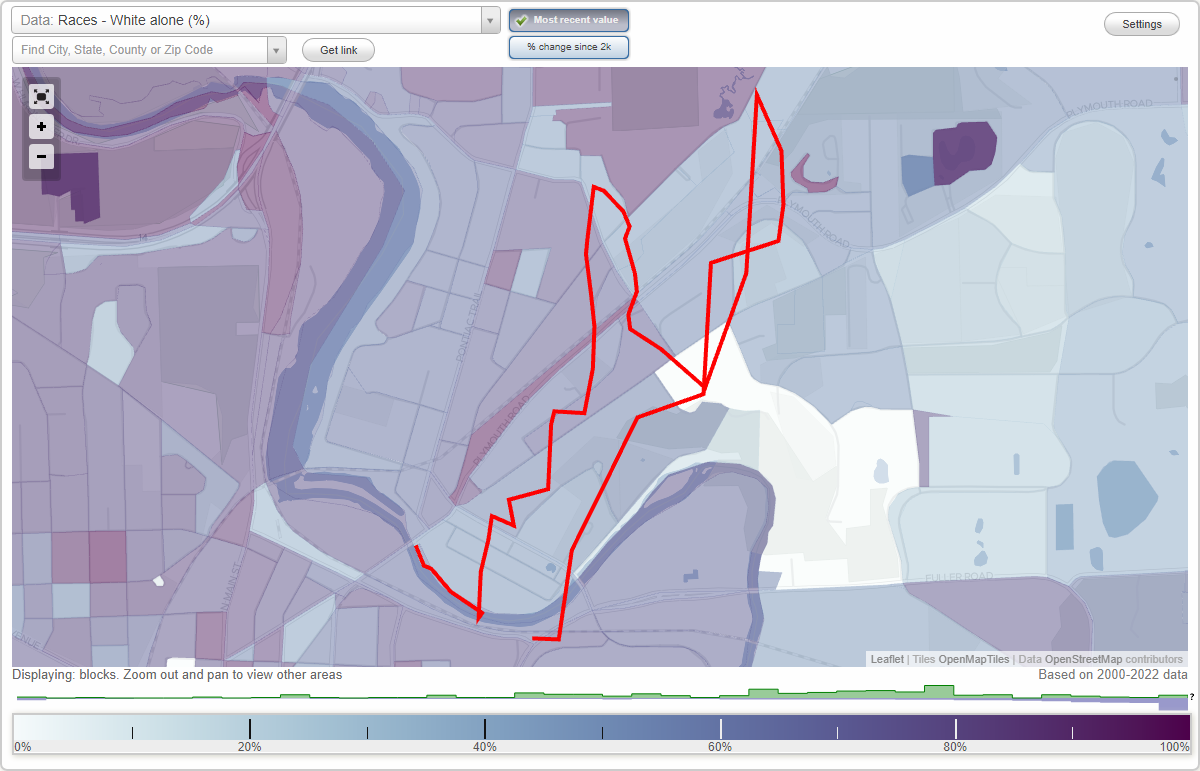
Area: 0.292 square miles
Population: 2,738
Population density:
| Broadway Area: | 9,369 people per square mile |
| Ann Arbor: | 4,438 people per square mile |

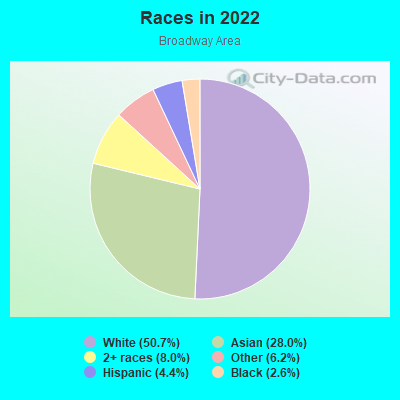
- 1,48550.7%White
- 82128.0%Asian
- 2338.0%Two or more races
- 1826.2%Some other race
- 1304.4%Hispanic or Latino
- 762.6%Black
Distribution of median household income
![Distribution of median household income]()
- 264Less than $10,000
- 109$10,000 to $19,999
- 90$20,000 to $29,999
- 185$30,000 to $39,999
- 129$40,000 to $49,999
- 161$50,000 to $59,999
- 245$60,000 to $74,999
- 152$75,000 to $99,999
- 94$100,000 to $124,999
- 127$125,000 to $149,999
- 182$150,000 to $199,999
- 81$200,000 or more

Distribution of owner-occupied house/condo value
![Distribution of owner-occupied house/condo value]()
- 9Less than $50,000
- 107$100,000 to $149,999
- 15$150,000 to $199,999
- 181$200,000 to $249,999
- 73$250,000 to $299,999
- 63$300,000 to $399,999
- 47$400,000 to $499,999
- 55$500,000 to $749,999
- 22$750,000 to $999,999
- 76$1,000,000 or more

Distribution of rent paid by renters
![Distribution of rent paid by renters]()
- 79$100 to $199
- 98$200 to $299
- 109$300 to $399
- 56$400 to $499
- 31$500 to $599
- 227$600 to $699
- 61$700 to $799
- 60$800 to $899
- 143$900 to $999
- 241$1,000 to $1,249
- 318$1,250 to $1,499
- 345$1,500 to $1,999
- 325$2,000 or more

Median rent in 2022:
| Broadway Area: | $1,407 |
| Ann Arbor: | $1,381 |
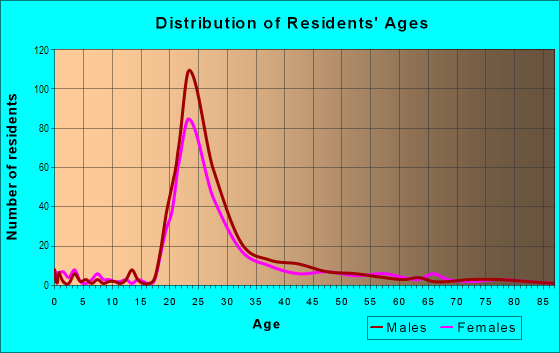
| Males: | 1,411 |
| Females: | 1,326 |
Males:
| This neighborhood: | 25.7 years |
| Whole city: | 25.8 years |
| This neighborhood: | 42.4 years |
| Whole city: | 26.4 years |
Average household size:
| Broadway Area: | 4.8 people |
| Ann Arbor: | 2.2 people |
Percentage of family households:
| Broadway Area: | 24.7% |
| Ann Arbor: | 30.6% |
| Here: | 22.9% |
| Ann Arbor: | 33.8% |
Percentage of married-couple families with children (among all households):
| Broadway Area: | 29.2% |
| Ann Arbor: | 33.4% |
Percentage of single-mother households (among all households):
| Broadway Area: | 41.8% |
| Ann Arbor: | 5.6% |
Percentage of never married males 15 years old and over:
Percentage of never married females 15 years old and over:
| Broadway Area: | 35.1% |
| Ann Arbor: | 30.5% |
Percentage of never married females 15 years old and over:
| Broadway Area: | 27.5% |
| city: | 27.5% |
Percentage of people that speak English not well or not at all:
| Broadway Area: | 6.7% |
| Ann Arbor: | 1.5% |
Percentage of people born in this state:
Percentage of people born in another U.S. state:
Percentage of native residents but born outside the U.S.:
Percentage of foreign born residents:
| Here: | 40.3% |
| Ann Arbor: | 45.8% |
Percentage of people born in another U.S. state:
| Broadway Area: | 28.4% |
| Ann Arbor: | 34.9% |
Percentage of native residents but born outside the U.S.:
| Here: | 2.3% |
| city: | 1.6% |
Percentage of foreign born residents:
| Here: | 29.0% |
| Ann Arbor: | 17.7% |
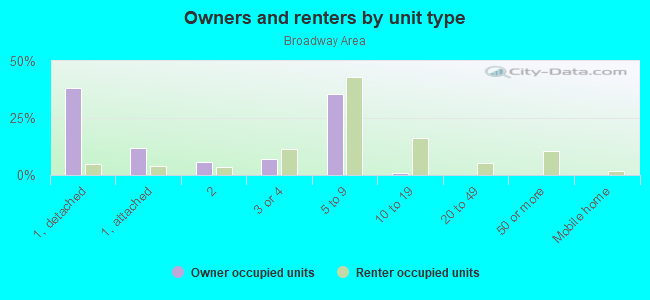
Owner-occupied
Renter-occupied

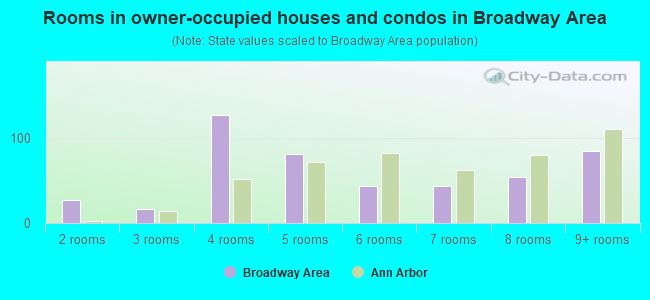
- Rooms in owner-occupied houses and condos in Broadway Area
- 01 room
- 272 rooms
- 163 rooms
- 1274 rooms
- 815 rooms
- 436 rooms
- 447 rooms
- 548 rooms
- 859+ rooms
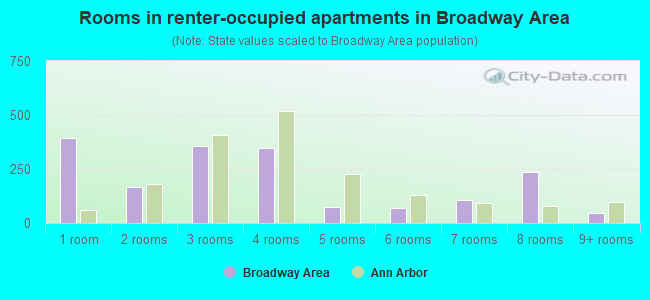
- Rooms in renter-occupied apartments in Broadway Area
- 3921 room
- 1672 rooms
- 3553 rooms
- 3464 rooms
- 755 rooms
- 686 rooms
- 1067 rooms
- 2368 rooms
- 479+ rooms
Owner-occupied
Renter-occupied
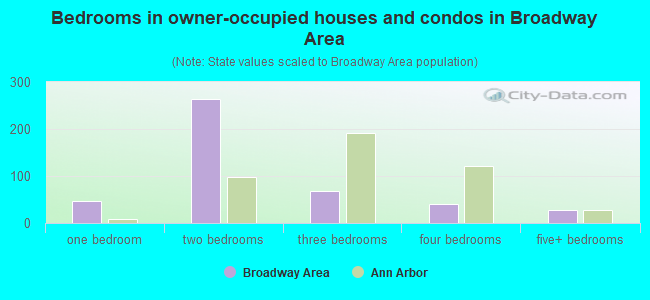
- Bedrooms in owner-occupied houses and condos in Broadway Area
- 0no bedroom
- 471 bedroom
- 2642 bedrooms
- 693 bedrooms
- 404 bedrooms
- 275+ bedrooms
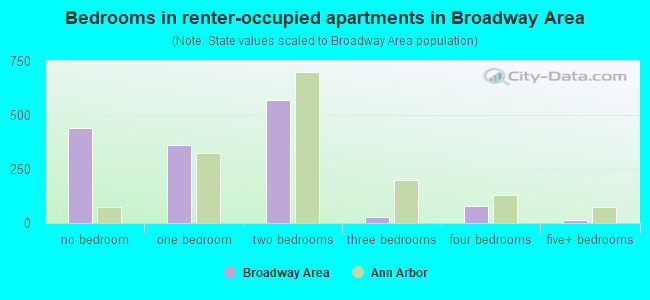
- Bedrooms in renter-occupied apartments in Broadway Area
- 439no bedroom
- 3591 bedroom
- 5702 bedrooms
- 293 bedrooms
- 814 bedrooms
- 155+ bedrooms
Average number of cars or other vehicles available in houses/condos:
Average number of cars or other vehicles available in apartments:
| This neighborhood: | |
| Ann Arbor: |
Average number of cars or other vehicles available in apartments:
| Here: | 1.3 |
| city: | 1.3 |
Percentage of units with a mortgage:
| Broadway Area: | 68.4% |
| Ann Arbor: | 62.6% |
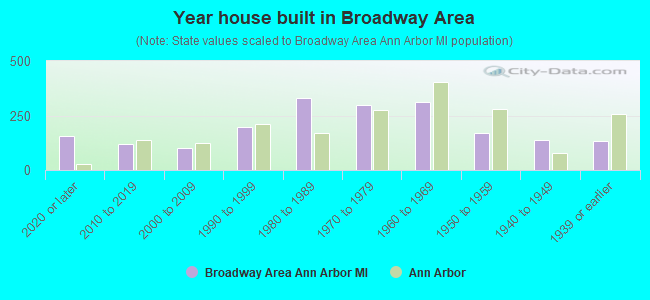
- Year house built in Broadway Area
- 1582020 or later
- 1212010 to 2019
- 1022000 to 2009
- 1971990 to 1999
- 3321980 to 1989
- 3001970 to 1979
- 3101960 to 1969
- 1721950 to 1959
- 1381940 to 1949
- 1341939 or earlier
City-data.com crime index for city in 2020 (higher means more crime):
| City: | 137.0 |
| U.S. average: | 219.5 |
Travel time to work (commute)
![Travel time to work (commute)]()
- 9Less than 5 minutes
- 925 to 9 minutes
- 29510 to 14 minutes
- 35615 to 19 minutes
- 28220 to 24 minutes
- 3425 to 29 minutes
- 15530 to 34 minutes
- 1235 to 39 minutes
- 1140 to 44 minutes
- 4245 to 59 minutes
- 4360 to 89 minutes
- 4790 or more minutes

Means of transportation to work
![Means of transportation to work]()
- 39.1%624Drove a car alone
- 1.6%25Carpooled
- 9.3%149Bus
- 0.5%8Taxi
- 7.6%121Bicycle
- 29.0%462Walked
- 15.8%252Worked at home

Time leaving home to go to work
![Time leaving home to go to work]()
- 1512:00 a.m. to 4:59 a.m.
- 205:00 a.m. to 5:29 a.m.
- 775:30 a.m. to 5:59 a.m.
- 656:00 a.m. to 6:29 a.m.
- 286:30 a.m. to 6:59 a.m.
- 1237:00 a.m. to 7:29 a.m.
- 1067:30 a.m. to 7:59 a.m.
- 1718:00 a.m. to 8:29 a.m.
- 1588:30 a.m. to 8:59 a.m.
- 3079:00 a.m. to 9:59 a.m.
- 11910:00 a.m. to 10:59 a.m.
- 511:00 a.m. to 11:59 a.m.
- 9712:00 p.m. to 3:59 p.m.
- 1044:00 p.m. to 11:59 p.m.

Occupations of males:
- Percentage of males in management occupations (except farmers):
Here: 3.8% city: 10.3%
- Percentage of males in business and financial operations occupations:
Here: 3.4% city: 4.5%
- Percentage of males in computer and mathematical occupations:
Here: 10.2% city: 9.0%
- Percentage of males in architecture and engineering occupations:
Here: 4.7% city: 7.8%
- Percentage of males in life, physical, and social science occupations:
Here: 14.7% city: 5.8%
- Percentage of males in education, training, and library occupations:
Here: 37.2% city: 19.2%
- Percentage of males in arts, design, entertainment, sports, and media occupations:
Here: 2.8% city: 2.4%
- Percentage of males in healthcare practitioners and technical occupations:
Here: 8.1% city: 6.9%
- Percentage of males in service occupations:
Here: 6.9% city: 8.2%
- Percentage of males in sales and office occupations:
Here: 5.0% city: 10.4%
- Percentage of males in construction, extraction, and maintenance occupations:
Here: 1.1% city: 1.9%
Occupations of females:
- Percentage of females in management occupations (except farmers):
Here: 9.9% city: 8.5%
- Percentage of females in business and financial operations occupations:
Here: 5.6% city: 5.3%
- Percentage of females in computer and mathematical occupations:
Here: 5.9% city: 3.2%
- Percentage of females in life, physical, and social science occupations:
Here: 7.9% city: 4.8%
- Percentage of females in education, training, and library occupations:
Here: 24.5% city: 20.2%
- Percentage of females in arts, design, entertainment, sports, and media occupations:
Here: 2.5% city: 4.6%
- Percentage of females in healthcare practitioners and technical occupations:
Here: 22.7% city: 11.9%
- Percentage of females in service occupations:
Here: 1.8% city: 15.5%
- Percentage of females in sales and office occupations:
Here: 10.4% city: 17.0%
- Percentage of females in construction, extraction, and maintenance occupations:
Here: 2.5% city: 0.1%
- Percentage of females in production occupations:
Here: 2.2% city: 1.0%
- Percentage of females in material moving occupations:
Here: 3.7% city: 1.0%
Percentage of people 16-64 in Armed Forces:
| Broadway Area: | 0.0% |
| Ann Arbor: | 0.2% |
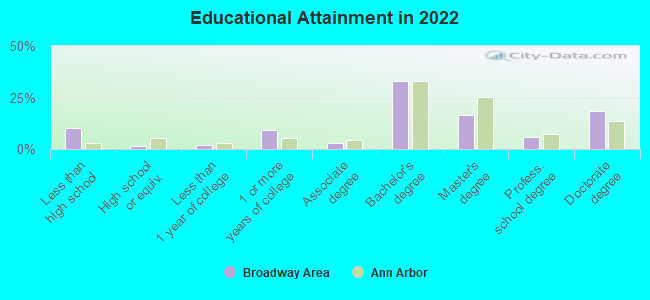
Education in this neighborhood (subdivision or community):
- Percentage of people 3 years and older in K-12 schools:
Broadway Area: 15.4% Ann Arbor: 8.7%
- Percentage of people 3 years and older in undergraduate colleges:
Broadway Area: 10.1% Ann Arbor: 25.6%
- Percentage of people 3 years and older in grad. or professional schools:
Broadway Area: 25.3% Ann Arbor: 10.8%
- Percentage of students K-12 enrolled in private schools:
Broadway Area: 13.7% Ann Arbor: 12.9%
Percentage of population below poverty level:
| Broadway Area: | 23.2% |
| Ann Arbor: | 23.1% |
Median year renter moved in (as recorded in 2022):
| Broadway Area: | 2018 |
| Ann Arbor: | 2022 |
Percentage of married-couple families with both working:
| Broadway Area: | 45.9% |
| Ann Arbor: | 72.2% |
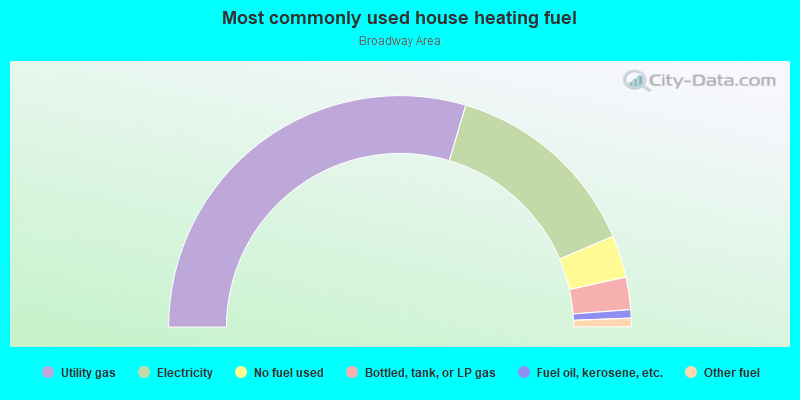
- 59.2%Utility gas
- 28.0%Electricity
- 5.9%No fuel used
- 4.5%Bottled, tank, or LP gas
- 1.2%Fuel oil, kerosene, etc.
- 1.2%Other fuel
Roads and streets:
Broadway St
Length: 1.20 miles
Directions: E-W, SW-NE
Address range: 1169 to 1771
Directions: E-W, SW-NE
Address range: 1169 to 1771
Broadview Ln
Length: 0.48 miles
Directions: E-W, N-S, SE-NW, SW-NE
Address range: 1600 to 1799
Directions: E-W, N-S, SE-NW, SW-NE
Address range: 1600 to 1799
Canal St
Length: 0.36 miles
Directions: E-W, N-S, SE-NW, SW-NE
Address range: 900 to 1089
Directions: E-W, N-S, SE-NW, SW-NE
Address range: 900 to 1089
Wall St
Length: 0.33 miles
Directions: E-W, SE-NW
Address range: 910 to 999
Directions: E-W, SE-NW
Address range: 910 to 999
Nielsen Ct
Length: 0.28 miles
Directions: E-W, SW-NE
Address range: 1100 to 1153
Directions: E-W, SW-NE
Address range: 1100 to 1153
Island Drive Ct
Length: 0.26 miles
Directions: N-S, SE-NW
Address range: 900 to 1299
Directions: N-S, SE-NW
Address range: 900 to 1299
Jones Dr
Length: 0.25 miles
Directions: N-S, SE-NW, SW-NE
Address range: 801 to 1213
Directions: N-S, SE-NW, SW-NE
Address range: 801 to 1213
Island Dr
Length: 0.19 miles
Directions: E-W, N-S, SE-NW, SW-NE
Address range: 1186 to 1406
Directions: E-W, N-S, SE-NW, SW-NE
Address range: 1186 to 1406
Maiden Lane Ct
Length: 0.17 miles
Direction: SW-NE
Address range: 1100 to 1199
Direction: SW-NE
Address range: 1100 to 1199
Harbal Dr
Length: 0.16 miles
Directions: N-S, SW-NE
Address range: 1600 to 1799
Directions: N-S, SW-NE
Address range: 1600 to 1799
Maiden Ln
Length: 0.15 miles
Directions: E-W, SE-NW
Address range: 966 to 1015
Directions: E-W, SE-NW
Address range: 966 to 1015
Leaird Dr
Length: 0.07 miles
Direction: SE-NW
Address range: 1600 to 1632
Direction: SE-NW
Address range: 1600 to 1632
Arbor Spring
Length: 0.03 miles
Direction: SE-NW
Direction: SE-NW
Other features:
Huron Riv
Length: 0.11 miles
Directions: E-W, SE-NW
Directions: E-W, SE-NW