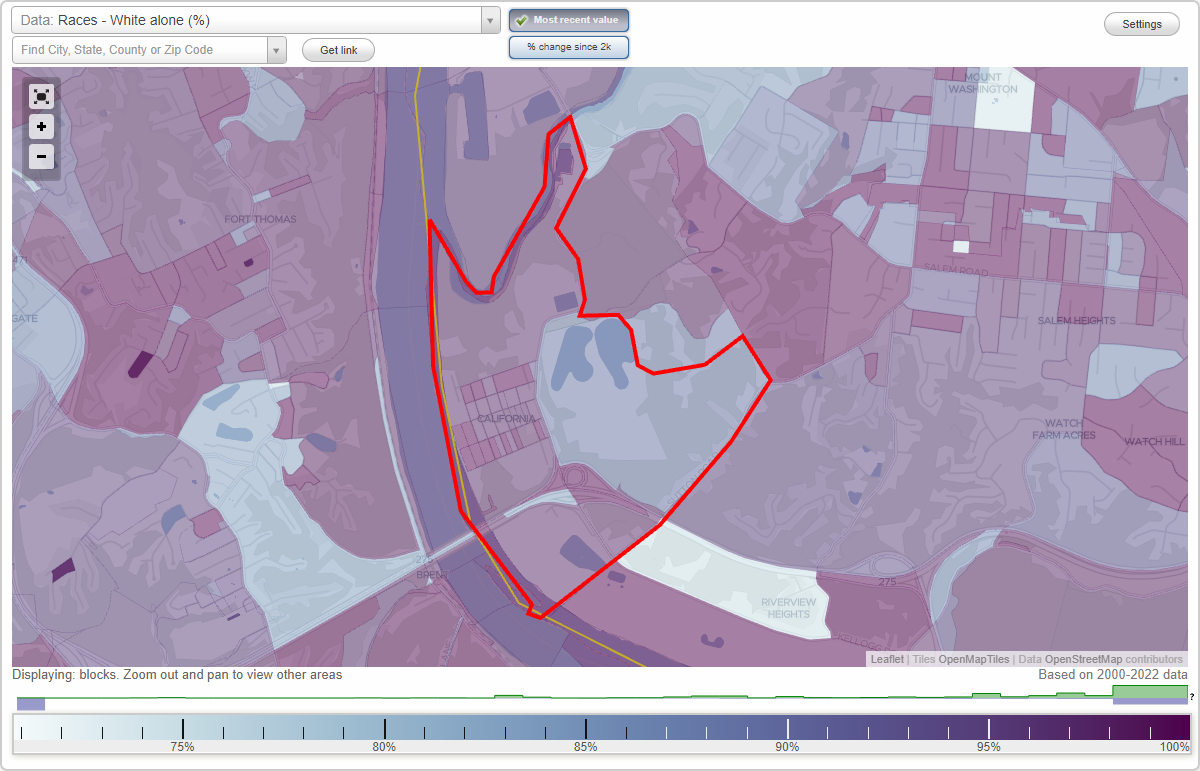
California neighborhood in Cincinnati, Ohio (OH), 45226, 45228 detailed profile
Settings
X

Business Search - 14 Million verified businesses
Area: 1.613 square miles
Population: 2,178
Population density:
| California: | 1,350 people per square mile |
| Cincinnati: | 3,970 people per square mile |

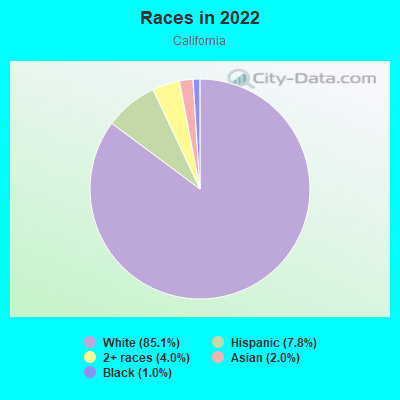
- 1,95285.1%White
- 1787.8%Hispanic or Latino
- 924.0%Two or more races
- 472.0%Asian
- 241.0%Black
Median household income in 2022:
| California: | $134,927 |
| Cincinnati: | $48,130 |
Distribution of median household income
![Distribution of median household income]()
- 8Less than $10,000
- 50$10,000 to $19,999
- 90$20,000 to $29,999
- 51$30,000 to $39,999
- 72$40,000 to $49,999
- 91$50,000 to $59,999
- 79$60,000 to $74,999
- 22$75,000 to $99,999
- 39$100,000 to $124,999
- 238$125,000 to $149,999
- 122$150,000 to $199,999
- 146$200,000 or more

Distribution of owner-occupied house/condo value
![Distribution of owner-occupied house/condo value]()
- 9Less than $50,000
- 54$50,000 to $99,999
- 111$100,000 to $149,999
- 352$150,000 to $199,999
- 122$200,000 to $249,999
- 134$250,000 to $299,999
- 91$300,000 to $399,999
- 135$400,000 to $499,999
- 77$500,000 to $749,999
- 24$750,000 to $999,999
- 7$1,000,000 or more

Distribution of rent paid by renters
![Distribution of rent paid by renters]()
- 53$600 to $699
- 8$700 to $799
- 91$800 to $899
- 27$1,000 to $1,249

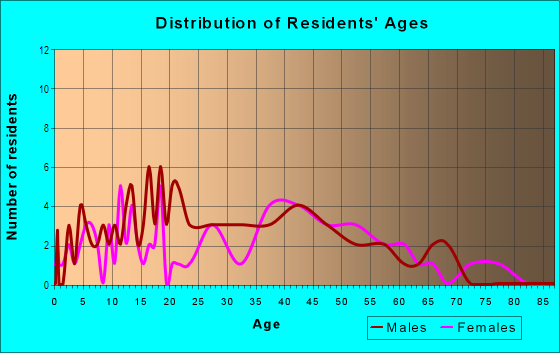
| Males: | 920 |
| Females: | 1,258 |
Males:
| This neighborhood: | 31.1 years |
| Whole city: | 32.7 years |
| This neighborhood: | 24.9 years |
| Whole city: | 34.2 years |
Average household size:
| California: | 3.4 people |
| Cincinnati: | 23.0 people |
Percentage of family households:
| California: | 69.7% |
| Cincinnati: | 33.3% |
| Here: | 53.8% |
| Cincinnati: | 23.1% |
Percentage of married-couple families with children (among all households):
| California: | 15.4% |
| Cincinnati: | 22.2% |
Percentage of single-mother households (among all households):
| California: | 10.9% |
| Cincinnati: | 22.0% |
Percentage of never married males 15 years old and over:
Percentage of never married females 15 years old and over:
| California: | 18.0% |
| Cincinnati: | 27.2% |
Percentage of never married females 15 years old and over:
| California: | 13.9% |
| city: | 29.6% |
Percentage of people that speak English not well or not at all:
| California: | 0.0% |
| Cincinnati: | 1.5% |
Percentage of people born in this state:
Percentage of people born in another U.S. state:
Percentage of native residents but born outside the U.S.:
Percentage of foreign born residents:
| Here: | 69.9% |
| Cincinnati: | 69.3% |
Percentage of people born in another U.S. state:
| California: | 26.6% |
| Cincinnati: | 23.5% |
Percentage of native residents but born outside the U.S.:
| Here: | 0.9% |
| city: | 1.0% |
Percentage of foreign born residents:
| Here: | 2.5% |
| Cincinnati: | 6.2% |
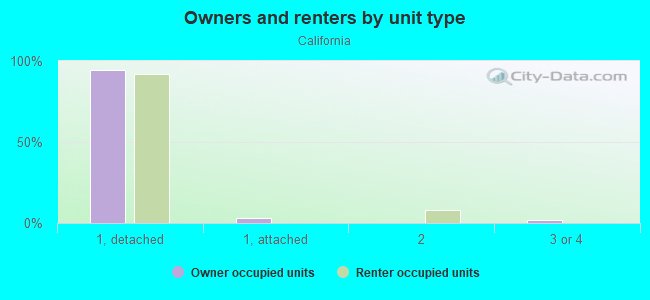
Owner-occupied
Renter-occupied

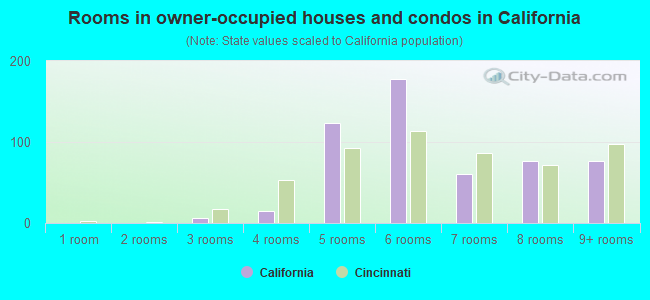
- Rooms in owner-occupied houses and condos in California
- 01 room
- 02 rooms
- 63 rooms
- 154 rooms
- 1235 rooms
- 1786 rooms
- 617 rooms
- 768 rooms
- 769+ rooms
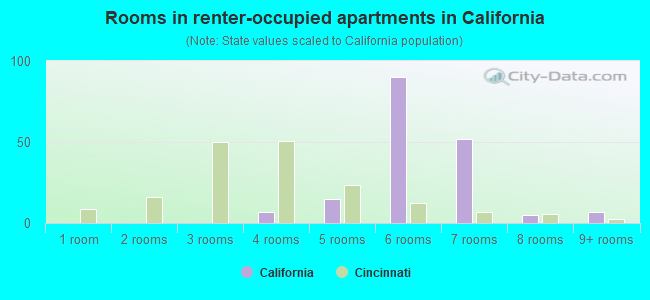
- Rooms in renter-occupied apartments in California
- 01 room
- 02 rooms
- 03 rooms
- 74 rooms
- 155 rooms
- 906 rooms
- 527 rooms
- 58 rooms
- 79+ rooms
Owner-occupied
Renter-occupied
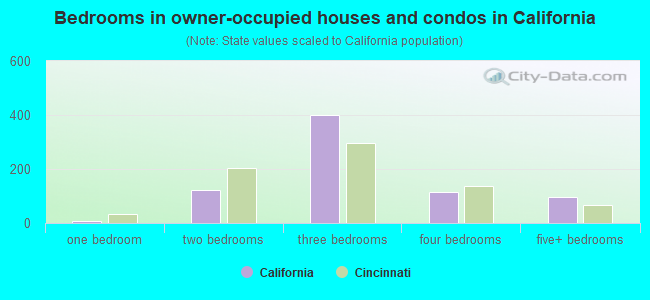
- Bedrooms in owner-occupied houses and condos in California
- 0no bedroom
- 71 bedroom
- 1222 bedrooms
- 4013 bedrooms
- 1144 bedrooms
- 955+ bedrooms
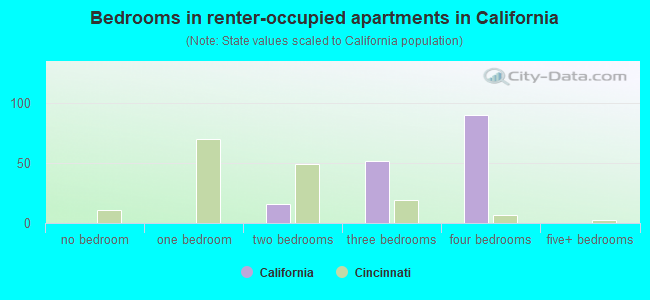
- Bedrooms in renter-occupied apartments in California
- 0no bedroom
- 01 bedroom
- 162 bedrooms
- 523 bedrooms
- 904 bedrooms
- 05+ bedrooms
Average number of cars or other vehicles available in houses/condos:
Average number of cars or other vehicles available in apartments:
| This neighborhood: | 5.0 |
| Cincinnati: | 1.9 |
Average number of cars or other vehicles available in apartments:
| Here: | 0.9 |
| city: | 1.0 |
Percentage of units with a mortgage:
| California: | 81.1% |
| Cincinnati: | 67.8% |
Average estimated value of detached houses in 2022 (100.0% of all units):
| California: | $250,973 |
| Ohio: | $254,366 |
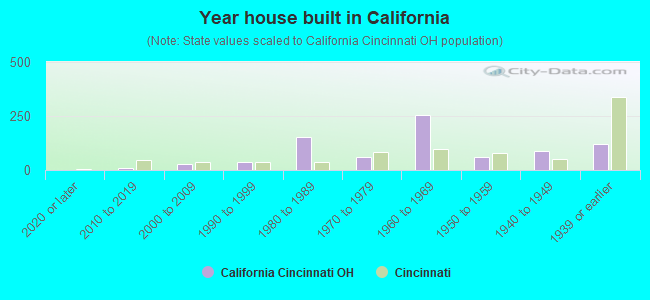
- Year house built in California
- 02020 or later
- 92010 to 2019
- 282000 to 2009
- 381990 to 1999
- 1521980 to 1989
- 611970 to 1979
- 2561960 to 1969
- 591950 to 1959
- 901940 to 1949
- 1191939 or earlier
City-data.com crime index for city in 2020 (higher means more crime):
| City: | 490.1 |
| U.S. average: | 219.5 |
Travel time to work (commute)
![Travel time to work (commute)]()
- 42Less than 5 minutes
- 795 to 9 minutes
- 16810 to 14 minutes
- 19015 to 19 minutes
- 27420 to 24 minutes
- 23125 to 29 minutes
- 22230 to 34 minutes
- 3035 to 39 minutes
- 9040 to 44 minutes
- 2145 to 59 minutes
- 1660 to 89 minutes
- 1190 or more minutes

Means of transportation to work
![Means of transportation to work]()
- 86.2%951Drove a car alone
- 4.4%49Carpooled
- 0.6%7Bus
- 2.2%24Walked
- 1.2%13Other means
- 9.2%102Worked at home

Time leaving home to go to work
![Time leaving home to go to work]()
- 3512:00 a.m. to 4:59 a.m.
- 455:00 a.m. to 5:29 a.m.
- 145:30 a.m. to 5:59 a.m.
- 896:00 a.m. to 6:29 a.m.
- 1616:30 a.m. to 6:59 a.m.
- 2077:00 a.m. to 7:29 a.m.
- 2357:30 a.m. to 7:59 a.m.
- 2078:00 a.m. to 8:29 a.m.
- 1428:30 a.m. to 8:59 a.m.
- 579:00 a.m. to 9:59 a.m.
- 5910:00 a.m. to 10:59 a.m.
- 1211:00 a.m. to 11:59 a.m.
- 7912:00 p.m. to 3:59 p.m.
- 954:00 p.m. to 11:59 p.m.

Occupations of males:
- Percentage of males in management occupations (except farmers):
Here: 13.1% city: 11.2%
- Percentage of males in business and financial operations occupations:
Here: 9.7% city: 7.3%
- Percentage of males in computer and mathematical occupations:
Here: 4.3% city: 5.4%
- Percentage of males in architecture and engineering occupations:
Here: 4.4% city: 4.8%
- Percentage of males in life, physical, and social science occupations:
Here: 8.3% city: 1.6%
- Percentage of males in community and social services occupations:
Here: 2.1% city: 1.8%
- Percentage of males in legal occupations:
Here: 6.2% city: 1.4%
- Percentage of males in education, training, and library occupations:
Here: 11.9% city: 4.4%
- Percentage of males in arts, design, entertainment, sports, and media occupations:
Here: 3.3% city: 2.9%
- Percentage of males in healthcare practitioners and technical occupations:
Here: 9.2% city: 3.6%
- Percentage of males in service occupations:
Here: 39.3% city: 14.1%
- Percentage of males in sales and office occupations:
Here: 8.3% city: 15.7%
- Percentage of males in construction, extraction, and maintenance occupations:
Here: 7.7% city: 4.4%
- Percentage of males in production occupations:
Here: 3.0% city: 6.1%
- Percentage of males in transportation occupations:
Here: 2.7% city: 4.4%
- Percentage of males in material moving occupations:
Here: 2.6% city: 8.4%
Occupations of females:
- Percentage of females in management occupations (except farmers):
Here: 16.9% city: 9.5%
- Percentage of females in business and financial operations occupations:
Here: 3.6% city: 6.1%
- Percentage of females in computer and mathematical occupations:
Here: 6.2% city: 2.1%
- Percentage of females in architecture and engineering occupations:
Here: 1.1% city: 0.9%
- Percentage of females in community and social services occupations:
Here: 1.1% city: 3.1%
- Percentage of females in legal occupations:
Here: 8.7% city: 1.3%
- Percentage of females in education, training, and library occupations:
Here: 7.8% city: 8.4%
- Percentage of females in arts, design, entertainment, sports, and media occupations:
Here: 2.3% city: 2.8%
- Percentage of females in healthcare practitioners and technical occupations:
Here: 33.1% city: 10.6%
- Percentage of females in service occupations:
Here: 26.9% city: 20.8%
- Percentage of females in sales and office occupations:
Here: 26.9% city: 23.8%
- Percentage of females in construction, extraction, and maintenance occupations:
Here: 1.3% city: 0.3%
- Percentage of females in production occupations:
Here: 2.1% city: 4.0%
- Percentage of females in transportation occupations:
Here: 1.1% city: 1.4%
- Percentage of females in material moving occupations:
Here: 3.3% city: 2.8%
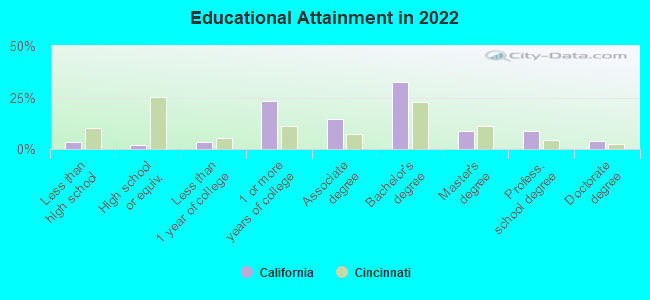
Education in this neighborhood (subdivision or community):
- Percentage of people 3 years and older in K-12 schools:
California: 36.4% Cincinnati: 15.0%
- Percentage of people 3 years and older in undergraduate colleges:
California: 1.6% Cincinnati: 10.0%
- Percentage of people 3 years and older in grad. or professional schools:
California: 2.0% Cincinnati: 3.0%
- Percentage of students K-12 enrolled in private schools:
California: 31.0% Cincinnati: 25.7%
Percentage of population below poverty level:
| California: | 7.2% |
| Cincinnati: | 26.6% |
Median year owner moved in (as recorded in 2022):
| California: | 2041 |
| Cincinnati: | 2011 |
Percentage of married-couple families with both working:
| California: | 135.3% |
| Cincinnati: | 77.0% |
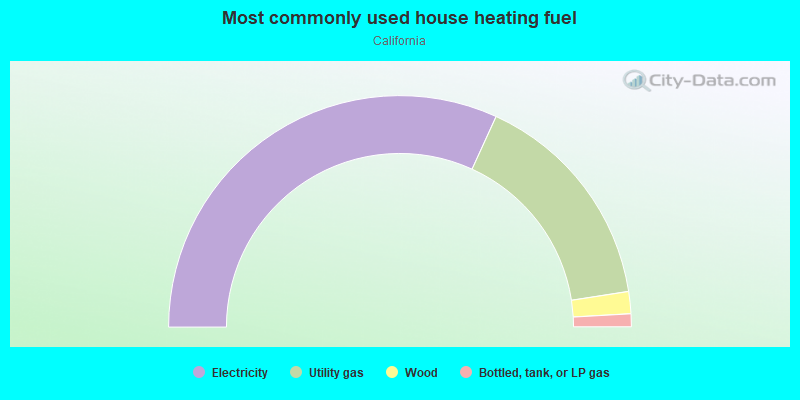
- 63.6%Electricity
- 31.4%Utility gas
- 3.1%Wood
- 1.8%Bottled, tank, or LP gas
Limited-access highways (interstate or state) in this neighborhood:
I- 275
Length: 1.08 miles
Directions: E-W, SW-NE
Directions: E-W, SW-NE
Highways in this neighborhood:
Kellogg Ave (US Hwy 52)
Length: 1.69 miles
Directions: E-W, N-S, SE-NW, SW-NE
Address range: 5300 to 6299
Directions: E-W, N-S, SE-NW, SW-NE
Address range: 5300 to 6299
Roads and streets:
Rohde Ave
Length: 0.52 miles
Direction: E-W
Address range: 1 to 199
Direction: E-W
Address range: 1 to 199
Eldorado Ave
Length: 0.51 miles
Direction: E-W
Address range: 1 to 199
Direction: E-W
Address range: 1 to 199
Waits Ave
Length: 0.51 miles
Directions: E-W, N-S, SW-NE
Address range: 2 to 199
Directions: E-W, N-S, SW-NE
Address range: 2 to 199
Renslar Ave
Length: 0.48 miles
Direction: E-W
Address range: 1 to 199
Direction: E-W
Address range: 1 to 199
Panama St
Length: 0.46 miles
Directions: N-S, SE-NW
Address range: 5700 to 5999
Directions: N-S, SE-NW
Address range: 5700 to 5999
Linneman St
Length: 0.46 miles
Directions: N-S, SE-NW
Address range: 5800 to 5999
Directions: N-S, SE-NW
Address range: 5800 to 5999
Kenwood Ave
Length: 0.44 miles
Direction: E-W
Address range: 1 to 199
Direction: E-W
Address range: 1 to 199
Berte St
Length: 0.38 miles
Directions: N-S, SE-NW
Address range: 5700 to 5999
Directions: N-S, SE-NW
Address range: 5700 to 5999
Bryson St
Length: 0.38 miles
Directions: N-S, SE-NW
Address range: 5700 to 5999
Directions: N-S, SE-NW
Address range: 5700 to 5999
Croslin St
Length: 0.37 miles
Directions: N-S, SE-NW
Address range: 5700 to 5999
Directions: N-S, SE-NW
Address range: 5700 to 5999
Sutton Rd
Length: 0.37 miles
Direction: SW-NE
Address range: 200 to 421
Direction: SW-NE
Address range: 200 to 421
Penn Ave
Length: 0.36 miles
Directions: E-W, SE-NW, SW-NE
Address range: 6000 to 6082
Directions: E-W, SE-NW, SW-NE
Address range: 6000 to 6082
Two Mile Rd
Length: 0.33 miles
Directions: E-W, N-S, SE-NW, SW-NE
Address range: 200 to 6072
Directions: E-W, N-S, SE-NW, SW-NE
Address range: 200 to 6072
Haney St
Length: 0.28 miles
Directions: N-S, SE-NW
Address range: 5700 to 5832
Directions: N-S, SE-NW
Address range: 5700 to 5832
Harbor St
Length: 0.23 miles
Direction: SE-NW
Address range: 1 to 5999
Direction: SE-NW
Address range: 1 to 5999
Lanter Ln
Length: 0.23 miles
Directions: E-W, N-S, SW-NE
Address range: 200 to 399
Directions: E-W, N-S, SW-NE
Address range: 200 to 399
Brownfield St
Length: 0.14 miles
Direction: E-W
Direction: E-W
Pomeroy St
Length: 0.13 miles
Directions: N-S, SE-NW
Address range: 101 to 5899
Directions: N-S, SE-NW
Address range: 101 to 5899
Parker Ln
Length: 0.13 miles
Direction: SE-NW
Address range: 5900 to 5999
Direction: SE-NW
Address range: 5900 to 5999
Valley Ford St
Length: 0.11 miles
Direction: SE-NW
Direction: SE-NW
Valley Ford Ln
Length: 0.11 miles
Direction: SE-NW
Address range: 5800 to 5999
Direction: SE-NW
Address range: 5800 to 5999
Kilgorran St
Length: 0.05 miles
Direction: E-W
Direction: E-W
Clover St
Length: 0.05 miles
Direction: SE-NW
Address range: 6001 to 6099
Direction: SE-NW
Address range: 6001 to 6099
Other features:
Threemile Crk
Length: 1.36 miles
Directions: E-W, N-S, SE-NW, SW-NE
Directions: E-W, N-S, SE-NW, SW-NE