Canterbury neighborhood in Farmington, Michigan (MI), 48331, 48334 detailed profile
Settings
X

Business Search - 14 Million verified businesses
Area: 0.297 square miles
Population: 470
Population density:
| Canterbury: | 1,580 people per square mile |
| Farmington: | 4,303 people per square mile |

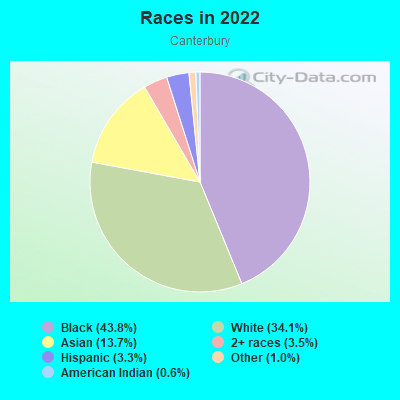
- 22443.8%Black
- 17434.1%White
- 7013.7%Asian
- 183.5%Two or more races
- 173.3%Hispanic or Latino
- 51.0%Some other race
- 30.6%American Indian
Median household income in 2022:
| Canterbury: | $121,062 |
| Farmington: | $92,128 |
Distribution of median household income
![Distribution of median household income]()
- 12Less than $10,000
- 6$10,000 to $19,999
- 24$20,000 to $29,999
- 22$30,000 to $39,999
- 36$40,000 to $49,999
- 19$50,000 to $59,999
- 17$60,000 to $74,999
- 35$75,000 to $99,999
- 34$100,000 to $124,999
- 18$125,000 to $149,999
- 13$150,000 to $199,999
- 29$200,000 or more

Distribution of owner-occupied house/condo value
![Distribution of owner-occupied house/condo value]()
- 21Less than $50,000
- 20$50,000 to $99,999
- 29$100,000 to $149,999
- 34$150,000 to $199,999
- 26$200,000 to $249,999
- 26$250,000 to $299,999
- 11$300,000 to $399,999
- 45$400,000 to $499,999
- 28$500,000 to $749,999
- 8$1,000,000 or more

Distribution of rent paid by renters
![Distribution of rent paid by renters]()
- 1$300 to $399
- 2$500 to $599
- 20$1,000 to $1,249
- 52$1,250 to $1,499
- 55$1,500 to $1,999
- 22$2,000 or more

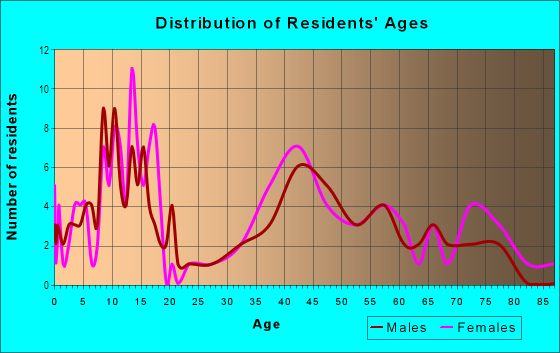
| Males: | 217 |
| Females: | 253 |
Males:
| This neighborhood: | 43.0 years |
| Whole city: | 35.3 years |
| This neighborhood: | 43.3 years |
| Whole city: | 42.4 years |
Average household size:
| Canterbury: | 11.6 people |
| Farmington: | 2.2 people |
Percentage of family households:
| Canterbury: | 32.9% |
| Farmington: | 41.0% |
| Here: | 26.3% |
| Farmington: | 45.5% |
Percentage of married-couple families with children (among all households):
| Canterbury: | 32.9% |
| Farmington: | 40.7% |
Percentage of single-mother households (among all households):
| Canterbury: | 17.2% |
| Farmington: | 4.2% |
Percentage of never married males 15 years old and over:
Percentage of never married females 15 years old and over:
| Canterbury: | 24.3% |
| Farmington: | 16.1% |
Percentage of never married females 15 years old and over:
| Canterbury: | 11.5% |
| city: | 15.2% |
Percentage of people that speak English not well or not at all:
| Canterbury: | 0.2% |
| Farmington: | 0.7% |
Percentage of people born in this state:
Percentage of people born in another U.S. state:
Percentage of native residents but born outside the U.S.:
Percentage of foreign born residents:
| Here: | 70.6% |
| Farmington: | 63.1% |
Percentage of people born in another U.S. state:
| Canterbury: | 16.1% |
| Farmington: | 16.3% |
Percentage of native residents but born outside the U.S.:
| Here: | 0.4% |
| city: | 0.8% |
Percentage of foreign born residents:
| Here: | 12.9% |
| Farmington: | 19.8% |
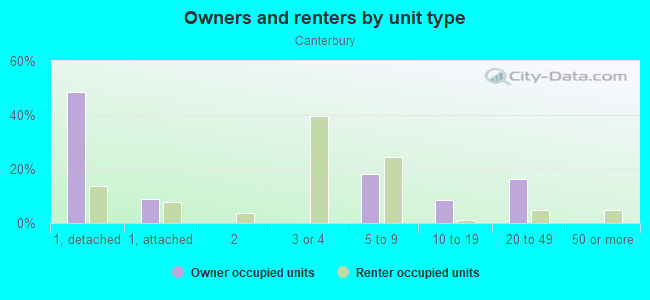
Owner-occupied
Renter-occupied

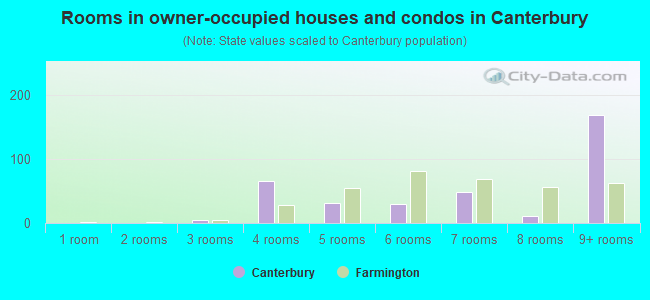
- Rooms in owner-occupied houses and condos in Canterbury
- 01 room
- 02 rooms
- 43 rooms
- 664 rooms
- 315 rooms
- 296 rooms
- 497 rooms
- 118 rooms
- 1699+ rooms
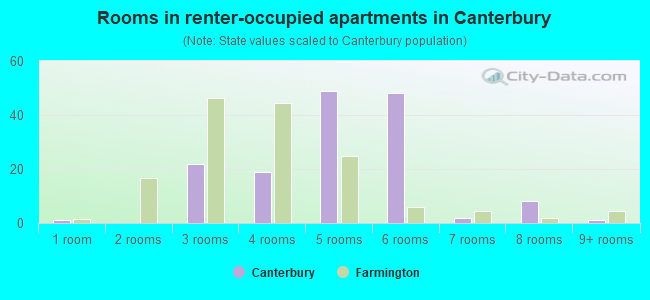
- Rooms in renter-occupied apartments in Canterbury
- 11 room
- 02 rooms
- 223 rooms
- 194 rooms
- 495 rooms
- 486 rooms
- 27 rooms
- 88 rooms
- 19+ rooms
Owner-occupied
Renter-occupied
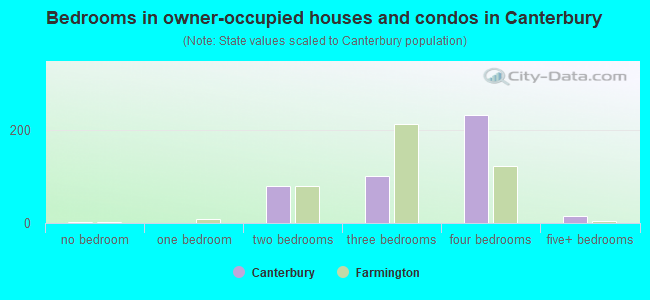
- Bedrooms in owner-occupied houses and condos in Canterbury
- 3no bedroom
- 01 bedroom
- 792 bedrooms
- 1023 bedrooms
- 2324 bedrooms
- 145+ bedrooms
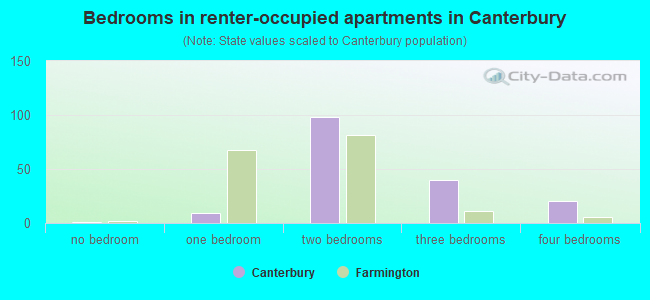
- Bedrooms in renter-occupied apartments in Canterbury
- 1no bedroom
- 91 bedroom
- 982 bedrooms
- 403 bedrooms
- 204 bedrooms
- 05+ bedrooms
Average number of cars or other vehicles available in houses/condos:
Average number of cars or other vehicles available in apartments:
| This neighborhood: | 1.1 |
| Farmington: | 1.9 |
Average number of cars or other vehicles available in apartments:
| Here: | |
| city: |
Percentage of units with a mortgage:
| Canterbury: | 86.7% |
| Farmington: | 63.7% |
Average estimated value of detached houses in 2022 (14.8% of all units):
| Canterbury: | $382,022 |
| Farmington: | $284,023 |
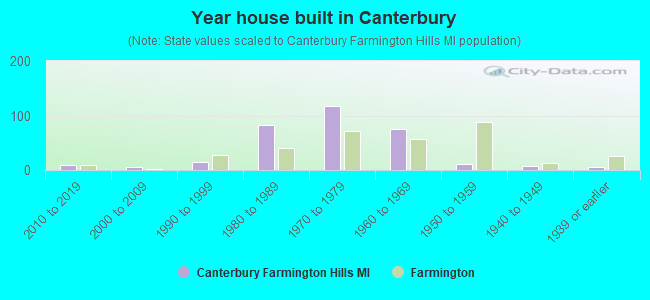
- Year house built in Canterbury
- 02020 or later
- 92010 to 2019
- 62000 to 2009
- 141990 to 1999
- 831980 to 1989
- 1171970 to 1979
- 761960 to 1969
- 111950 to 1959
- 81940 to 1949
- 51939 or earlier
City-data.com crime index for city in 2020 (higher means more crime):
| City: | 33.2 |
| U.S. average: | 219.5 |
Travel time to work (commute)
![Travel time to work (commute)]()
- 4Less than 5 minutes
- 65 to 9 minutes
- 2710 to 14 minutes
- 3615 to 19 minutes
- 3520 to 24 minutes
- 1725 to 29 minutes
- 7230 to 34 minutes
- 1735 to 39 minutes
- 640 to 44 minutes
- 1045 to 59 minutes
- 460 to 89 minutes
- 490 or more minutes

Means of transportation to work
![Means of transportation to work]()
- 94.3%194Drove a car alone
- 6.8%14Carpooled
- 2.9%6Walked
- 2.4%5Other means
- 64.2%132Worked at home

Time leaving home to go to work
![Time leaving home to go to work]()
- 712:00 a.m. to 4:59 a.m.
- 125:00 a.m. to 5:29 a.m.
- 45:30 a.m. to 5:59 a.m.
- 86:00 a.m. to 6:29 a.m.
- 216:30 a.m. to 6:59 a.m.
- 387:00 a.m. to 7:29 a.m.
- 517:30 a.m. to 7:59 a.m.
- 508:00 a.m. to 8:29 a.m.
- 138:30 a.m. to 8:59 a.m.
- 309:00 a.m. to 9:59 a.m.
- 1210:00 a.m. to 10:59 a.m.
- 811:00 a.m. to 11:59 a.m.
- 612:00 p.m. to 3:59 p.m.
- 64:00 p.m. to 11:59 p.m.

Occupations of males:
- Percentage of males in management occupations (except farmers):
Here: 14.3% city: 10.6%
- Percentage of males in business and financial operations occupations:
Here: 5.3% city: 8.7%
- Percentage of males in community and social services occupations:
Here: 10.3% city: 3.3%
- Percentage of males in legal occupations:
Here: 13.7% city: 0.3%
- Percentage of males in healthcare practitioners and technical occupations:
Here: 2.8% city: 2.6%
- Percentage of males in service occupations:
Here: 6.3% city: 5.6%
- Percentage of males in sales and office occupations:
Here: 17.8% city: 14.6%
- Percentage of males in construction, extraction, and maintenance occupations:
Here: 19.4% city: 4.2%
- Percentage of males in material moving occupations:
Here: 8.4% city: 0.9%
Occupations of females:
- Percentage of females in management occupations (except farmers):
Here: 1.1% city: 9.9%
- Percentage of females in business and financial operations occupations:
Here: 45.4% city: 8.6%
- Percentage of females in computer and mathematical occupations:
Here: 13.5% city: 4.4%
- Percentage of females in architecture and engineering occupations:
Here: 8.6% city: 3.2%
- Percentage of females in education, training, and library occupations:
Here: 6.0% city: 7.1%
- Percentage of females in arts, design, entertainment, sports, and media occupations:
Here: 10.7% city: 2.1%
- Percentage of females in sales and office occupations:
Here: 12.6% city: 24.6%
- Percentage of females in construction, extraction, and maintenance occupations:
Here: 1.7% city: 0.0%
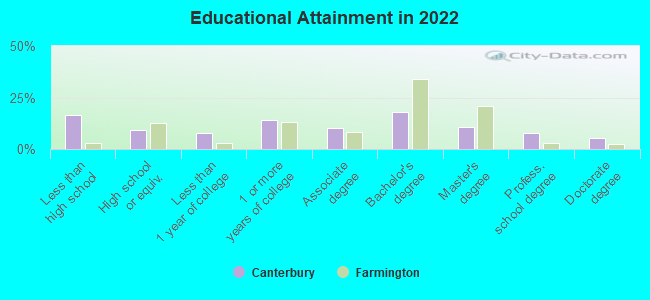
Education in this neighborhood (subdivision or community):
- Percentage of people 3 years and older in K-12 schools:
Canterbury: 21.2% Farmington: 12.2%
- Percentage of people 3 years and older in undergraduate colleges:
Canterbury: 7.7% Farmington: 4.3%
- Percentage of people 3 years and older in grad. or professional schools:
Canterbury: 9.9% Farmington: 1.0%
- Percentage of students K-12 enrolled in private schools:
Canterbury: 67.0% Farmington: 17.8%
Percentage of population below poverty level:
| Canterbury: | 6.0% |
| Farmington: | 4.9% |
Median year owner moved in (as recorded in 2022):
| Canterbury: | 2005 |
| Farmington: | 2010 |
Percentage of married-couple families with both working:
| Canterbury: | 101.1% |
| Farmington: | 61.1% |
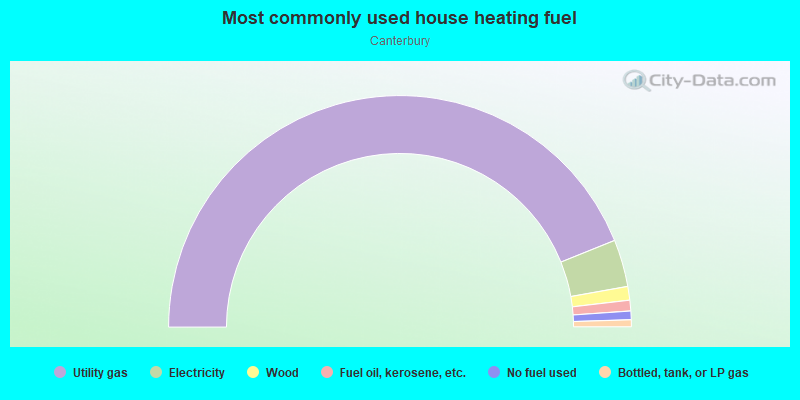
- 87.8%Utility gas
- 6.6%Electricity
- 1.9%Wood
- 1.5%Fuel oil, kerosene, etc.
- 1.2%No fuel used
- 1.0%Bottled, tank, or LP gas
Roads and streets:
Fox Grove Rd
Length: 0.80 miles
Directions: E-W, N-S, SE-NW, SW-NE
Address range: 29500 to 30199
Directions: E-W, N-S, SE-NW, SW-NE
Address range: 29500 to 30199
Farmington Rd
Length: 0.54 miles
Direction: N-S
Address range: 29500 to 30249
Direction: N-S
Address range: 29500 to 30249
W 13 Mile Rd
Length: 0.46 miles
Direction: E-W
Address range: 32600 to 33399
Direction: E-W
Address range: 32600 to 33399
Walnut Ln
Length: 0.40 miles
Directions: E-W, N-S, SE-NW, SW-NE
Address range: 33000 to 33399
Directions: E-W, N-S, SE-NW, SW-NE
Address range: 33000 to 33399
Fernhill Dr
Length: 0.39 miles
Directions: N-S, SE-NW
Address range: 29600 to 30179
Directions: N-S, SE-NW
Address range: 29600 to 30179
Oak Hollow St
Length: 0.32 miles
Directions: E-W, SW-NE
Address range: 32900 to 33262
Directions: E-W, SW-NE
Address range: 32900 to 33262
Valley Side Dr
Length: 0.30 miles
Directions: E-W, N-S, SE-NW
Address range: 29900 to 30199
Directions: E-W, N-S, SE-NW
Address range: 29900 to 30199
Colony Circle Dr
Length: 0.27 miles
Directions: E-W, N-S, SE-NW, SW-NE
Address range: 29501 to 29799
Directions: E-W, N-S, SE-NW, SW-NE
Address range: 29501 to 29799
Hargrove Ct
Length: 0.15 miles
Directions: E-W, N-S, SE-NW, SW-NE
Address range: 32900 to 32999
Directions: E-W, N-S, SE-NW, SW-NE
Address range: 32900 to 32999
Thorndyke Ct
Length: 0.11 miles
Directions: E-W, SE-NW
Address range: 32900 to 32999
Directions: E-W, SE-NW
Address range: 32900 to 32999
Fox Grove Ct
Length: 0.06 miles
Direction: E-W
Address range: 29900 to 30099
Direction: E-W
Address range: 29900 to 30099