Maywood Park neighborhood in Portland, Oregon (OR), 97220 detailed profile
Settings
X


Business Search - 14 Million verified businesses
Area: 0.156 square miles
Population: 633
Population density:
| Maywood Park: | 4,047 people per square mile |
| Portland: | 4,730 people per square mile |

- 49476.0%White
- 619.4%Black
- 517.8%Hispanic or Latino
- 182.8%American Indian
- 162.5%Asian
- 81.2%Two or more races
- 10.2%Native Hawaiian and Other
Pacific Islander - 10.2%Some other race

Median household income in 2022:
| Maywood Park: | $64,031 |
| Portland: | $81,119 |
Distribution of median household income
![Distribution of median household income]()
- 22Less than $10,000
- 16$10,000 to $19,999
- 7$20,000 to $29,999
- 13$30,000 to $39,999
- 12$40,000 to $49,999
- 6$50,000 to $59,999
- 7$60,000 to $74,999
- 23$75,000 to $99,999
- 35$100,000 to $124,999
- 22$125,000 to $149,999
- 26$150,000 to $199,999
- 50$200,000 or more

Distribution of owner-occupied house/condo value
![Distribution of owner-occupied house/condo value]()
- 10Less than $50,000
- 10$100,000 to $149,999
- 10$150,000 to $199,999
- 3$200,000 to $249,999
- 5$250,000 to $299,999
- 31$300,000 to $399,999
- 63$400,000 to $499,999
- 88$500,000 to $749,999
- 13$1,000,000 or more

Distribution of rent paid by renters
![Distribution of rent paid by renters]()
- 13$100 to $199
- 2$200 to $299
- 1$400 to $499
- 6$500 to $599
- 11$700 to $799
- 7$800 to $899
- 2$900 to $999
- 15$1,000 to $1,249
- 7$1,250 to $1,499
- 3$1,500 to $1,999
- 2$2,000 or more

Median rent in 2022:
| Maywood Park: | $1,208 |
| Portland: | $1,369 |
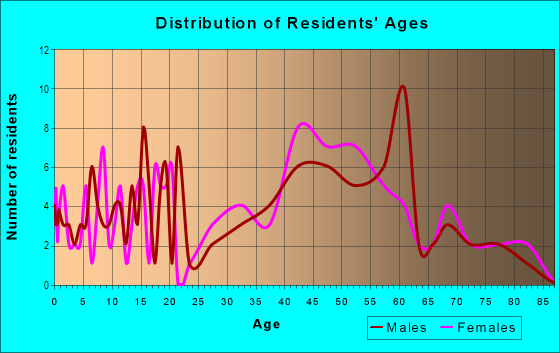
| Males: | 293 |
| Females: | 339 |
Males:
| This neighborhood: | 36.4 years |
| Whole city: | 38.3 years |
| This neighborhood: | 46.3 years |
| Whole city: | 38.6 years |
Average household size:
| Maywood Park: | 2.4 people |
| Portland: | 2.2 people |
Percentage of family households:
| Maywood Park: | 49.9% |
| Portland: | 35.3% |
| Here: | 57.7% |
| Portland: | 33.5% |
Percentage of married-couple families with children (among all households):
| Maywood Park: | 26.2% |
| Portland: | 31.0% |
Percentage of single-mother households (among all households):
| Maywood Park: | 9.6% |
| Portland: | 9.4% |
Percentage of never married males 15 years old and over:
Percentage of never married females 15 years old and over:
| Maywood Park: | 18.2% |
| Portland: | 24.3% |
Percentage of never married females 15 years old and over:
| Maywood Park: | 13.7% |
| city: | 20.5% |
Percentage of people that speak English not well or not at all:
| Maywood Park: | 0.5% |
| Portland: | 3.6% |
Percentage of people born in this state:
Percentage of people born in another U.S. state:
Percentage of native residents but born outside the U.S.:
Percentage of foreign born residents:
| Here: | 36.4% |
| Portland: | 38.1% |
Percentage of people born in another U.S. state:
| Maywood Park: | 47.3% |
| Portland: | 48.2% |
Percentage of native residents but born outside the U.S.:
| Here: | 0.6% |
| city: | 1.5% |
Percentage of foreign born residents:
| Here: | 15.7% |
| Portland: | 12.2% |
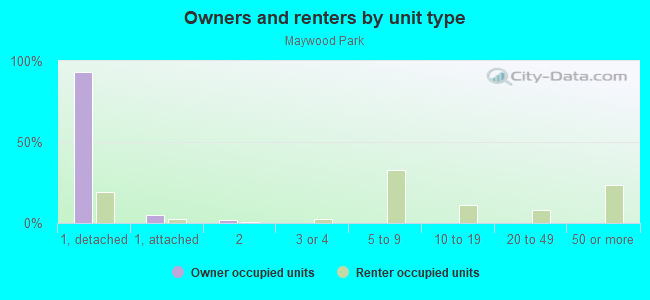
Owner-occupied
Renter-occupied

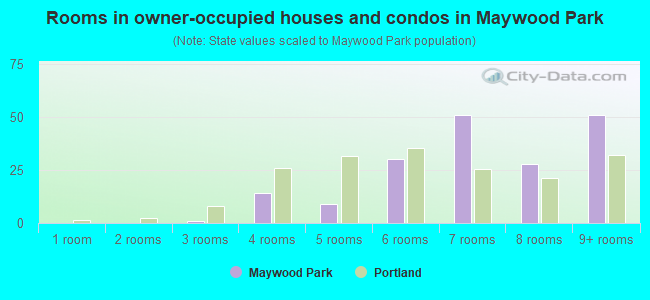
- Rooms in owner-occupied houses and condos in Maywood Park
- 01 room
- 02 rooms
- 13 rooms
- 144 rooms
- 95 rooms
- 306 rooms
- 517 rooms
- 288 rooms
- 519+ rooms
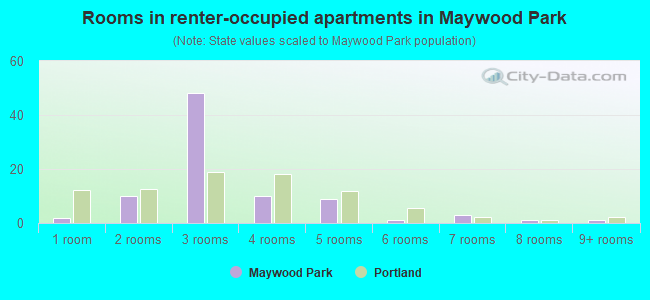
- Rooms in renter-occupied apartments in Maywood Park
- 21 room
- 102 rooms
- 483 rooms
- 104 rooms
- 95 rooms
- 16 rooms
- 37 rooms
- 18 rooms
- 19+ rooms
Owner-occupied
Renter-occupied
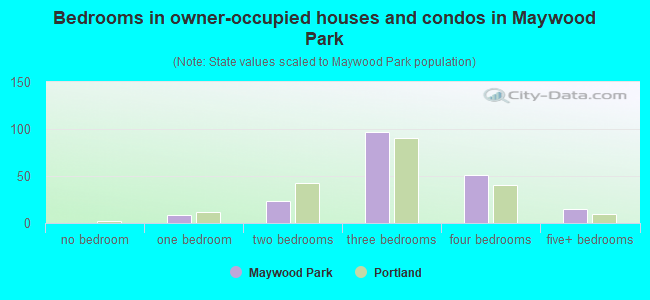
- Bedrooms in owner-occupied houses and condos in Maywood Park
- 0no bedroom
- 91 bedroom
- 232 bedrooms
- 973 bedrooms
- 514 bedrooms
- 155+ bedrooms
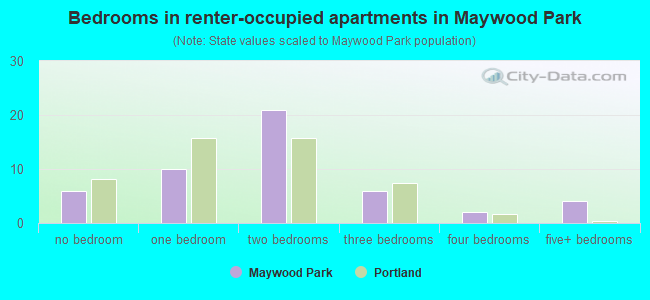
- Bedrooms in renter-occupied apartments in Maywood Park
- 6no bedroom
- 101 bedroom
- 212 bedrooms
- 63 bedrooms
- 24 bedrooms
- 45+ bedrooms
Average number of cars or other vehicles available in houses/condos:
Average number of cars or other vehicles available in apartments:
| This neighborhood: | 2.2 |
| Portland: | 1.8 |
Average number of cars or other vehicles available in apartments:
| Here: | 1.4 |
| city: | 1.1 |
Percentage of units with a mortgage:
| Maywood Park: | 78.0% |
| Portland: | 73.0% |
Average estimated value of detached houses in 2022 (86.7% of all units):
| Maywood Park: | $624,135 |
| Portland: | $616,638 |

- Year house built in Maywood Park
- 52020 or later
- 12010 to 2019
- 222000 to 2009
- 51990 to 1999
- 11980 to 1989
- 31970 to 1979
- 161960 to 1969
- 181950 to 1959
- 991940 to 1949
- 811939 or earlier
City-data.com crime index for city in 2020 (higher means more crime):
| City: | 399.8 |
| U.S. average: | 219.5 |
Travel time to work (commute)
![Travel time to work (commute)]()
- 11Less than 5 minutes
- 195 to 9 minutes
- 3410 to 14 minutes
- 3215 to 19 minutes
- 4120 to 24 minutes
- 3425 to 29 minutes
- 1730 to 34 minutes
- 835 to 39 minutes
- 840 to 44 minutes
- 745 to 59 minutes
- 760 to 89 minutes
- 290 or more minutes

Means of transportation to work
![Means of transportation to work]()
- 67.8%202Drove a car alone
- 3.7%11Carpooled
- 2.7%8Bus
- 0.7%2Subway or elevated rail
- 3.0%9Bicycle
- 2.0%6Walked
- 0.3%1Other means
- 17.8%53Worked at home

Time leaving home to go to work
![Time leaving home to go to work]()
- 2012:00 a.m. to 4:59 a.m.
- 25:00 a.m. to 5:29 a.m.
- 75:30 a.m. to 5:59 a.m.
- 176:00 a.m. to 6:29 a.m.
- 136:30 a.m. to 6:59 a.m.
- 297:00 a.m. to 7:29 a.m.
- 277:30 a.m. to 7:59 a.m.
- 228:00 a.m. to 8:29 a.m.
- 168:30 a.m. to 8:59 a.m.
- 169:00 a.m. to 9:59 a.m.
- 410:00 a.m. to 10:59 a.m.
- 511:00 a.m. to 11:59 a.m.
- 3012:00 p.m. to 3:59 p.m.
- 114:00 p.m. to 11:59 p.m.

Occupations of males:
- Percentage of males in management occupations (except farmers):
Here: 21.4% city: 13.5%
- Percentage of males in business and financial operations occupations:
Here: 2.8% city: 6.8%
- Percentage of males in computer and mathematical occupations:
Here: 5.4% city: 7.2%
- Percentage of males in architecture and engineering occupations:
Here: 4.7% city: 5.0%
- Percentage of males in community and social services occupations:
Here: 1.3% city: 1.6%
- Percentage of males in legal occupations:
Here: 3.4% city: 1.8%
- Percentage of males in education, training, and library occupations:
Here: 7.3% city: 3.6%
- Percentage of males in arts, design, entertainment, sports, and media occupations:
Here: 2.3% city: 5.2%
- Percentage of males in healthcare practitioners and technical occupations:
Here: 1.6% city: 4.4%
- Percentage of males in service occupations:
Here: 6.1% city: 11.9%
- Percentage of males in sales and office occupations:
Here: 12.3% city: 14.7%
- Percentage of males in construction, extraction, and maintenance occupations:
Here: 3.1% city: 5.2%
- Percentage of males in production occupations:
Here: 9.2% city: 5.5%
- Percentage of males in transportation occupations:
Here: 7.5% city: 4.3%
- Percentage of males in material moving occupations:
Here: 4.4% city: 4.0%
Occupations of females:
- Percentage of females in management occupations (except farmers):
Here: 7.7% city: 12.8%
- Percentage of females in business and financial operations occupations:
Here: 8.5% city: 8.1%
- Percentage of females in computer and mathematical occupations:
Here: 2.3% city: 2.5%
- Percentage of females in community and social services occupations:
Here: 2.3% city: 3.4%
- Percentage of females in education, training, and library occupations:
Here: 4.7% city: 8.4%
- Percentage of females in arts, design, entertainment, sports, and media occupations:
Here: 1.0% city: 5.1%
- Percentage of females in healthcare practitioners and technical occupations:
Here: 23.8% city: 10.3%
- Percentage of females in service occupations:
Here: 20.5% city: 17.8%
- Percentage of females in sales and office occupations:
Here: 22.9% city: 20.0%
- Percentage of females in production occupations:
Here: 3.6% city: 2.3%
- Percentage of females in transportation occupations:
Here: 1.0% city: 1.0%
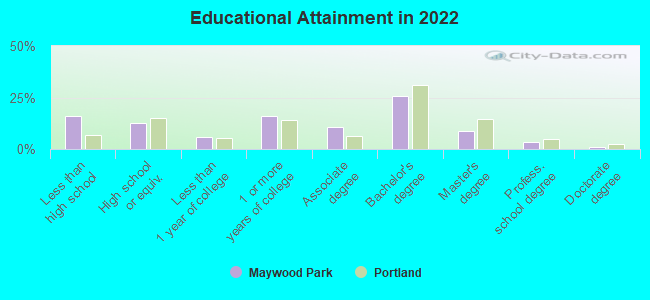
Education in this neighborhood (subdivision or community):
- Percentage of people 3 years and older in K-12 schools:
Maywood Park: 15.5% Portland: 12.2%
- Percentage of people 3 years and older in undergraduate colleges:
Maywood Park: 3.1% Portland: 4.8%
- Percentage of people 3 years and older in grad. or professional schools:
Maywood Park: 3.1% Portland: 2.0%
- Percentage of students K-12 enrolled in private schools:
Maywood Park: 10.6% Portland: 12.7%
Percentage of population below poverty level:
| Maywood Park: | 20.3% |
| Portland: | 12.7% |
Median year owner moved in (as recorded in 2022):
Median year renter moved in (as recorded in 2022):
| Maywood Park: | 2009 |
| Portland: | 2012 |
Median year renter moved in (as recorded in 2022):
| Maywood Park: | 2015 |
| Portland: | 2020 |
Percentage of married-couple families with both working:
| Maywood Park: | 90.5% |
| Portland: | 78.7% |

- 46.1%Electricity
- 45.7%Utility gas
- 3.2%Fuel oil, kerosene, etc.
- 2.2%No fuel used
- 1.5%Wood
- 0.9%Bottled, tank, or LP gas
Roads and streets:
NE Maywood Pl
Length: 0.67 miles
Directions: E-W, SE-NW
Address range: 3500 to 4399
Directions: E-W, SE-NW
Address range: 3500 to 4399
NE Campaign St
Length: 0.55 miles
Direction: E-W
Address range: 9400 to 10199
Direction: E-W
Address range: 9400 to 10199
NE Skidmore St
Length: 0.51 miles
Direction: E-W
Address range: 9500 to 10199
Direction: E-W
Address range: 9500 to 10199
NE Mason St
Length: 0.44 miles
Directions: E-W, SW-NE
Address range: 9550 to 10199
Directions: E-W, SW-NE
Address range: 9550 to 10199
NE 102nd Ave
Length: 0.42 miles
Direction: N-S
Address range: 3500 to 4399
Direction: N-S
Address range: 3500 to 4399
NE Shaver St
Length: 0.38 miles
Direction: E-W
Address range: 9700 to 10199
Direction: E-W
Address range: 9700 to 10199
NE Failing St
Length: 0.27 miles
Directions: E-W, SW-NE
Address range: 9800 to 10199
Directions: E-W, SW-NE
Address range: 9800 to 10199
NE Alton St
Length: 0.24 miles
Direction: E-W
Address range: 9900 to 10199
Direction: E-W
Address range: 9900 to 10199
NE 99th Ave
Length: 0.23 miles
Direction: N-S
Address range: 3900 to 4399
Direction: N-S
Address range: 3900 to 4399
NE Beech St
Length: 0.17 miles
Direction: E-W
Address range: 10000 to 10199
Direction: E-W
Address range: 10000 to 10199
NE 96th Ave
Length: 0.12 miles
Direction: N-S
Address range: 4100 to 4399
Direction: N-S
Address range: 4100 to 4399
NE Fremont St
Length: 0.02 miles
Direction: E-W
Address range: 10150 to 10199
Direction: E-W
Address range: 10150 to 10199