Woodgate Commons neighborhood in Laconia, New Hampshire (NH), 03246 detailed profile
Settings
X


Business Search - 14 Million verified businesses
Area: 0.384 square miles
Population: 224
Population density:
| Woodgate Commons: | 584 people per square mile |
| Laconia: | 833 people per square mile |

- 22494.1%White
- 114.6%Black
- 20.8%Hispanic or Latino
- 10.4%Some other race

Median household income in 2022:
| Woodgate Commons: | $85,166 |
| Laconia: | $67,856 |
Distribution of median household income
![Distribution of median household income]()
- 17Less than $10,000
- 12$10,000 to $19,999
- 2$20,000 to $29,999
- 8$30,000 to $39,999
- 4$40,000 to $49,999
- 2$50,000 to $59,999
- 9$60,000 to $74,999
- 19$75,000 to $99,999
- 12$100,000 to $124,999
- 36$125,000 to $149,999
- 7$150,000 to $199,999
- 16$200,000 or more

Distribution of owner-occupied house/condo value
![Distribution of owner-occupied house/condo value]()
- 8Less than $50,000
- 3$50,000 to $99,999
- 2$100,000 to $149,999
- 5$150,000 to $199,999
- 13$200,000 to $249,999
- 6$250,000 to $299,999
- 29$300,000 to $399,999
- 16$400,000 to $499,999
- 3$500,000 to $749,999
- 5$750,000 to $999,999
- 3$1,000,000 or more

Distribution of rent paid by renters
![Distribution of rent paid by renters]()
- 1$100 to $199
- 1$200 to $299
- 2$300 to $399
- 2$500 to $599
- 11$600 to $699
- 4$700 to $799
- 15$800 to $899
- 3$900 to $999
- 5$1,000 to $1,249
- 23$1,250 to $1,499
- 3$1,500 to $1,999
- 1$2,000 or more

Median rent in 2022:
| Woodgate Commons: | $920 |
| Laconia: | $1,003 |
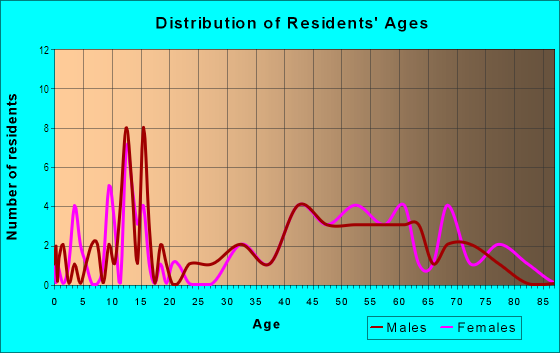
| Males: | 137 |
| Females: | 87 |
Males:
| This neighborhood: | 59.4 years |
| Whole city: | 42.9 years |
| This neighborhood: | 43.0 years |
| Whole city: | 44.7 years |
Average household size:
| Woodgate Commons: | 2.1 people |
| Laconia: | 2.4 people |
Percentage of family households:
| Woodgate Commons: | 28.1% |
| Laconia: | 38.7% |
| Here: | 57.6% |
| Laconia: | 40.0% |
Percentage of married-couple families with children (among all households):
| Woodgate Commons: | 57.2% |
| Laconia: | 22.9% |
Percentage of single-mother households (among all households):
| Woodgate Commons: | 70.6% |
| Laconia: | 15.1% |
Percentage of never married males 15 years old and over:
Percentage of never married females 15 years old and over:
| Woodgate Commons: | 10.7% |
| Laconia: | 17.1% |
Percentage of never married females 15 years old and over:
| Woodgate Commons: | 3.0% |
| city: | 14.3% |
Percentage of people that speak English not well or not at all:
| Woodgate Commons: | 0.0% |
| Laconia: | 0.3% |
Percentage of people born in this state:
Percentage of people born in another U.S. state:
Percentage of native residents but born outside the U.S.:
Percentage of foreign born residents:
| Here: | 48.5% |
| Laconia: | 54.2% |
Percentage of people born in another U.S. state:
| Woodgate Commons: | 45.7% |
| Laconia: | 41.4% |
Percentage of native residents but born outside the U.S.:
| Here: | 1.5% |
| city: | 0.9% |
Percentage of foreign born residents:
| Here: | 4.3% |
| Laconia: | 3.5% |

Owner-occupied
Renter-occupied


- Rooms in owner-occupied houses and condos in Woodgate Commons
- 01 room
- 02 rooms
- 03 rooms
- 34 rooms
- 55 rooms
- 156 rooms
- 277 rooms
- 128 rooms
- 129+ rooms

- Rooms in renter-occupied apartments in Woodgate Commons
- 141 room
- 22 rooms
- 13 rooms
- 114 rooms
- 15 rooms
- 86 rooms
- 157 rooms
- 18 rooms
- 09+ rooms
Owner-occupied
Renter-occupied

- Bedrooms in owner-occupied houses and condos in Woodgate Commons
- 0no bedroom
- 11 bedroom
- 52 bedrooms
- 393 bedrooms
- 274 bedrooms
- 25+ bedrooms

- Bedrooms in renter-occupied apartments in Woodgate Commons
- 14no bedroom
- 21 bedroom
- 192 bedrooms
- 143 bedrooms
- 14 bedrooms
- 05+ bedrooms
Average number of cars or other vehicles available in houses/condos:
Average number of cars or other vehicles available in apartments:
| This neighborhood: | 2.1 |
| Laconia: | 2.0 |
Average number of cars or other vehicles available in apartments:
| Here: | 1.2 |
| city: | 1.2 |
Percentage of units with a mortgage:
| Woodgate Commons: | 64.5% |
| Laconia: | 62.7% |
Average estimated value of detached houses in 2022 (47.2% of all units):
| Woodgate Commons: | $1,027,280 |
| Laconia: | $400,455 |

- Year house built in Woodgate Commons
- 02020 or later
- 192010 to 2019
- 212000 to 2009
- 81990 to 1999
- 241980 to 1989
- 141970 to 1979
- 81960 to 1969
- 221950 to 1959
- 11940 to 1949
- 411939 or earlier

City-data.com crime index for city in 2020 (higher means more crime):
| City: | 189.7 |
| U.S. average: | 219.5 |
Travel time to work (commute)
![Travel time to work (commute)]()
- 15Less than 5 minutes
- 165 to 9 minutes
- 3310 to 14 minutes
- 1815 to 19 minutes
- 920 to 24 minutes
- 425 to 29 minutes
- 630 to 34 minutes
- 435 to 39 minutes
- 340 to 44 minutes
- 545 to 59 minutes
- 660 to 89 minutes

Means of transportation to work
![Means of transportation to work]()
- 71.5%92Drove a car alone
- 8.5%11Carpooled
- 1.6%2Bicycle
- 7.0%9Walked
- 10.9%14Worked at home

Time leaving home to go to work
![Time leaving home to go to work]()
- 112:00 a.m. to 4:59 a.m.
- 25:00 a.m. to 5:29 a.m.
- 25:30 a.m. to 5:59 a.m.
- 66:00 a.m. to 6:29 a.m.
- 206:30 a.m. to 6:59 a.m.
- 287:00 a.m. to 7:29 a.m.
- 177:30 a.m. to 7:59 a.m.
- 108:00 a.m. to 8:29 a.m.
- 68:30 a.m. to 8:59 a.m.
- 69:00 a.m. to 9:59 a.m.
- 210:00 a.m. to 10:59 a.m.
- 111:00 a.m. to 11:59 a.m.
- 1012:00 p.m. to 3:59 p.m.
- 74:00 p.m. to 11:59 p.m.

Occupations of males:
- Percentage of males in management occupations (except farmers):
Here: 16.3% city: 11.3%
- Percentage of males in computer and mathematical occupations:
Here: 4.8% city: 3.2%
- Percentage of males in architecture and engineering occupations:
Here: 5.7% city: 5.0%
- Percentage of males in education, training, and library occupations:
Here: 4.5% city: 3.2%
- Percentage of males in arts, design, entertainment, sports, and media occupations:
Here: 1.1% city: 2.9%
- Percentage of males in healthcare practitioners and technical occupations:
Here: 2.4% city: 0.5%
- Percentage of males in service occupations:
Here: 12.7% city: 17.0%
- Percentage of males in sales and office occupations:
Here: 20.8% city: 20.4%
- Percentage of males in construction, extraction, and maintenance occupations:
Here: 18.6% city: 9.1%
- Percentage of males in production occupations:
Here: 10.3% city: 8.6%
- Percentage of males in transportation occupations:
Here: 4.0% city: 6.3%
Occupations of females:
- Percentage of females in management occupations (except farmers):
Here: 28.1% city: 11.6%
- Percentage of females in computer and mathematical occupations:
Here: 11.9% city: 1.6%
- Percentage of females in community and social services occupations:
Here: 4.5% city: 2.8%
- Percentage of females in education, training, and library occupations:
Here: 17.8% city: 8.3%
- Percentage of females in arts, design, entertainment, sports, and media occupations:
Here: 4.1% city: 2.3%
- Percentage of females in healthcare practitioners and technical occupations:
Here: 19.4% city: 8.7%
- Percentage of females in service occupations:
Here: 7.6% city: 22.7%
- Percentage of females in sales and office occupations:
Here: 2.4% city: 28.7%
- Percentage of females in production occupations:
Here: 6.7% city: 4.1%
- Percentage of females in material moving occupations:
Here: 4.2% city: 1.8%
Percentage of people 16-64 in Armed Forces:
| Woodgate Commons: | 2.8% |
| Laconia: | 0.7% |
Education in this neighborhood (subdivision or community):
- Percentage of people 3 years and older in K-12 schools:
Woodgate Commons: 11.9% Laconia: 14.2%
- Percentage of people 3 years and older in undergraduate colleges:
Woodgate Commons: 4.6% Laconia: 2.4%
- Percentage of people 3 years and older in grad. or professional schools:
Woodgate Commons: 0.9% Laconia: 0.5%
- Percentage of students K-12 enrolled in private schools:
Woodgate Commons: 0.0% Laconia: 6.2%
Percentage of population below poverty level:
| Woodgate Commons: | 5.5% |
| Laconia: | 10.2% |
Median year owner moved in (as recorded in 2022):
Median year renter moved in (as recorded in 2022):
| Woodgate Commons: | 2009 |
| Laconia: | 2009 |
Median year renter moved in (as recorded in 2022):
| Woodgate Commons: | 2019 |
| Laconia: | 2016 |
Percentage of married-couple families with both working:
| Woodgate Commons: | 101.2% |
| Laconia: | 90.6% |

- 41.6%Fuel oil, kerosene, etc.
- 20.3%Utility gas
- 14.8%Electricity
- 14.2%Bottled, tank, or LP gas
- 5.5%Wood
- 3.6%Other fuel
Highways in this neighborhood:
N Main St (State Rte 106)
Length: 0.53 miles
Direction: SE-NW
Address range: 1125 to 1261
Direction: SE-NW
Address range: 1125 to 1261
Roads and streets:
Old N Main St
Length: 1.15 miles
Directions: N-S, SE-NW, SW-NE
Address range: 1159 to 1518
Directions: N-S, SE-NW, SW-NE
Address range: 1159 to 1518
Morningside Dr
Length: 0.69 miles
Directions: E-W, N-S, SE-NW, SW-NE
Address range: 1 to 242
Directions: E-W, N-S, SE-NW, SW-NE
Address range: 1 to 242
Roundbay Rd
Length: 0.28 miles
Directions: E-W, N-S, SE-NW, SW-NE
Address range: 1 to 99
Directions: E-W, N-S, SE-NW, SW-NE
Address range: 1 to 99
Marshall Ct
Length: 0.23 miles
Direction: E-W
Address range: 1 to 99
Direction: E-W
Address range: 1 to 99
Driftwood Dr
Length: 0.19 miles
Directions: E-W, N-S, SE-NW
Directions: E-W, N-S, SE-NW
Windmill Ln
Length: 0.18 miles
Directions: E-W, SE-NW
Address range: 1 to 62
Directions: E-W, SE-NW
Address range: 1 to 62
Leewood Dr
Length: 0.16 miles
Direction: E-W
Address range: 17 to 29
Direction: E-W
Address range: 17 to 29
Village Ct
Length: 0.15 miles
Directions: E-W, SW-NE
Address range: 1 to 99
Directions: E-W, SW-NE
Address range: 1 to 99
Larkwood Rd
Length: 0.14 miles
Direction: E-W
Address range: 21 to 38
Direction: E-W
Address range: 21 to 38
Bell Hill Dr
Length: 0.10 miles
Direction: N-S
Address range: 1 to 99
Direction: N-S
Address range: 1 to 99
Tanny Ln
Length: 0.04 miles
Direction: E-W
Address range: 1 to 99
Direction: E-W
Address range: 1 to 99