Races in Blacksburg, Virginia (VA) Detailed Stats
Data:
Races - White alone (%)
Races - White alone (% change since 2000)
Races - Black alone (%)
Races - Black alone (% change since 2000)
Races - American Indian alone (%)
Races - American Indian alone (% change since 2000)
Races - Asian alone (%)
Races - Asian alone (% change since 2000)
Races - Hispanic (%)
Races - Hispanic (% change since 2000)
Races - Native Hawaiian and Other Pacific Islander alone (%)
Races - Native Hawaiian and Other Pacific Islander alone (% change since 2000)
Races - Two or more races(%)
Races - Two or more races(% change since 2000)
Races - Other race alone (%)
Races - Other race alone (% change since 2000)
Racial diversity
Place of birth - Born in state of residence (%)
Place of birth - Born in state of residence (%) - White
Place of birth - Born in state of residence (%) - Black or African American
Place of birth - Born in state of residence (%) - Asian
Place of birth - Born in state of residence (%) - Hispanic or Latino
Place of birth - Born in state of residence (%) - American Indian and Alaska Native
Place of birth - Born in state of residence (%) - Multirace
Place of birth - Born in state of residence (%) - Other Race
Place of birth - Born in other state (%)
Place of birth - Born in other state (%) - White
Place of birth - Born in other state (%) - Black or African American
Place of birth - Born in other state (%) - Asian
Place of birth - Born in other state (%) - Hispanic or Latino
Place of birth - Born in other state (%) - American Indian and Alaska Native
Place of birth - Born in other state (%) - Multirace
Place of birth - Born in other state (%) - Other Race
Place of birth - Native, outside of US (%)
Place of birth - Native, outside of US (%) - White
Place of birth - Native, outside of US (%) - Black or African American
Place of birth - Native, outside of US (%) - Asian
Place of birth - Native, outside of US (%) - Hispanic or Latino
Place of birth - Native, outside of US (%) - American Indian and Alaska Native
Place of birth - Native, outside of US (%) - Multirace
Place of birth - Native, outside of US (%) - Other Race
Place of birth - Foreign born (%)
Place of birth - Foreign born (%) - White
Place of birth - Foreign born (%) - Black or African American
Place of birth - Foreign born (%) - Asian
Place of birth - Foreign born (%) - Hispanic or Latino
Place of birth - Foreign born (%) - American Indian and Alaska Native
Place of birth - Foreign born (%) - Multirace
Place of birth - Foreign born (%) - Other Race
Residents speaking English at home (%)
Residents speaking English at home - Born in the United States (%)
Residents speaking English at home - Native, born elsewhere (%)
Residents speaking English at home - Foreign born (%)
Residents speaking Spanish at home (%)
Residents speaking Spanish at home - Born in the United States (%)
Residents speaking Spanish at home - Native, born elsewhere (%)
Residents speaking Spanish at home - Foreign born (%)
Residents speaking other language at home (%)
Residents speaking other language at home - Born in the United States (%)
Residents speaking other language at home - Native, born elsewhere (%)
Residents speaking other language at home - Foreign born (%)
Marital status - Never married (%)
Marital status - Now married (%)
Marital status - Separated (%)
Marital status - Widowed (%)
Marital status - Divorced (%)
Ancestries Reported - Arab (%)
Ancestries Reported - Czech (%)
Ancestries Reported - Danish (%)
Ancestries Reported - Dutch (%)
Ancestries Reported - English (%)
Ancestries Reported - French (%)
Ancestries Reported - French Canadian (%)
Ancestries Reported - German (%)
Ancestries Reported - Greek (%)
Ancestries Reported - Hungarian (%)
Ancestries Reported - Irish (%)
Ancestries Reported - Italian (%)
Ancestries Reported - Lithuanian (%)
Ancestries Reported - Norwegian (%)
Ancestries Reported - Polish (%)
Ancestries Reported - Portuguese (%)
Ancestries Reported - Russian (%)
Ancestries Reported - Scotch-Irish (%)
Ancestries Reported - Scottish (%)
Ancestries Reported - Slovak (%)
Ancestries Reported - Subsaharan African (%)
Ancestries Reported - Swedish (%)
Ancestries Reported - Swiss (%)
Ancestries Reported - Ukrainian (%)
Ancestries Reported - United States (%)
Ancestries Reported - Welsh (%)
Ancestries Reported - West Indian (%)
Ancestries Reported - Other (%)
Geographical mobility - Same house 1 year ago (%)
Geographical mobility - Same house 1 year ago (%) - White
Geographical mobility - Same house 1 year ago (%) - Black or African American
Geographical mobility - Same house 1 year ago (%) - Asian
Geographical mobility - Same house 1 year ago (%) - Hispanic or Latino
Geographical mobility - Same house 1 year ago (%) - American Indian and Alaska Native
Geographical mobility - Same house 1 year ago (%) - Multirace
Geographical mobility - Same house 1 year ago (%) - Other Race
Geographical mobility - Moved within same county (%)
Geographical mobility - Moved within same county (%) - White
Geographical mobility - Moved within same county (%) - Black or African American
Geographical mobility - Moved within same county (%) - Asian
Geographical mobility - Moved within same county (%) - Hispanic or Latino
Geographical mobility - Moved within same county (%) - American Indian and Alaska Native
Geographical mobility - Moved within same county (%) - Multirace
Geographical mobility - Moved within same county (%) - Other Race
Geographical mobility - Moved from different county within same state (%)
Geographical mobility - Moved from different county within same state (%) - White
Geographical mobility - Moved from different county within same state (%) - Black or African American
Geographical mobility - Moved from different county within same state (%) - Asian
Geographical mobility - Moved from different county within same state (%) - Hispanic or Latino
Geographical mobility - Moved from different county within same state (%) - American Indian and Alaska Native
Geographical mobility - Moved from different county within same state (%) - Multirace
Geographical mobility - Moved from different county within same state (%) - Other Race
Geographical mobility - Moved from different state (%)
Geographical mobility - Moved from different state (%) - White
Geographical mobility - Moved from different state (%) - Black or African American
Geographical mobility - Moved from different state (%) - Asian
Geographical mobility - Moved from different state (%) - Hispanic or Latino
Geographical mobility - Moved from different state (%) - American Indian and Alaska Native
Geographical mobility - Moved from different state (%) - Multirace
Geographical mobility - Moved from different state (%) - Other Race
Geographical mobility - Moved from abroad (%)
Geographical mobility - Moved from abroad (%) - White
Geographical mobility - Moved from abroad (%) - Black or African American
Geographical mobility - Moved from abroad (%) - Asian
Geographical mobility - Moved from abroad (%) - Hispanic or Latino
Geographical mobility - Moved from abroad (%) - American Indian and Alaska Native
Geographical mobility - Moved from abroad (%) - Multirace
Geographical mobility - Moved from abroad (%) - Other Race
Place of birth for the foreign-born population - Ireland (%)
Place of birth for the foreign-born population - Denmark (%)
Place of birth for the foreign-born population - Norway (%)
Place of birth for the foreign-born population - Sweden (%)
Place of birth for the foreign-born population - United Kingdom (%)
Place of birth for the foreign-born population - England (%)
Place of birth for the foreign-born population - Scotland (%)
Place of birth for the foreign-born population - Other Northern Europe (%)
Place of birth for the foreign-born population - Austria (%)
Place of birth for the foreign-born population - Belgium (%)
Place of birth for the foreign-born population - France (%)
Place of birth for the foreign-born population - Germany (%)
Place of birth for the foreign-born population - Netherlands (%)
Place of birth for the foreign-born population - Switzerland (%)
Place of birth for the foreign-born population - Other Western Europe (%)
Place of birth for the foreign-born population - Greece (%)
Place of birth for the foreign-born population - Italy (%)
Place of birth for the foreign-born population - Portugal (%)
Place of birth for the foreign-born population - Spain (%)
Place of birth for the foreign-born population - Other Southern Europe (%)
Place of birth for the foreign-born population - Albania (%)
Place of birth for the foreign-born population - Belarus (%)
Place of birth for the foreign-born population - Bosnia and Herzegovina (%)
Place of birth for the foreign-born population - Bulgaria (%)
Place of birth for the foreign-born population - Croatia (%)
Place of birth for the foreign-born population - Czechoslovakia (%)
Place of birth for the foreign-born population - Hungary (%)
Place of birth for the foreign-born population - Latvia (%)
Place of birth for the foreign-born population - Lithuania (%)
Place of birth for the foreign-born population - North Macedonia (Macedonia) (%)
Place of birth for the foreign-born population - Moldova (%)
Place of birth for the foreign-born population - Poland (%)
Place of birth for the foreign-born population - Romania (%)
Place of birth for the foreign-born population - Russia (%)
Place of birth for the foreign-born population - Serbia (%)
Place of birth for the foreign-born population - Ukraine (%)
Place of birth for the foreign-born population - Other Eastern Europe (%)
Place of birth for the foreign-born population - China (%)
Place of birth for the foreign-born population - Hong Kong (%)
Place of birth for the foreign-born population - Taiwan (%)
Place of birth for the foreign-born population - Japan (%)
Place of birth for the foreign-born population - Korea (%)
Place of birth for the foreign-born population - Other Eastern Asia (%)
Place of birth for the foreign-born population - Afghanistan (%)
Place of birth for the foreign-born population - Bangladesh (%)
Place of birth for the foreign-born population - India (%)
Place of birth for the foreign-born population - Iran (%)
Place of birth for the foreign-born population - Kazakhstan (%)
Place of birth for the foreign-born population - Nepal (%)
Place of birth for the foreign-born population - Pakistan (%)
Place of birth for the foreign-born population - Sri Lanka (%)
Place of birth for the foreign-born population - Uzbekistan (%)
Place of birth for the foreign-born population - Other South Central Asia (%)
Place of birth for the foreign-born population - Burma (%)
Place of birth for the foreign-born population - Cambodia (%)
Place of birth for the foreign-born population - Indonesia (%)
Place of birth for the foreign-born population - Laos (%)
Place of birth for the foreign-born population - Malaysia (%)
Place of birth for the foreign-born population - Philippines (%)
Place of birth for the foreign-born population - Singapore (%)
Place of birth for the foreign-born population - Thailand (%)
Place of birth for the foreign-born population - Vietnam (%)
Place of birth for the foreign-born population - Other South Eastern Asia (%)
Place of birth for the foreign-born population - Armenia (%)
Place of birth for the foreign-born population - Iraq (%)
Place of birth for the foreign-born population - Israel (%)
Place of birth for the foreign-born population - Jordan (%)
Place of birth for the foreign-born population - Kuwait (%)
Place of birth for the foreign-born population - Lebanon (%)
Place of birth for the foreign-born population - Saudi Arabia (%)
Place of birth for the foreign-born population - Syria (%)
Place of birth for the foreign-born population - Turkey (%)
Place of birth for the foreign-born population - Yemen (%)
Place of birth for the foreign-born population - Other Western Asia (%)
Place of birth for the foreign-born population - Eritrea (%)
Place of birth for the foreign-born population - Ethiopia (%)
Place of birth for the foreign-born population - Kenya (%)
Place of birth for the foreign-born population - Somalia (%)
Place of birth for the foreign-born population - Uganda (%)
Place of birth for the foreign-born population - Zimbabwe (%)
Place of birth for the foreign-born population - Other Eastern Africa (%)
Place of birth for the foreign-born population - Cameroon (%)
Place of birth for the foreign-born population - Congo (%)
Place of birth for the foreign-born population - Democratic Republic of Congo (Zaire) (%)
Place of birth for the foreign-born population - Other Middle Africa (%)
Place of birth for the foreign-born population - Egypt (%)
Place of birth for the foreign-born population - Morocco (%)
Place of birth for the foreign-born population - Sudan (%)
Place of birth for the foreign-born population - Other Northern Africa (%)
Place of birth for the foreign-born population - South Africa (%)
Place of birth for the foreign-born population - Other Southern Africa (%)
Place of birth for the foreign-born population - Cabo Verde (%)
Place of birth for the foreign-born population - Ghana (%)
Place of birth for the foreign-born population - Liberia (%)
Place of birth for the foreign-born population - Nigeria (%)
Place of birth for the foreign-born population - Senegal (%)
Place of birth for the foreign-born population - Sierra Leone (%)
Place of birth for the foreign-born population - Other Western Africa (%)
Place of birth for the foreign-born population - Australia (%)
Place of birth for the foreign-born population - New Zealand (%)
Place of birth for the foreign-born population - Fiji (%)
Place of birth for the foreign-born population - Micronesia (%)
Place of birth for the foreign-born population - Bahamas (%)
Place of birth for the foreign-born population - Barbados (%)
Place of birth for the foreign-born population - Cuba (%)
Place of birth for the foreign-born population - Dominica (%)
Place of birth for the foreign-born population - Dominican Republic (%)
Place of birth for the foreign-born population - Grenada (%)
Place of birth for the foreign-born population - Haiti (%)
Place of birth for the foreign-born population - Jamaica (%)
Place of birth for the foreign-born population - St. Vincent and the Grenadines (%)
Place of birth for the foreign-born population - Trinidad and Tobago (%)
Place of birth for the foreign-born population - West Indies (%)
Place of birth for the foreign-born population - Other Caribbean (%)
Place of birth for the foreign-born population - Belize (%)
Place of birth for the foreign-born population - Costa Rica (%)
Place of birth for the foreign-born population - El Salvador (%)
Place of birth for the foreign-born population - Guatemala (%)
Place of birth for the foreign-born population - Honduras (%)
Place of birth for the foreign-born population - Mexico (%)
Place of birth for the foreign-born population - Nicaragua (%)
Place of birth for the foreign-born population - Panama (%)
Place of birth for the foreign-born population - Other Central America (%)
Place of birth for the foreign-born population - Argentina (%)
Place of birth for the foreign-born population - Bolivia (%)
Place of birth for the foreign-born population - Brazil (%)
Place of birth for the foreign-born population - Chile (%)
Place of birth for the foreign-born population - Colombia (%)
Place of birth for the foreign-born population - Ecuador (%)
Place of birth for the foreign-born population - Guyana (%)
Place of birth for the foreign-born population - Peru (%)
Place of birth for the foreign-born population - Uruguay (%)
Place of birth for the foreign-born population - Venezuela (%)
Place of birth for the foreign-born population - Other South America (%)
Place of birth for the foreign-born population - Canada (%)
Place of birth for the foreign-born population - Other Northern America (%)
Place of birth for the foreign-born population - Other (%)
Latest news about races in Blacksburg, VA collected exclusively by city-data.com from local newspapers, TV, and radio stations
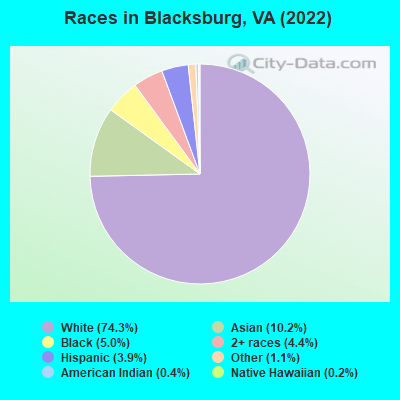
According to 2022 data, the most numerous races in Blacksburg, VA are White alone (33,389 residents), Black alone (2,229 residents), and Hispanic (1,762 residents). 83.9% of Blacksburg residents speak English at home. 13.3% of Blacksburg, VA residents are foreign-born (8.6% born in Asia, 2.0% born in Europe, 1.4% born in Africa), which is 9.8% greater than the foreign-born rate of 12.0% across the entire state of Virginia.
Race distribution in Blacksburg
2000 2022
4,965,637 70.2% White alone 1,376,378 19.4% Black alone 329,540 4.7% Hispanic 259,277 3.7% Asian alone 114,022 1.6% Two or more races 18,596 0.3% American Indian alone 11,685 0.2% Other race alone 3,380 0.05% Native Hawaiian and Other
5,095,130 58.7% White alone 1,594,785 18.4% Black alone 905,750 10.4% Hispanic 602,881 6.9% Asian alone 406,047 4.7% Two or more races 60,419 0.7% Other race alone 11,738 0.1% American Indian alone 6,869 0.08% Native Hawaiian and Other
Income and house value in Blacksburg Median household income in 2022 $47,473 White non-Hispanic householders$30,152 Asian householders$138,458 Some other race householders$16,842 Two or more races householders$61,072 Hispanic or Latino race householdersMedian 2022 house value $481,682 White Non-Hispanic householders$329,800 Black or African American householders$317,115 American Indian or Alaska Native householders $498,038 Asian householders$542,435 Some other race householders$525,744 Two or more races householders$539,764 Hispanic or Latino householders
Median age by race in Blacksburg
22.6 Median age for White residents22.4 22.6 21.4 Median age for Black or African American residents20.0 20.9 35.8 Median age for American Indian / Alaska Native residents19.2 47.3 21.6 Median age for Asian residents23.6 21.0 38.0 Median age for Native Hawaiian / Pacific Islander residents-666,666,666.0 20.0 21.9 Median age for Other race residents21.7 24.0 19.5 Median age for Two or more races residents20.6 19.0 22.7 Median age for White alone residents22.7 22.5 18.5 Median age for Hispanic or Latino residents18.2 18.7
Owner/renter occupied households by race in Blacksburg
House owners and renters - White residents 4,309 40.7% Owner occupied6,275 59.3% Renter occupiedHouse owners and renters - Black or African American residents 63 9.2% Owner occupied628 90.8% Renter occupiedHouse owners and renters - American Indian / Alaska Native residents 19 21.2% Owner occupied71 78.8% Renter occupiedHouse owners and renters - Asian residents 199 15.1% Owner occupied1,115 84.9% Renter occupiedHouse owners and renters - Native Hawaiian / Pacific Islander residents 82 100.0% Renter occupiedHouse owners and renters - Other race residents 21 12.4% Owner occupied150 87.6% Renter occupiedHouse owners and renters - Two or more races residents 25 11.2% Owner occupied199 88.8% Renter occupiedHouse owners and renters - White alone residents 4,262 40.6% Owner occupied6,235 59.4% Renter occupiedHouse owners and renters - Hispanic or Latino residents 62 42.9% Owner occupied83 57.1% Renter occupied
Language usage in Blacksburg
English speakers - Total 83.9% of residents of Blacksburg speak English at home.
2.4% of residents speak Spanish at home 958 92.8% Speak English very well74 7.2% Speak English less than very well14.7% of residents speak other language at home 5,463 84.8% Speak English very well983 15.2% Speak English less than very well
English speakers - Born in the United States 95.7% of residents of Blacksburg speak English at home.
1.2% of residents speak Spanish at home 142 72.8% Speak English very well53 27.2% Speak English less than very well3.8% of residents speak other language at home 582 95.6% Speak English very well27 4.4% Speak English less than very well
English speakers - Native, born elsewhere 85.1% of residents of Blacksburg speak English at home.
11.1% of residents speak Spanish at home 33 80.5% Speak English very well8 19.5% Speak English less than very well10.6% of residents speak other language at home 39 100.0% Speak English very well
English speakers - Foreign-born 25.0% of residents of Blacksburg speak English at home.
2.9% of residents speak Spanish at home 163 92.6% Speak English very well13 7.4% Speak English less than very well73.2% of residents speak other language at home 3,459 77.2% Speak English very well1,022 22.8% Speak English less than very well
White (Caucasian) - Speak only English Native:
96.5% (30,299)Foreign-born:
26.4% (594)
White (Caucasian) - Speak another language Native:
3.8% (1,190)Foreign-born:
72.1% (1,623)
Black or African American - Speak only English Native:
96.5% (1,820)Foreign-born:
46.1% (122)
Black or African American - Speak another language Native:
3.6% (67)Foreign-born:
50.4% (134)
Asian - Speak only English Native:
36.4% (778)Foreign-born:
20.2% (502)
Asian - Speak another language Native:
64.2% (1,372)Foreign-born:
80.0% (1,993)
Other race - Speak only English Native:
66.8% (176)Foreign-born:
8.4% (33)
Other race - Speak another language Native:
36.3% (96)Foreign-born:
91.6% (356)
Two or more races - Speak only English Native:
88.1% (1,931)Foreign-born:
40.9% (55)
Two or more races - Speak another language Native:
11.9% (262)Foreign-born:
60.7% (82)
White alone - Speak only English Native:
97.1% (29,612)Foreign-born:
25.6% (576)
White alone - Speak another language Native:
3.2% (974)Foreign-born:
72.9% (1,642)
Hispanic or Latino - Speak only English Native:
61.7% (1,060)Foreign-born:
7.8% (10)
Hispanic or Latino - Speak another language Native:
38.2% (656)Foreign-born:
94.0% (115)
Foreign-born residents in Blacksburg 5,978 residents are foreign born (8.6% Asia , 2.0% Europe , 1.4% Africa ).
This city:
13.3%Virginia:
12.6%
Marital status for residents in Blacksburg Marital status - White (Caucasian) population 15 years and over
Males 75.7% Never married20.7% Now married0.2% Separated1.4% Widowed2.0% DivorcedFemales 65.5% Never married25.4% Now married0.4% Separated3.2% Widowed5.5% DivorcedWomen who gave birth in the past 12 months Now married:
73.1% (129)Unmarried:
26.9% (48)
Women who did not give birth in the past 12 months Now married:
15.6% (1,690)Unmarried:
84.4% (9,165)
Marital status - Black or African American population 15 years and over
Males 88.5% Never married11.3% Now married0.0% Separated0.0% Widowed0.3% DivorcedFemales 80.8% Never married5.1% Now married0.9% Separated0.0% Widowed13.2% DivorcedWomen who gave birth in the past 12 months Now married:
100.0% (14)Unmarried:
0.0% (0)
Women who did not give birth in the past 12 months Now married:
3.1% (24)Unmarried:
96.9% (748)
Marital status - American Indian / Alaska Native population 15 years and over
Males 91.3% Never married8.7% Now married0.0% Separated0.0% Widowed0.0% DivorcedFemales 35.3% Never married0.0% Now married0.0% Separated0.0% Widowed64.7% DivorcedWomen who did not give birth in the past 12 months Now married:
0.0% (0)Unmarried:
100.0% (90)
Marital status - Asian population 15 years and over
Males 77.3% Never married21.4% Now married1.3% Separated0.0% Widowed0.0% DivorcedFemales 66.1% Never married30.1% Now married0.0% Separated2.0% Widowed1.8% DivorcedWomen who gave birth in the past 12 months Now married:
100.0% (36)Unmarried:
0.0% (0)
Women who did not give birth in the past 12 months Now married:
25.7% (529)Unmarried:
74.3% (1,529)
Marital status - Native Hawaiian / Pacific Islander population 15 years and over
Males 100.0% Never married0.0% Now married0.0% Separated0.0% Widowed0.0% DivorcedFemales 100.0% Never married0.0% Now married0.0% Separated0.0% Widowed0.0% DivorcedWomen who did not give birth in the past 12 months Now married:
0.0% (0)Unmarried:
100.0% (22)
Marital status - Other race population 15 years and over
Males 81.3% Never married18.7% Now married0.0% Separated0.0% Widowed0.0% DivorcedFemales 62.5% Never married37.5% Now married0.0% Separated0.0% Widowed0.0% DivorcedWomen who did not give birth in the past 12 months Now married:
16.7% (14)Unmarried:
83.3% (72)
Marital status - Two or more races population 15 years and over
Males 97.5% Never married2.2% Now married0.0% Separated0.4% Widowed0.0% DivorcedFemales 92.4% Never married5.3% Now married1.1% Separated0.0% Widowed1.2% DivorcedWomen who gave birth in the past 12 months Now married:
100.0% (33)Unmarried:
0.0% (0)
Women who did not give birth in the past 12 months Now married:
3.2% (30)Unmarried:
96.8% (910)
Marital status - White alone, not Hispanic / Latino population 15 years and over
Males 75.3% Never married21.0% Now married0.2% Separated1.4% Widowed2.0% DivorcedFemales 65.4% Never married25.4% Now married0.4% Separated3.3% Widowed5.6% DivorcedWomen who gave birth in the past 12 months Now married:
71.8% (122)Unmarried:
28.2% (48)
Women who did not give birth in the past 12 months Now married:
15.3% (1,626)Unmarried:
84.7% (8,977)
Marital status - Hispanic or Latino population 15 years and over
Males 85.6% Never married13.3% Now married0.0% Separated0.0% Widowed1.1% DivorcedFemales 84.3% Never married14.4% Now married0.0% Separated0.0% Widowed1.3% DivorcedWomen who gave birth in the past 12 months Now married:
100.0% (8)Unmarried:
0.0% (0)
Women who did not give birth in the past 12 months Now married:
10.7% (75)Unmarried:
89.3% (627)
Ancestries in Blacksburg
5,419 23.4% American2,169 9.4% English2,062 8.9% German1,606 6.9% Irish764 3.3% Italian671 2.9% European444 1.9% Albanian269 1.2% Polish254 1.1% Arab228 1.0% Egyptian189 0.8% Iranian172 0.7% French134 0.6% African129 0.6% Jamaican126 0.5% Yugoslavian120 0.5% Scottish109 0.5% Swedish102 0.4% Scotch-Irish102 0.4% French Canadian97 0.4% Dutch94 0.4% Danish77 0.3% Norwegian70 0.3% Turkish65 0.3% Austrian61 0.3% Czech54 0.2% Scandinavian40 0.2% British37 0.2% Finnish36 0.2% Eastern European34 0.1% Lebanese33 0.1% Ukrainian32 0.1% Romanian22 0.09% Sudanese21 0.09% Greek21 0.09% Welsh20 0.09% Russian20 0.09% Ethiopian18 0.08% Maltese16 0.07% Northern European15 0.06% Ghanaian15 0.06% West Indian14 0.06% Croatian12 0.05% Hungarian10 0.04% Israeli10 0.04% Lithuanian9 0.04% Czechoslovakian9 0.04% Brazilian8 0.03% Canadian7 0.03% Jordanian5 0.02% Portuguese3 0.01% Bulgarian
Geographical mobility in Blacksburg Same house 1 year ago 22,449 65.6% White (Caucasian)1,370 63.4% Black or African American98 40.5% American Indian / Alaska Native2,544 53.8% Asian95 75.3% Native Hawaiian / Pacific Islander528 80.6% Other race1,533 62.8% Two or more races21,987 66.1% White alone, not Hispanic / Latino651 37.4% Hispanic or LatinoMoved within same county 5,305 15.5% White / Caucasian256 11.8% Black or African American97 40.0% American Indian / Alaska Native611 12.9% Asian11 8.7% Native Hawaiian / Pacific Islander46 7.0% Other race201 8.2% Two or more races5,285 15.9% White alone, not Hispanic / Latino90 5.2% Hispanic or LatinoMoved within same state 4,707 13.8% White / Caucasian279 12.9% Black or African American14 6.0% American Indian / Alaska Native807 17.1% Asian25 20.1% Native Hawaiian / Pacific Islander66 10.0% Other race424 17.4% Two or more races4,387 13.2% White alone, not Hispanic / Latino972 55.8% Hispanic or LatinoMoved from different state 2,208 6.5% White / Caucasian136 6.3% Black or African American56 23.2% American Indian / Alaska Native659 13.9% Asian8 1.2% Other race167 6.8% Two or more races2,033 6.1% White alone, not Hispanic / Latino275 15.8% Hispanic or LatinoMoved from abroad 121 0.4% White91 4.2% Black or African American14 5.6% American Indian / Alaska Native723 15.3% Asian42 1.7% Two or more races134 0.4% White alone, not Hispanic / Latino2 0.1% Hispanic or Latino
Children Nativity (place of birth) in Blacksburg
Children under 6 years - Living with two parents Both parents native 552 99.8% Native1 0.2% Foreign-bornBoth parents foreign-born 137 53.1% Native121 46.9% Foreign-bornOne native, one foreign-born parent 295 100.0% NativeChildren under 6 years - Living with one parent Native parent 217 100.0% NativeChildren 6 to 17 years - Living with two parents Both parents native 1,669 100.0% NativeBoth parents foreign-born 307 49.6% Native312 50.4% Foreign-bornOne native, one foreign-born parent 234 100.0% NativeChildren 6 to 17 years - Living with one parent Native parent 281 100.0% NativeForeign-born parent 35 49.9% Native36 50.1% Foreign-born
Grandparents responsible for own grandchildren in Blacksburg
Grandparents (30 to 59 years) White / Caucasian 40 81.6% Responsible for grandchildren9 18.4% Not responsible for grandchildrenWhite alone, not Hispanic / Latino 41 80.2% Responsible for grandchildren10 19.8% Not responsible for grandchildren
Grandparents (60 years and over) White / Caucasian 259 100.0% Not responsible for grandchildrenWhite alone, not Hispanic / Latino 274 100.0% Not responsible for grandchildren