Races in Brooklyn Center, Minnesota (MN) Detailed Stats
Data:
Races - White alone (%)
Races - White alone (% change since 2000)
Races - Black alone (%)
Races - Black alone (% change since 2000)
Races - American Indian alone (%)
Races - American Indian alone (% change since 2000)
Races - Asian alone (%)
Races - Asian alone (% change since 2000)
Races - Hispanic (%)
Races - Hispanic (% change since 2000)
Races - Native Hawaiian and Other Pacific Islander alone (%)
Races - Native Hawaiian and Other Pacific Islander alone (% change since 2000)
Races - Two or more races(%)
Races - Two or more races(% change since 2000)
Races - Other race alone (%)
Races - Other race alone (% change since 2000)
Racial diversity
Place of birth - Born in state of residence (%)
Place of birth - Born in state of residence (%) - White
Place of birth - Born in state of residence (%) - Black or African American
Place of birth - Born in state of residence (%) - Asian
Place of birth - Born in state of residence (%) - Hispanic or Latino
Place of birth - Born in state of residence (%) - American Indian and Alaska Native
Place of birth - Born in state of residence (%) - Multirace
Place of birth - Born in state of residence (%) - Other Race
Place of birth - Born in other state (%)
Place of birth - Born in other state (%) - White
Place of birth - Born in other state (%) - Black or African American
Place of birth - Born in other state (%) - Asian
Place of birth - Born in other state (%) - Hispanic or Latino
Place of birth - Born in other state (%) - American Indian and Alaska Native
Place of birth - Born in other state (%) - Multirace
Place of birth - Born in other state (%) - Other Race
Place of birth - Native, outside of US (%)
Place of birth - Native, outside of US (%) - White
Place of birth - Native, outside of US (%) - Black or African American
Place of birth - Native, outside of US (%) - Asian
Place of birth - Native, outside of US (%) - Hispanic or Latino
Place of birth - Native, outside of US (%) - American Indian and Alaska Native
Place of birth - Native, outside of US (%) - Multirace
Place of birth - Native, outside of US (%) - Other Race
Place of birth - Foreign born (%)
Place of birth - Foreign born (%) - White
Place of birth - Foreign born (%) - Black or African American
Place of birth - Foreign born (%) - Asian
Place of birth - Foreign born (%) - Hispanic or Latino
Place of birth - Foreign born (%) - American Indian and Alaska Native
Place of birth - Foreign born (%) - Multirace
Place of birth - Foreign born (%) - Other Race
Residents speaking English at home (%)
Residents speaking English at home - Born in the United States (%)
Residents speaking English at home - Native, born elsewhere (%)
Residents speaking English at home - Foreign born (%)
Residents speaking Spanish at home (%)
Residents speaking Spanish at home - Born in the United States (%)
Residents speaking Spanish at home - Native, born elsewhere (%)
Residents speaking Spanish at home - Foreign born (%)
Residents speaking other language at home (%)
Residents speaking other language at home - Born in the United States (%)
Residents speaking other language at home - Native, born elsewhere (%)
Residents speaking other language at home - Foreign born (%)
Marital status - Never married (%)
Marital status - Now married (%)
Marital status - Separated (%)
Marital status - Widowed (%)
Marital status - Divorced (%)
Ancestries Reported - Arab (%)
Ancestries Reported - Czech (%)
Ancestries Reported - Danish (%)
Ancestries Reported - Dutch (%)
Ancestries Reported - English (%)
Ancestries Reported - French (%)
Ancestries Reported - French Canadian (%)
Ancestries Reported - German (%)
Ancestries Reported - Greek (%)
Ancestries Reported - Hungarian (%)
Ancestries Reported - Irish (%)
Ancestries Reported - Italian (%)
Ancestries Reported - Lithuanian (%)
Ancestries Reported - Norwegian (%)
Ancestries Reported - Polish (%)
Ancestries Reported - Portuguese (%)
Ancestries Reported - Russian (%)
Ancestries Reported - Scotch-Irish (%)
Ancestries Reported - Scottish (%)
Ancestries Reported - Slovak (%)
Ancestries Reported - Subsaharan African (%)
Ancestries Reported - Swedish (%)
Ancestries Reported - Swiss (%)
Ancestries Reported - Ukrainian (%)
Ancestries Reported - United States (%)
Ancestries Reported - Welsh (%)
Ancestries Reported - West Indian (%)
Ancestries Reported - Other (%)
Geographical mobility - Same house 1 year ago (%)
Geographical mobility - Same house 1 year ago (%) - White
Geographical mobility - Same house 1 year ago (%) - Black or African American
Geographical mobility - Same house 1 year ago (%) - Asian
Geographical mobility - Same house 1 year ago (%) - Hispanic or Latino
Geographical mobility - Same house 1 year ago (%) - American Indian and Alaska Native
Geographical mobility - Same house 1 year ago (%) - Multirace
Geographical mobility - Same house 1 year ago (%) - Other Race
Geographical mobility - Moved within same county (%)
Geographical mobility - Moved within same county (%) - White
Geographical mobility - Moved within same county (%) - Black or African American
Geographical mobility - Moved within same county (%) - Asian
Geographical mobility - Moved within same county (%) - Hispanic or Latino
Geographical mobility - Moved within same county (%) - American Indian and Alaska Native
Geographical mobility - Moved within same county (%) - Multirace
Geographical mobility - Moved within same county (%) - Other Race
Geographical mobility - Moved from different county within same state (%)
Geographical mobility - Moved from different county within same state (%) - White
Geographical mobility - Moved from different county within same state (%) - Black or African American
Geographical mobility - Moved from different county within same state (%) - Asian
Geographical mobility - Moved from different county within same state (%) - Hispanic or Latino
Geographical mobility - Moved from different county within same state (%) - American Indian and Alaska Native
Geographical mobility - Moved from different county within same state (%) - Multirace
Geographical mobility - Moved from different county within same state (%) - Other Race
Geographical mobility - Moved from different state (%)
Geographical mobility - Moved from different state (%) - White
Geographical mobility - Moved from different state (%) - Black or African American
Geographical mobility - Moved from different state (%) - Asian
Geographical mobility - Moved from different state (%) - Hispanic or Latino
Geographical mobility - Moved from different state (%) - American Indian and Alaska Native
Geographical mobility - Moved from different state (%) - Multirace
Geographical mobility - Moved from different state (%) - Other Race
Geographical mobility - Moved from abroad (%)
Geographical mobility - Moved from abroad (%) - White
Geographical mobility - Moved from abroad (%) - Black or African American
Geographical mobility - Moved from abroad (%) - Asian
Geographical mobility - Moved from abroad (%) - Hispanic or Latino
Geographical mobility - Moved from abroad (%) - American Indian and Alaska Native
Geographical mobility - Moved from abroad (%) - Multirace
Geographical mobility - Moved from abroad (%) - Other Race
Place of birth for the foreign-born population - Ireland (%)
Place of birth for the foreign-born population - Denmark (%)
Place of birth for the foreign-born population - Norway (%)
Place of birth for the foreign-born population - Sweden (%)
Place of birth for the foreign-born population - United Kingdom (%)
Place of birth for the foreign-born population - England (%)
Place of birth for the foreign-born population - Scotland (%)
Place of birth for the foreign-born population - Other Northern Europe (%)
Place of birth for the foreign-born population - Austria (%)
Place of birth for the foreign-born population - Belgium (%)
Place of birth for the foreign-born population - France (%)
Place of birth for the foreign-born population - Germany (%)
Place of birth for the foreign-born population - Netherlands (%)
Place of birth for the foreign-born population - Switzerland (%)
Place of birth for the foreign-born population - Other Western Europe (%)
Place of birth for the foreign-born population - Greece (%)
Place of birth for the foreign-born population - Italy (%)
Place of birth for the foreign-born population - Portugal (%)
Place of birth for the foreign-born population - Spain (%)
Place of birth for the foreign-born population - Other Southern Europe (%)
Place of birth for the foreign-born population - Albania (%)
Place of birth for the foreign-born population - Belarus (%)
Place of birth for the foreign-born population - Bosnia and Herzegovina (%)
Place of birth for the foreign-born population - Bulgaria (%)
Place of birth for the foreign-born population - Croatia (%)
Place of birth for the foreign-born population - Czechoslovakia (%)
Place of birth for the foreign-born population - Hungary (%)
Place of birth for the foreign-born population - Latvia (%)
Place of birth for the foreign-born population - Lithuania (%)
Place of birth for the foreign-born population - North Macedonia (Macedonia) (%)
Place of birth for the foreign-born population - Moldova (%)
Place of birth for the foreign-born population - Poland (%)
Place of birth for the foreign-born population - Romania (%)
Place of birth for the foreign-born population - Russia (%)
Place of birth for the foreign-born population - Serbia (%)
Place of birth for the foreign-born population - Ukraine (%)
Place of birth for the foreign-born population - Other Eastern Europe (%)
Place of birth for the foreign-born population - China (%)
Place of birth for the foreign-born population - Hong Kong (%)
Place of birth for the foreign-born population - Taiwan (%)
Place of birth for the foreign-born population - Japan (%)
Place of birth for the foreign-born population - Korea (%)
Place of birth for the foreign-born population - Other Eastern Asia (%)
Place of birth for the foreign-born population - Afghanistan (%)
Place of birth for the foreign-born population - Bangladesh (%)
Place of birth for the foreign-born population - India (%)
Place of birth for the foreign-born population - Iran (%)
Place of birth for the foreign-born population - Kazakhstan (%)
Place of birth for the foreign-born population - Nepal (%)
Place of birth for the foreign-born population - Pakistan (%)
Place of birth for the foreign-born population - Sri Lanka (%)
Place of birth for the foreign-born population - Uzbekistan (%)
Place of birth for the foreign-born population - Other South Central Asia (%)
Place of birth for the foreign-born population - Burma (%)
Place of birth for the foreign-born population - Cambodia (%)
Place of birth for the foreign-born population - Indonesia (%)
Place of birth for the foreign-born population - Laos (%)
Place of birth for the foreign-born population - Malaysia (%)
Place of birth for the foreign-born population - Philippines (%)
Place of birth for the foreign-born population - Singapore (%)
Place of birth for the foreign-born population - Thailand (%)
Place of birth for the foreign-born population - Vietnam (%)
Place of birth for the foreign-born population - Other South Eastern Asia (%)
Place of birth for the foreign-born population - Armenia (%)
Place of birth for the foreign-born population - Iraq (%)
Place of birth for the foreign-born population - Israel (%)
Place of birth for the foreign-born population - Jordan (%)
Place of birth for the foreign-born population - Kuwait (%)
Place of birth for the foreign-born population - Lebanon (%)
Place of birth for the foreign-born population - Saudi Arabia (%)
Place of birth for the foreign-born population - Syria (%)
Place of birth for the foreign-born population - Turkey (%)
Place of birth for the foreign-born population - Yemen (%)
Place of birth for the foreign-born population - Other Western Asia (%)
Place of birth for the foreign-born population - Eritrea (%)
Place of birth for the foreign-born population - Ethiopia (%)
Place of birth for the foreign-born population - Kenya (%)
Place of birth for the foreign-born population - Somalia (%)
Place of birth for the foreign-born population - Uganda (%)
Place of birth for the foreign-born population - Zimbabwe (%)
Place of birth for the foreign-born population - Other Eastern Africa (%)
Place of birth for the foreign-born population - Cameroon (%)
Place of birth for the foreign-born population - Congo (%)
Place of birth for the foreign-born population - Democratic Republic of Congo (Zaire) (%)
Place of birth for the foreign-born population - Other Middle Africa (%)
Place of birth for the foreign-born population - Egypt (%)
Place of birth for the foreign-born population - Morocco (%)
Place of birth for the foreign-born population - Sudan (%)
Place of birth for the foreign-born population - Other Northern Africa (%)
Place of birth for the foreign-born population - South Africa (%)
Place of birth for the foreign-born population - Other Southern Africa (%)
Place of birth for the foreign-born population - Cabo Verde (%)
Place of birth for the foreign-born population - Ghana (%)
Place of birth for the foreign-born population - Liberia (%)
Place of birth for the foreign-born population - Nigeria (%)
Place of birth for the foreign-born population - Senegal (%)
Place of birth for the foreign-born population - Sierra Leone (%)
Place of birth for the foreign-born population - Other Western Africa (%)
Place of birth for the foreign-born population - Australia (%)
Place of birth for the foreign-born population - New Zealand (%)
Place of birth for the foreign-born population - Fiji (%)
Place of birth for the foreign-born population - Micronesia (%)
Place of birth for the foreign-born population - Bahamas (%)
Place of birth for the foreign-born population - Barbados (%)
Place of birth for the foreign-born population - Cuba (%)
Place of birth for the foreign-born population - Dominica (%)
Place of birth for the foreign-born population - Dominican Republic (%)
Place of birth for the foreign-born population - Grenada (%)
Place of birth for the foreign-born population - Haiti (%)
Place of birth for the foreign-born population - Jamaica (%)
Place of birth for the foreign-born population - St. Vincent and the Grenadines (%)
Place of birth for the foreign-born population - Trinidad and Tobago (%)
Place of birth for the foreign-born population - West Indies (%)
Place of birth for the foreign-born population - Other Caribbean (%)
Place of birth for the foreign-born population - Belize (%)
Place of birth for the foreign-born population - Costa Rica (%)
Place of birth for the foreign-born population - El Salvador (%)
Place of birth for the foreign-born population - Guatemala (%)
Place of birth for the foreign-born population - Honduras (%)
Place of birth for the foreign-born population - Mexico (%)
Place of birth for the foreign-born population - Nicaragua (%)
Place of birth for the foreign-born population - Panama (%)
Place of birth for the foreign-born population - Other Central America (%)
Place of birth for the foreign-born population - Argentina (%)
Place of birth for the foreign-born population - Bolivia (%)
Place of birth for the foreign-born population - Brazil (%)
Place of birth for the foreign-born population - Chile (%)
Place of birth for the foreign-born population - Colombia (%)
Place of birth for the foreign-born population - Ecuador (%)
Place of birth for the foreign-born population - Guyana (%)
Place of birth for the foreign-born population - Peru (%)
Place of birth for the foreign-born population - Uruguay (%)
Place of birth for the foreign-born population - Venezuela (%)
Place of birth for the foreign-born population - Other South America (%)
Place of birth for the foreign-born population - Canada (%)
Place of birth for the foreign-born population - Other Northern America (%)
Place of birth for the foreign-born population - Other (%)
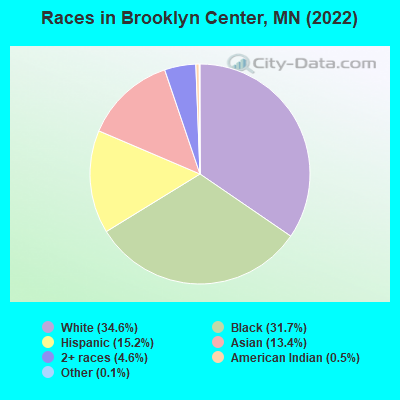
According to 2022 data, the most numerous races in Brooklyn Center, MN are White alone (11,364 residents), Black alone (10,416 residents), and Hispanic (4,989 residents). 71.1% of Brooklyn Center residents speak English at home. 23.9% of Brooklyn Center, MN residents are foreign-born (9.8% born in Africa, 6.9% born in Latin America, 5.4% born in Asia), which is 66.5% greater than the foreign-born rate of 8.0% across the entire state of Minnesota.
Race distribution in Brooklyn Center
2000 2022
4,337,143 88.2% White alone 168,813 3.4% Black alone 143,382 2.9% Hispanic 141,083 2.9% Asian alone 70,304 1.4% Two or more races 52,009 1.1% American Indian alone 5,031 0.1% Other race alone 1,714 0.03% Native Hawaiian and Other
4,356,347 76.2% White alone 395,179 6.9% Black alone 333,830 5.8% Hispanic 294,800 5.2% Asian alone 259,649 4.5% Two or more races 42,125 0.7% American Indian alone 32,976 0.6% Other race alone 2,278 0.04% Native Hawaiian and Other
Income and house value in Brooklyn Center Median household income in 2022 $72,960 White non-Hispanic householders$59,285 Black householders$96,148 American Indian and Alaska Native householders$92,925 Asian householders$89,495 Some other race householders$76,732 Two or more races householders$80,671 Hispanic or Latino race householdersMedian 2022 house value $252,679 White Non-Hispanic householders$258,724 Black or African American householders$272,023 American Indian or Alaska Native householders $308,051 Asian householders$332,473 Native Hawaiian and other Pacific Islander householders$299,588 Some other race householders$267,913 Two or more races householders$274,441 Hispanic or Latino householders
Median age by race in Brooklyn Center
51.0 Median age for White residents49.8 54.4 27.6 Median age for Black or African American residents19.5 30.6 24.7 Median age for American Indian / Alaska Native residents37.5 25.4 29.2 Median age for Asian residents29.2 29.1 -790,303,029.5 Median age for Native Hawaiian / Pacific Islander residents-856,799,036.4 -365,948,037.2 20.2 Median age for Other race residents23.9 17.0 24.2 Median age for Two or more races residents20.9 27.4 52.9 Median age for White alone residents51.1 56.1 21.6 Median age for Hispanic or Latino residents23.5 20.5
Owner/renter occupied households by race in Brooklyn Center
House owners and renters - White residents 4,592 75.8% Owner occupied1,468 24.2% Renter occupiedHouse owners and renters - Black or African American residents 983 29.5% Owner occupied2,353 70.5% Renter occupiedHouse owners and renters - American Indian / Alaska Native residents 57 48.4% Owner occupied60 51.6% Renter occupiedHouse owners and renters - Asian residents 739 76.0% Owner occupied234 24.0% Renter occupiedHouse owners and renters - Other race residents 392 62.6% Owner occupied234 37.4% Renter occupiedHouse owners and renters - Two or more races residents 301 46.1% Owner occupied351 53.9% Renter occupiedHouse owners and renters - White alone residents 4,492 76.5% Owner occupied1,382 23.5% Renter occupiedHouse owners and renters - Hispanic or Latino residents 590 57.2% Owner occupied441 42.8% Renter occupied
Language usage in Brooklyn Center
English speakers - Total 71.1% of residents of Brooklyn Center speak English at home.
12.3% of residents speak Spanish at home 2,009 54.4% Speak English very well1,687 45.6% Speak English less than very well16.4% of residents speak other language at home 2,887 58.9% Speak English very well2,013 41.1% Speak English less than very well
English speakers - Born in the United States 79.9% of residents of Brooklyn Center speak English at home.
6.7% of residents speak Spanish at home 448 94.7% Speak English very well25 5.3% Speak English less than very well16.0% of residents speak other language at home 759 67.6% Speak English very well364 32.4% Speak English less than very well
English speakers - Native, born elsewhere 69.6% of residents of Brooklyn Center speak English at home.
17.6% of residents speak Spanish at home 28 53.8% Speak English very well24 46.2% Speak English less than very well12.5% of residents speak other language at home 35 94.6% Speak English very well2 5.4% Speak English less than very well
English speakers - Foreign-born 33.6% of residents of Brooklyn Center speak English at home.
23.7% of residents speak Spanish at home 503 29.4% Speak English very well1,207 70.6% Speak English less than very well40.5% of residents speak other language at home 1,447 49.4% Speak English very well1,480 50.6% Speak English less than very well
White (Caucasian) - Speak only English Native:
94.3% (10,504)Foreign-born:
37.6% (238)
White (Caucasian) - Speak another language Native:
5.3% (594)Foreign-born:
60.7% (383)
Black or African American - Speak only English Native:
88.7% (5,036)Foreign-born:
42.8% (1,456)
Black or African American - Speak another language Native:
8.2% (463)Foreign-born:
43.8% (1,491)
American Indian / Alaska Native - Speak only English Native:
57.9% (144)Foreign-born:
72.5% (65)
American Indian / Alaska Native - Speak another language Native:
50.9% (127)Foreign-born:
39.1% (35)
Asian - Speak only English Native:
41.7% (1,013)Foreign-born:
20.0% (306)
Asian - Speak another language Native:
57.9% (1,408)Foreign-born:
80.1% (1,227)
Other race - Speak only English Native:
24.4% (363)Foreign-born:
2.6% (32)
Other race - Speak another language Native:
69.1% (1,029)Foreign-born:
98.0% (1,196)
Two or more races - Speak only English Native:
80.4% (1,524)Foreign-born:
19.5% (125)
Two or more races - Speak another language Native:
18.4% (349)Foreign-born:
80.5% (516)
White alone - Speak only English Native:
97.0% (10,449)Foreign-born:
56.5% (179)
White alone - Speak another language Native:
3.0% (321)Foreign-born:
45.5% (144)
Hispanic or Latino - Speak only English Native:
30.6% (758)Foreign-born:
10.2% (198)
Hispanic or Latino - Speak another language Native:
65.2% (1,613)Foreign-born:
88.7% (1,725)
Foreign-born residents in Brooklyn Center 7,836 residents are foreign born (9.8% Africa , 6.9% Latin America , 5.4% Asia ).
This city:
23.9%Minnesota:
8.5%
Marital status for residents in Brooklyn Center Marital status - White (Caucasian) population 15 years and over
Males 35.5% Never married46.7% Now married2.0% Separated3.7% Widowed12.1% DivorcedFemales 30.6% Never married46.0% Now married0.8% Separated7.4% Widowed15.2% DivorcedWomen who gave birth in the past 12 months Now married:
78.9% (96)Unmarried:
21.1% (26)
Women who did not give birth in the past 12 months Now married:
45.6% (1,072)Unmarried:
54.4% (1,281)
Marital status - Black or African American population 15 years and over
Males 54.3% Never married33.8% Now married0.0% Separated0.1% Widowed11.9% DivorcedFemales 47.0% Never married32.5% Now married2.7% Separated1.2% Widowed16.6% DivorcedWomen who gave birth in the past 12 months Now married:
84.5% (166)Unmarried:
15.5% (30)
Women who did not give birth in the past 12 months Now married:
28.6% (636)Unmarried:
71.4% (1,586)
Marital status - American Indian / Alaska Native population 15 years and over
Males 48.6% Never married49.5% Now married0.0% Separated1.9% Widowed0.0% DivorcedFemales 52.8% Never married25.8% Now married0.0% Separated0.0% Widowed21.4% DivorcedWomen who gave birth in the past 12 months Now married:
0.0% (0)Unmarried:
100.0% (13)
Women who did not give birth in the past 12 months Now married:
34.2% (43)Unmarried:
65.8% (84)
Marital status - Asian population 15 years and over
Males 61.6% Never married29.5% Now married0.0% Separated1.0% Widowed7.9% DivorcedFemales 60.6% Never married29.4% Now married0.7% Separated5.9% Widowed3.4% DivorcedWomen who gave birth in the past 12 months Now married:
26.9% (36)Unmarried:
73.1% (98)
Women who did not give birth in the past 12 months Now married:
24.5% (270)Unmarried:
75.5% (830)
Marital status - Other race population 15 years and over
Males 67.9% Never married30.6% Now married0.0% Separated0.0% Widowed1.4% DivorcedFemales 61.4% Never married25.1% Now married0.0% Separated1.3% Widowed12.2% DivorcedWomen who gave birth in the past 12 months Now married:
6.8% (9)Unmarried:
93.2% (126)
Women who did not give birth in the past 12 months Now married:
28.2% (214)Unmarried:
71.8% (544)
Marital status - Two or more races population 15 years and over
Males 54.2% Never married33.0% Now married0.0% Separated0.6% Widowed12.2% DivorcedFemales 47.3% Never married24.4% Now married2.3% Separated1.6% Widowed24.4% DivorcedWomen who gave birth in the past 12 months Now married:
92.8% (103)Unmarried:
7.2% (8)
Women who did not give birth in the past 12 months Now married:
14.8% (117)Unmarried:
85.2% (673)
Marital status - White alone, not Hispanic / Latino population 15 years and over
Males 35.3% Never married46.9% Now married1.6% Separated4.0% Widowed12.2% DivorcedFemales 29.6% Never married46.0% Now married0.3% Separated7.9% Widowed16.2% DivorcedWomen who gave birth in the past 12 months Now married:
75.2% (80)Unmarried:
24.8% (26)
Women who did not give birth in the past 12 months Now married:
45.9% (977)Unmarried:
54.1% (1,151)
Marital status - Hispanic or Latino population 15 years and over
Males 53.4% Never married37.0% Now married1.9% Separated0.0% Widowed7.6% DivorcedFemales 55.3% Never married30.3% Now married2.7% Separated0.7% Widowed11.0% DivorcedWomen who gave birth in the past 12 months Now married:
39.7% (84)Unmarried:
60.3% (127)
Women who did not give birth in the past 12 months Now married:
29.5% (424)Unmarried:
70.5% (1,015)
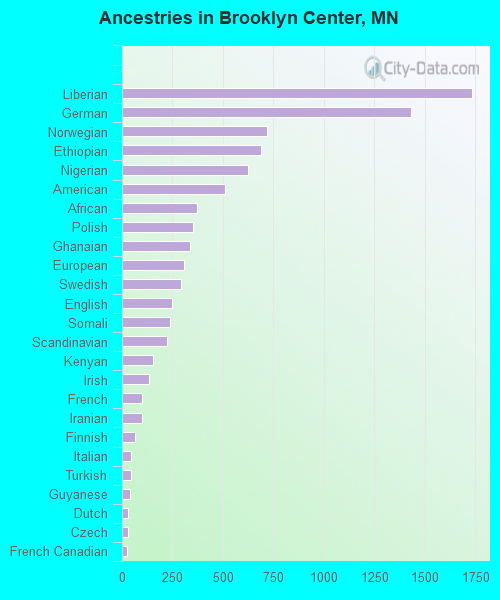
Ancestries in Brooklyn Center
1,731 8.7% Liberian1,429 7.2% German719 3.6% Norwegian687 3.5% Ethiopian624 3.1% Nigerian509 2.6% American369 1.9% African354 1.8% Polish336 1.7% Ghanaian309 1.6% European293 1.5% Swedish247 1.2% English236 1.2% Somali222 1.1% Scandinavian155 0.8% Kenyan133 0.7% Irish101 0.5% French97 0.5% Iranian62 0.3% Finnish46 0.2% Italian46 0.2% Turkish38 0.2% Guyanese31 0.2% Dutch29 0.1% Czech25 0.1% French Canadian18 0.09% Eastern European17 0.09% Latvian17 0.09% Ukrainian16 0.08% West Indian13 0.07% Moroccan13 0.07% Estonian13 0.07% Welsh11 0.06% Lebanese10 0.05% Hungarian8 0.04% Russian7 0.04% Danish6 0.03% British6 0.03% Slovak4 0.02% Swiss4 0.02% Scottish2 0.01% Romanian
Geographical mobility in Brooklyn Center Same house 1 year ago 10,929 90.5% White (Caucasian)8,862 86.9% Black or African American348 100.0% American Indian / Alaska Native3,735 86.0% Asian26 100.0% Native Hawaiian / Pacific Islander2,259 78.5% Other race2,560 92.1% Two or more races10,274 91.1% White alone, not Hispanic / Latino3,834 80.4% Hispanic or LatinoMoved within same county 355 2.9% White / Caucasian464 4.5% Black or African American3 1.0% American Indian / Alaska Native166 3.8% Asian438 15.2% Other race174 6.3% Two or more races341 3.0% White alone, not Hispanic / Latino590 12.4% Hispanic or LatinoMoved within same state 659 5.5% White / Caucasian678 6.6% Black or African American8 2.4% American Indian / Alaska Native334 7.7% Asian71 2.5% Other race31 1.1% Two or more races550 4.9% White alone, not Hispanic / Latino185 3.9% Hispanic or LatinoMoved from different state 174 1.4% White / Caucasian39 0.4% Black or African American10 0.2% Asian1 0.0% Two or more races170 1.5% White alone, not Hispanic / LatinoMoved from abroad 20 0.2% White59 0.6% Black or African American13 0.3% Asian36 1.3% Other race17 0.6% Two or more races21 0.2% White alone, not Hispanic / Latino70 1.5% Hispanic or Latino
Children Nativity (place of birth) in Brooklyn Center
Children under 6 years - Living with two parents Both parents native 339 100.0% NativeBoth parents foreign-born 810 95.3% Native40 4.7% Foreign-bornOne native, one foreign-born parent 273 100.0% NativeChildren under 6 years - Living with one parent Native parent 955 100.0% NativeForeign-born parent 373 79.3% Native97 20.7% Foreign-bornChildren 6 to 17 years - Living with two parents Both parents native 1,083 100.0% NativeBoth parents foreign-born 1,191 73.5% Native430 26.5% Foreign-bornOne native, one foreign-born parent 493 78.3% Native136 21.7% Foreign-bornChildren 6 to 17 years - Living with one parent Native parent 1,015 100.0% NativeForeign-born parent 1,107 58.3% Native792 41.7% Foreign-born
Grandparents responsible for own grandchildren in Brooklyn Center
Grandparents (30 to 59 years) White / Caucasian 4 9.7% Responsible for grandchildren40 90.3% Not responsible for grandchildrenBlack or African American 8 100.0% Responsible for grandchildrenAsian 41 100.0% Not responsible for grandchildrenOther race 27 100.0% Not responsible for grandchildrenTwo or more races 5 64.6% Responsible for grandchildren3 35.4% Not responsible for grandchildrenWhite alone, not Hispanic / Latino 3 6.1% Responsible for grandchildren45 93.9% Not responsible for grandchildrenHispanic or Latino 22 100.0% Not responsible for grandchildrenGrandparents (60 years and over) White / Caucasian 31 29.8% Responsible for grandchildren74 70.2% Not responsible for grandchildrenBlack or African American 9 25.2% Responsible for grandchildren28 74.8% Not responsible for grandchildrenAsian 41 100.0% Not responsible for grandchildrenOther race 15 53.5% Responsible for grandchildren13 46.5% Not responsible for grandchildrenTwo or more races 22 100.0% Not responsible for grandchildrenWhite alone, not Hispanic / Latino 32 29.2% Responsible for grandchildren78 70.8% Not responsible for grandchildrenHispanic or Latino 6 18.2% Responsible for grandchildren27 81.8% Not responsible for grandchildren