Races in Burke Centre, Virginia (VA) Detailed Stats
Data:
Races - White alone (%)
Races - White alone (% change since 2000)
Races - Black alone (%)
Races - Black alone (% change since 2000)
Races - American Indian alone (%)
Races - American Indian alone (% change since 2000)
Races - Asian alone (%)
Races - Asian alone (% change since 2000)
Races - Hispanic (%)
Races - Hispanic (% change since 2000)
Races - Native Hawaiian and Other Pacific Islander alone (%)
Races - Native Hawaiian and Other Pacific Islander alone (% change since 2000)
Races - Two or more races(%)
Races - Two or more races(% change since 2000)
Races - Other race alone (%)
Races - Other race alone (% change since 2000)
Racial diversity
Place of birth - Born in state of residence (%)
Place of birth - Born in state of residence (%) - White
Place of birth - Born in state of residence (%) - Black or African American
Place of birth - Born in state of residence (%) - Asian
Place of birth - Born in state of residence (%) - Hispanic or Latino
Place of birth - Born in state of residence (%) - American Indian and Alaska Native
Place of birth - Born in state of residence (%) - Multirace
Place of birth - Born in state of residence (%) - Other Race
Place of birth - Born in other state (%)
Place of birth - Born in other state (%) - White
Place of birth - Born in other state (%) - Black or African American
Place of birth - Born in other state (%) - Asian
Place of birth - Born in other state (%) - Hispanic or Latino
Place of birth - Born in other state (%) - American Indian and Alaska Native
Place of birth - Born in other state (%) - Multirace
Place of birth - Born in other state (%) - Other Race
Place of birth - Native, outside of US (%)
Place of birth - Native, outside of US (%) - White
Place of birth - Native, outside of US (%) - Black or African American
Place of birth - Native, outside of US (%) - Asian
Place of birth - Native, outside of US (%) - Hispanic or Latino
Place of birth - Native, outside of US (%) - American Indian and Alaska Native
Place of birth - Native, outside of US (%) - Multirace
Place of birth - Native, outside of US (%) - Other Race
Place of birth - Foreign born (%)
Place of birth - Foreign born (%) - White
Place of birth - Foreign born (%) - Black or African American
Place of birth - Foreign born (%) - Asian
Place of birth - Foreign born (%) - Hispanic or Latino
Place of birth - Foreign born (%) - American Indian and Alaska Native
Place of birth - Foreign born (%) - Multirace
Place of birth - Foreign born (%) - Other Race
Residents speaking English at home (%)
Residents speaking English at home - Born in the United States (%)
Residents speaking English at home - Native, born elsewhere (%)
Residents speaking English at home - Foreign born (%)
Residents speaking Spanish at home (%)
Residents speaking Spanish at home - Born in the United States (%)
Residents speaking Spanish at home - Native, born elsewhere (%)
Residents speaking Spanish at home - Foreign born (%)
Residents speaking other language at home (%)
Residents speaking other language at home - Born in the United States (%)
Residents speaking other language at home - Native, born elsewhere (%)
Residents speaking other language at home - Foreign born (%)
Marital status - Never married (%)
Marital status - Now married (%)
Marital status - Separated (%)
Marital status - Widowed (%)
Marital status - Divorced (%)
Ancestries Reported - Arab (%)
Ancestries Reported - Czech (%)
Ancestries Reported - Danish (%)
Ancestries Reported - Dutch (%)
Ancestries Reported - English (%)
Ancestries Reported - French (%)
Ancestries Reported - French Canadian (%)
Ancestries Reported - German (%)
Ancestries Reported - Greek (%)
Ancestries Reported - Hungarian (%)
Ancestries Reported - Irish (%)
Ancestries Reported - Italian (%)
Ancestries Reported - Lithuanian (%)
Ancestries Reported - Norwegian (%)
Ancestries Reported - Polish (%)
Ancestries Reported - Portuguese (%)
Ancestries Reported - Russian (%)
Ancestries Reported - Scotch-Irish (%)
Ancestries Reported - Scottish (%)
Ancestries Reported - Slovak (%)
Ancestries Reported - Subsaharan African (%)
Ancestries Reported - Swedish (%)
Ancestries Reported - Swiss (%)
Ancestries Reported - Ukrainian (%)
Ancestries Reported - United States (%)
Ancestries Reported - Welsh (%)
Ancestries Reported - West Indian (%)
Ancestries Reported - Other (%)
Geographical mobility - Same house 1 year ago (%)
Geographical mobility - Same house 1 year ago (%) - White
Geographical mobility - Same house 1 year ago (%) - Black or African American
Geographical mobility - Same house 1 year ago (%) - Asian
Geographical mobility - Same house 1 year ago (%) - Hispanic or Latino
Geographical mobility - Same house 1 year ago (%) - American Indian and Alaska Native
Geographical mobility - Same house 1 year ago (%) - Multirace
Geographical mobility - Same house 1 year ago (%) - Other Race
Geographical mobility - Moved within same county (%)
Geographical mobility - Moved within same county (%) - White
Geographical mobility - Moved within same county (%) - Black or African American
Geographical mobility - Moved within same county (%) - Asian
Geographical mobility - Moved within same county (%) - Hispanic or Latino
Geographical mobility - Moved within same county (%) - American Indian and Alaska Native
Geographical mobility - Moved within same county (%) - Multirace
Geographical mobility - Moved within same county (%) - Other Race
Geographical mobility - Moved from different county within same state (%)
Geographical mobility - Moved from different county within same state (%) - White
Geographical mobility - Moved from different county within same state (%) - Black or African American
Geographical mobility - Moved from different county within same state (%) - Asian
Geographical mobility - Moved from different county within same state (%) - Hispanic or Latino
Geographical mobility - Moved from different county within same state (%) - American Indian and Alaska Native
Geographical mobility - Moved from different county within same state (%) - Multirace
Geographical mobility - Moved from different county within same state (%) - Other Race
Geographical mobility - Moved from different state (%)
Geographical mobility - Moved from different state (%) - White
Geographical mobility - Moved from different state (%) - Black or African American
Geographical mobility - Moved from different state (%) - Asian
Geographical mobility - Moved from different state (%) - Hispanic or Latino
Geographical mobility - Moved from different state (%) - American Indian and Alaska Native
Geographical mobility - Moved from different state (%) - Multirace
Geographical mobility - Moved from different state (%) - Other Race
Geographical mobility - Moved from abroad (%)
Geographical mobility - Moved from abroad (%) - White
Geographical mobility - Moved from abroad (%) - Black or African American
Geographical mobility - Moved from abroad (%) - Asian
Geographical mobility - Moved from abroad (%) - Hispanic or Latino
Geographical mobility - Moved from abroad (%) - American Indian and Alaska Native
Geographical mobility - Moved from abroad (%) - Multirace
Geographical mobility - Moved from abroad (%) - Other Race
Place of birth for the foreign-born population - Ireland (%)
Place of birth for the foreign-born population - Denmark (%)
Place of birth for the foreign-born population - Norway (%)
Place of birth for the foreign-born population - Sweden (%)
Place of birth for the foreign-born population - United Kingdom (%)
Place of birth for the foreign-born population - England (%)
Place of birth for the foreign-born population - Scotland (%)
Place of birth for the foreign-born population - Other Northern Europe (%)
Place of birth for the foreign-born population - Austria (%)
Place of birth for the foreign-born population - Belgium (%)
Place of birth for the foreign-born population - France (%)
Place of birth for the foreign-born population - Germany (%)
Place of birth for the foreign-born population - Netherlands (%)
Place of birth for the foreign-born population - Switzerland (%)
Place of birth for the foreign-born population - Other Western Europe (%)
Place of birth for the foreign-born population - Greece (%)
Place of birth for the foreign-born population - Italy (%)
Place of birth for the foreign-born population - Portugal (%)
Place of birth for the foreign-born population - Spain (%)
Place of birth for the foreign-born population - Other Southern Europe (%)
Place of birth for the foreign-born population - Albania (%)
Place of birth for the foreign-born population - Belarus (%)
Place of birth for the foreign-born population - Bosnia and Herzegovina (%)
Place of birth for the foreign-born population - Bulgaria (%)
Place of birth for the foreign-born population - Croatia (%)
Place of birth for the foreign-born population - Czechoslovakia (%)
Place of birth for the foreign-born population - Hungary (%)
Place of birth for the foreign-born population - Latvia (%)
Place of birth for the foreign-born population - Lithuania (%)
Place of birth for the foreign-born population - North Macedonia (Macedonia) (%)
Place of birth for the foreign-born population - Moldova (%)
Place of birth for the foreign-born population - Poland (%)
Place of birth for the foreign-born population - Romania (%)
Place of birth for the foreign-born population - Russia (%)
Place of birth for the foreign-born population - Serbia (%)
Place of birth for the foreign-born population - Ukraine (%)
Place of birth for the foreign-born population - Other Eastern Europe (%)
Place of birth for the foreign-born population - China (%)
Place of birth for the foreign-born population - Hong Kong (%)
Place of birth for the foreign-born population - Taiwan (%)
Place of birth for the foreign-born population - Japan (%)
Place of birth for the foreign-born population - Korea (%)
Place of birth for the foreign-born population - Other Eastern Asia (%)
Place of birth for the foreign-born population - Afghanistan (%)
Place of birth for the foreign-born population - Bangladesh (%)
Place of birth for the foreign-born population - India (%)
Place of birth for the foreign-born population - Iran (%)
Place of birth for the foreign-born population - Kazakhstan (%)
Place of birth for the foreign-born population - Nepal (%)
Place of birth for the foreign-born population - Pakistan (%)
Place of birth for the foreign-born population - Sri Lanka (%)
Place of birth for the foreign-born population - Uzbekistan (%)
Place of birth for the foreign-born population - Other South Central Asia (%)
Place of birth for the foreign-born population - Burma (%)
Place of birth for the foreign-born population - Cambodia (%)
Place of birth for the foreign-born population - Indonesia (%)
Place of birth for the foreign-born population - Laos (%)
Place of birth for the foreign-born population - Malaysia (%)
Place of birth for the foreign-born population - Philippines (%)
Place of birth for the foreign-born population - Singapore (%)
Place of birth for the foreign-born population - Thailand (%)
Place of birth for the foreign-born population - Vietnam (%)
Place of birth for the foreign-born population - Other South Eastern Asia (%)
Place of birth for the foreign-born population - Armenia (%)
Place of birth for the foreign-born population - Iraq (%)
Place of birth for the foreign-born population - Israel (%)
Place of birth for the foreign-born population - Jordan (%)
Place of birth for the foreign-born population - Kuwait (%)
Place of birth for the foreign-born population - Lebanon (%)
Place of birth for the foreign-born population - Saudi Arabia (%)
Place of birth for the foreign-born population - Syria (%)
Place of birth for the foreign-born population - Turkey (%)
Place of birth for the foreign-born population - Yemen (%)
Place of birth for the foreign-born population - Other Western Asia (%)
Place of birth for the foreign-born population - Eritrea (%)
Place of birth for the foreign-born population - Ethiopia (%)
Place of birth for the foreign-born population - Kenya (%)
Place of birth for the foreign-born population - Somalia (%)
Place of birth for the foreign-born population - Uganda (%)
Place of birth for the foreign-born population - Zimbabwe (%)
Place of birth for the foreign-born population - Other Eastern Africa (%)
Place of birth for the foreign-born population - Cameroon (%)
Place of birth for the foreign-born population - Congo (%)
Place of birth for the foreign-born population - Democratic Republic of Congo (Zaire) (%)
Place of birth for the foreign-born population - Other Middle Africa (%)
Place of birth for the foreign-born population - Egypt (%)
Place of birth for the foreign-born population - Morocco (%)
Place of birth for the foreign-born population - Sudan (%)
Place of birth for the foreign-born population - Other Northern Africa (%)
Place of birth for the foreign-born population - South Africa (%)
Place of birth for the foreign-born population - Other Southern Africa (%)
Place of birth for the foreign-born population - Cabo Verde (%)
Place of birth for the foreign-born population - Ghana (%)
Place of birth for the foreign-born population - Liberia (%)
Place of birth for the foreign-born population - Nigeria (%)
Place of birth for the foreign-born population - Senegal (%)
Place of birth for the foreign-born population - Sierra Leone (%)
Place of birth for the foreign-born population - Other Western Africa (%)
Place of birth for the foreign-born population - Australia (%)
Place of birth for the foreign-born population - New Zealand (%)
Place of birth for the foreign-born population - Fiji (%)
Place of birth for the foreign-born population - Micronesia (%)
Place of birth for the foreign-born population - Bahamas (%)
Place of birth for the foreign-born population - Barbados (%)
Place of birth for the foreign-born population - Cuba (%)
Place of birth for the foreign-born population - Dominica (%)
Place of birth for the foreign-born population - Dominican Republic (%)
Place of birth for the foreign-born population - Grenada (%)
Place of birth for the foreign-born population - Haiti (%)
Place of birth for the foreign-born population - Jamaica (%)
Place of birth for the foreign-born population - St. Vincent and the Grenadines (%)
Place of birth for the foreign-born population - Trinidad and Tobago (%)
Place of birth for the foreign-born population - West Indies (%)
Place of birth for the foreign-born population - Other Caribbean (%)
Place of birth for the foreign-born population - Belize (%)
Place of birth for the foreign-born population - Costa Rica (%)
Place of birth for the foreign-born population - El Salvador (%)
Place of birth for the foreign-born population - Guatemala (%)
Place of birth for the foreign-born population - Honduras (%)
Place of birth for the foreign-born population - Mexico (%)
Place of birth for the foreign-born population - Nicaragua (%)
Place of birth for the foreign-born population - Panama (%)
Place of birth for the foreign-born population - Other Central America (%)
Place of birth for the foreign-born population - Argentina (%)
Place of birth for the foreign-born population - Bolivia (%)
Place of birth for the foreign-born population - Brazil (%)
Place of birth for the foreign-born population - Chile (%)
Place of birth for the foreign-born population - Colombia (%)
Place of birth for the foreign-born population - Ecuador (%)
Place of birth for the foreign-born population - Guyana (%)
Place of birth for the foreign-born population - Peru (%)
Place of birth for the foreign-born population - Uruguay (%)
Place of birth for the foreign-born population - Venezuela (%)
Place of birth for the foreign-born population - Other South America (%)
Place of birth for the foreign-born population - Canada (%)
Place of birth for the foreign-born population - Other Northern America (%)
Place of birth for the foreign-born population - Other (%)
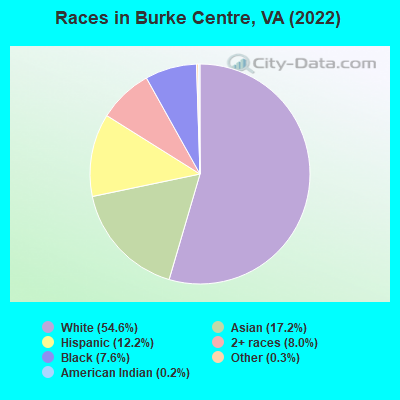
According to 2022 data, the most numerous races in Burke Centre, VA are White alone (9,721 residents), Black alone (1,348 residents), and Hispanic (2,167 residents). 70.8% of Burke Centre residents speak English at home.
Race distribution in Burke Centre 9,721 54.6% White alone 3,057 17.2% Asian alone 2,167 12.2% Hispanic 1,432 8.0% Two or more races 1,348 7.6% Black alone 48 0.3% Other race alone 30 0.2% American Indian alone
2000 2022
4,965,637 70.2% White alone 1,376,378 19.4% Black alone 329,540 4.7% Hispanic 259,277 3.7% Asian alone 114,022 1.6% Two or more races 18,596 0.3% American Indian alone 11,685 0.2% Other race alone 3,380 0.05% Native Hawaiian and Other
5,095,130 58.7% White alone 1,594,785 18.4% Black alone 905,750 10.4% Hispanic 602,881 6.9% Asian alone 406,047 4.7% Two or more races 60,419 0.7% Other race alone 11,738 0.1% American Indian alone 6,869 0.08% Native Hawaiian and Other
Income and house value in Burke Centre Median household income in 2022 $167,357 White non-Hispanic householders$138,515 Black householders$111,339 Asian householders$98,362 Some other race householders$163,307 Two or more races householders$102,461 Hispanic or Latino race householders
Median age by race in Burke Centre
41.7 Median age for White residents38.0 44.9 39.1 Median age for Black or African American residents35.2 43.9 46.6 Median age for American Indian / Alaska Native residents-964,539,006.1 -669,005,847.3 39.4 Median age for Asian residents36.7 41.5 -666,666,666.0 Median age for Native Hawaiian / Pacific Islander residents-558,791,801.0 -584,518,166.9 39.1 Median age for Other race residents33.9 39.8 24.9 Median age for Two or more races residents34.2 21.5 42.0 Median age for White alone residents38.6 44.6 30.0 Median age for Hispanic or Latino residents26.8 33.0
Owner/renter occupied households by race in Burke Centre
House owners and renters - White residents 3,260 81.7% Owner occupied732 18.3% Renter occupiedHouse owners and renters - Black or African American residents 269 58.6% Owner occupied190 41.4% Renter occupiedHouse owners and renters - American Indian / Alaska Native residents 7 100.0% Owner occupiedHouse owners and renters - Asian residents 725 82.7% Owner occupied152 17.3% Renter occupiedHouse owners and renters - Other race residents 96 63.7% Owner occupied55 36.3% Renter occupiedHouse owners and renters - Two or more races residents 502 66.4% Owner occupied254 33.6% Renter occupiedHouse owners and renters - White alone residents 3,186 82.3% Owner occupied684 17.7% Renter occupiedHouse owners and renters - Hispanic or Latino residents 414 66.5% Owner occupied208 33.5% Renter occupied
Language usage in Burke Centre
English speakers - Total 70.8% of residents of Burke Centre speak English at home.
7.9% of residents speak Spanish at home 922 68.8% Speak English very well418 31.2% Speak English less than very well21.6% of residents speak other language at home 2,421 65.9% Speak English very well1,252 34.1% Speak English less than very well
English speakers - Born in the United States 90.3% of residents of Burke Centre speak English at home.
3.0% of residents speak Spanish at home 182 79.5% Speak English very well47 20.5% Speak English less than very well6.6% of residents speak other language at home 452 90.2% Speak English very well49 9.8% Speak English less than very well
English speakers - Native, born elsewhere 71.9% of residents of Burke Centre speak English at home.
16.4% of residents speak Spanish at home 65 54.6% Speak English very well54 45.4% Speak English less than very well10.3% of residents speak other language at home 65 86.7% Speak English very well10 13.3% Speak English less than very well
English speakers - Foreign-born 11.7% of residents of Burke Centre speak English at home.
19.6% of residents speak Spanish at home 432 58.0% Speak English very well313 42.0% Speak English less than very well68.0% of residents speak other language at home 1,478 57.3% Speak English very well1,102 42.7% Speak English less than very well
White (Caucasian) - Speak only English Native:
95.8% (8,697)Foreign-born:
17.6% (107)
White (Caucasian) - Speak another language Native:
4.8% (440)Foreign-born:
79.5% (483)
Black or African American - Speak only English Native:
86.0% (758)Foreign-born:
39.9% (187)
Black or African American - Speak another language Native:
14.5% (128)Foreign-born:
63.8% (300)
Asian - Speak only English Native:
48.8% (540)Foreign-born:
4.8% (93)
Asian - Speak another language Native:
51.2% (566)Foreign-born:
94.0% (1,824)
Other race - Speak only English Native:
56.6% (127)Foreign-born:
16.2% (44)
Other race - Speak another language Native:
47.4% (107)Foreign-born:
85.5% (233)
Two or more races - Speak only English Native:
73.9% (1,418)Foreign-born:
7.3% (33)
Two or more races - Speak another language Native:
26.0% (500)Foreign-born:
92.8% (424)
White alone - Speak only English Native:
96.3% (8,565)Foreign-born:
20.3% (103)
White alone - Speak another language Native:
3.9% (343)Foreign-born:
78.6% (398)
Hispanic or Latino - Speak only English Native:
59.5% (737)Foreign-born:
5.6% (42)
Hispanic or Latino - Speak another language Native:
42.7% (529)Foreign-born:
94.4% (710)
Foreign-born residents in Burke Centre
Marital status for residents in Burke Centre Marital status - White (Caucasian) population 15 years and over
Males 31.5% Never married62.4% Now married1.0% Separated1.6% Widowed3.5% DivorcedFemales 25.1% Never married52.9% Now married0.8% Separated7.8% Widowed13.5% DivorcedWomen who gave birth in the past 12 months Now married:
100.0% (82)Unmarried:
0.0% (0)
Women who did not give birth in the past 12 months Now married:
46.6% (1,008)Unmarried:
53.4% (1,154)
Marital status - Black or African American population 15 years and over
Males 40.6% Never married51.4% Now married0.0% Separated0.0% Widowed7.9% DivorcedFemales 33.9% Never married43.7% Now married2.2% Separated1.4% Widowed18.7% DivorcedWomen who gave birth in the past 12 months Now married:
100.0% (21)Unmarried:
0.0% (0)
Women who did not give birth in the past 12 months Now married:
26.5% (85)Unmarried:
73.5% (236)
Marital status - American Indian / Alaska Native population 15 years and over
Males 0.0% Never married100.0% Now married0.0% Separated0.0% Widowed0.0% DivorcedFemales 68.8% Never married31.2% Now married0.0% Separated0.0% Widowed0.0% DivorcedWomen who did not give birth in the past 12 months Now married:
31.2% (5)Unmarried:
68.8% (12)
Marital status - Asian population 15 years and over
Males 45.0% Never married49.3% Now married0.7% Separated0.0% Widowed5.0% DivorcedFemales 24.5% Never married57.8% Now married2.1% Separated8.6% Widowed7.0% DivorcedWomen who gave birth in the past 12 months Now married:
100.0% (20)Unmarried:
0.0% (0)
Women who did not give birth in the past 12 months Now married:
50.0% (428)Unmarried:
50.0% (428)
Marital status - Other race population 15 years and over
Males 36.0% Never married54.3% Now married0.0% Separated0.0% Widowed9.8% DivorcedFemales 20.9% Never married58.2% Now married0.0% Separated0.0% Widowed20.9% DivorcedWomen who gave birth in the past 12 months Now married:
100.0% (20)Unmarried:
0.0% (0)
Women who did not give birth in the past 12 months Now married:
48.7% (70)Unmarried:
51.3% (74)
Marital status - Two or more races population 15 years and over
Males 49.5% Never married43.8% Now married2.4% Separated0.0% Widowed4.3% DivorcedFemales 35.2% Never married52.9% Now married5.3% Separated2.4% Widowed4.3% DivorcedWomen who did not give birth in the past 12 months Now married:
54.7% (333)Unmarried:
45.3% (275)
Marital status - White alone, not Hispanic / Latino population 15 years and over
Males 29.8% Never married63.7% Now married1.1% Separated1.8% Widowed3.7% DivorcedFemales 24.7% Never married53.6% Now married0.8% Separated7.7% Widowed13.2% DivorcedWomen who gave birth in the past 12 months Now married:
100.0% (65)Unmarried:
0.0% (0)
Women who did not give birth in the past 12 months Now married:
47.0% (1,013)Unmarried:
53.0% (1,141)
Marital status - Hispanic or Latino population 15 years and over
Males 39.7% Never married54.3% Now married1.7% Separated0.0% Widowed4.3% DivorcedFemales 29.0% Never married47.8% Now married4.0% Separated4.5% Widowed14.7% DivorcedWomen who gave birth in the past 12 months Now married:
100.0% (41)Unmarried:
0.0% (0)
Women who did not give birth in the past 12 months Now married:
46.3% (235)Unmarried:
53.7% (273)
Ancestries in Burke Centre
581 6.8% English477 5.6% Afghan466 5.5% Irish455 5.4% European337 4.0% American323 3.8% German239 2.8% Polish165 1.9% Ethiopian162 1.9% Italian137 1.6% Jamaican101 1.2% Somali94 1.1% African88 1.0% Austrian70 0.8% Iranian70 0.8% Ghanaian65 0.8% Scotch-Irish61 0.7% Swedish48 0.6% Iraqi40 0.5% Egyptian40 0.5% French39 0.5% Greek38 0.4% Norwegian36 0.4% French Canadian36 0.4% West Indian33 0.4% Jordanian31 0.4% South African29 0.3% British28 0.3% Eastern European26 0.3% Finnish21 0.2% Russian21 0.2% Ukrainian20 0.2% Scottish18 0.2% Armenian17 0.2% Pennsylvania German17 0.2% Sierra Leonean12 0.1% Belgian12 0.1% Slovene11 0.1% Scandinavian10 0.1% Swiss9 0.1% Croatian8 0.09% Lebanese7 0.08% Bulgarian6 0.07% Canadian5 0.06% Hungarian4 0.05% Brazilian2 0.02% Trinidadian and Tobagonian
Geographical mobility in Burke Centre Same house 1 year ago 8,379 85.3% White (Caucasian)1,167 83.1% Black or African American14 52.1% American Indian / Alaska Native2,710 87.1% Asian377 75.5% Other race1,974 75.1% Two or more races8,341 86.2% White alone, not Hispanic / Latino1,607 77.3% Hispanic or LatinoMoved within same county 723 7.4% White / Caucasian59 4.2% Black or African American167 5.3% Asian28 5.5% Other race120 4.6% Two or more races662 6.8% White alone, not Hispanic / Latino225 10.8% Hispanic or LatinoMoved within same state 275 2.8% White / Caucasian107 7.6% Black or African American48 9.6% Other race72 2.7% Two or more races281 2.9% White alone, not Hispanic / Latino80 3.9% Hispanic or LatinoMoved from different state 341 3.5% White / Caucasian24 1.7% Black or African American11 41.3% American Indian / Alaska Native156 5.0% Asian35 7.0% Other race363 13.8% Two or more races277 2.9% White alone, not Hispanic / Latino185 8.9% Hispanic or LatinoMoved from abroad 96 1.0% White62 2.0% Asian65 2.5% Two or more races108 1.1% White alone, not Hispanic / Latino10 0.5% Hispanic or Latino
Children Nativity (place of birth) in Burke Centre
Children under 6 years - Living with two parents Both parents native 592 100.0% NativeBoth parents foreign-born 240 93.0% Native18 7.0% Foreign-bornOne native, one foreign-born parent 118 100.0% NativeChildren under 6 years - Living with one parent Native parent 22 100.0% NativeForeign-born parent 28 72.9% Native10 27.1% Foreign-bornChildren 6 to 17 years - Living with two parents Both parents native 1,502 100.0% NativeBoth parents foreign-born 311 80.9% Native74 19.1% Foreign-bornOne native, one foreign-born parent 234 100.0% NativeChildren 6 to 17 years - Living with one parent Native parent 422 100.0% NativeForeign-born parent 214 54.5% Native179 45.5% Foreign-born
Grandparents responsible for own grandchildren in Burke Centre
Grandparents (30 to 59 years) Asian 4 100.0% Not responsible for grandchildrenTwo or more races 20 100.0% Not responsible for grandchildrenHispanic or Latino 12 100.0% Not responsible for grandchildren
Grandparents (60 years and over) Asian 155 100.0% Not responsible for grandchildrenHispanic or Latino 17 100.0% Not responsible for grandchildren