Races in Cascades, Virginia (VA) Detailed Stats
Data:
Races - White alone (%)
Races - White alone (% change since 2000)
Races - Black alone (%)
Races - Black alone (% change since 2000)
Races - American Indian alone (%)
Races - American Indian alone (% change since 2000)
Races - Asian alone (%)
Races - Asian alone (% change since 2000)
Races - Hispanic (%)
Races - Hispanic (% change since 2000)
Races - Native Hawaiian and Other Pacific Islander alone (%)
Races - Native Hawaiian and Other Pacific Islander alone (% change since 2000)
Races - Two or more races(%)
Races - Two or more races(% change since 2000)
Races - Other race alone (%)
Races - Other race alone (% change since 2000)
Racial diversity
Place of birth - Born in state of residence (%)
Place of birth - Born in state of residence (%) - White
Place of birth - Born in state of residence (%) - Black or African American
Place of birth - Born in state of residence (%) - Asian
Place of birth - Born in state of residence (%) - Hispanic or Latino
Place of birth - Born in state of residence (%) - American Indian and Alaska Native
Place of birth - Born in state of residence (%) - Multirace
Place of birth - Born in state of residence (%) - Other Race
Place of birth - Born in other state (%)
Place of birth - Born in other state (%) - White
Place of birth - Born in other state (%) - Black or African American
Place of birth - Born in other state (%) - Asian
Place of birth - Born in other state (%) - Hispanic or Latino
Place of birth - Born in other state (%) - American Indian and Alaska Native
Place of birth - Born in other state (%) - Multirace
Place of birth - Born in other state (%) - Other Race
Place of birth - Native, outside of US (%)
Place of birth - Native, outside of US (%) - White
Place of birth - Native, outside of US (%) - Black or African American
Place of birth - Native, outside of US (%) - Asian
Place of birth - Native, outside of US (%) - Hispanic or Latino
Place of birth - Native, outside of US (%) - American Indian and Alaska Native
Place of birth - Native, outside of US (%) - Multirace
Place of birth - Native, outside of US (%) - Other Race
Place of birth - Foreign born (%)
Place of birth - Foreign born (%) - White
Place of birth - Foreign born (%) - Black or African American
Place of birth - Foreign born (%) - Asian
Place of birth - Foreign born (%) - Hispanic or Latino
Place of birth - Foreign born (%) - American Indian and Alaska Native
Place of birth - Foreign born (%) - Multirace
Place of birth - Foreign born (%) - Other Race
Residents speaking English at home (%)
Residents speaking English at home - Born in the United States (%)
Residents speaking English at home - Native, born elsewhere (%)
Residents speaking English at home - Foreign born (%)
Residents speaking Spanish at home (%)
Residents speaking Spanish at home - Born in the United States (%)
Residents speaking Spanish at home - Native, born elsewhere (%)
Residents speaking Spanish at home - Foreign born (%)
Residents speaking other language at home (%)
Residents speaking other language at home - Born in the United States (%)
Residents speaking other language at home - Native, born elsewhere (%)
Residents speaking other language at home - Foreign born (%)
Marital status - Never married (%)
Marital status - Now married (%)
Marital status - Separated (%)
Marital status - Widowed (%)
Marital status - Divorced (%)
Ancestries Reported - Arab (%)
Ancestries Reported - Czech (%)
Ancestries Reported - Danish (%)
Ancestries Reported - Dutch (%)
Ancestries Reported - English (%)
Ancestries Reported - French (%)
Ancestries Reported - French Canadian (%)
Ancestries Reported - German (%)
Ancestries Reported - Greek (%)
Ancestries Reported - Hungarian (%)
Ancestries Reported - Irish (%)
Ancestries Reported - Italian (%)
Ancestries Reported - Lithuanian (%)
Ancestries Reported - Norwegian (%)
Ancestries Reported - Polish (%)
Ancestries Reported - Portuguese (%)
Ancestries Reported - Russian (%)
Ancestries Reported - Scotch-Irish (%)
Ancestries Reported - Scottish (%)
Ancestries Reported - Slovak (%)
Ancestries Reported - Subsaharan African (%)
Ancestries Reported - Swedish (%)
Ancestries Reported - Swiss (%)
Ancestries Reported - Ukrainian (%)
Ancestries Reported - United States (%)
Ancestries Reported - Welsh (%)
Ancestries Reported - West Indian (%)
Ancestries Reported - Other (%)
Geographical mobility - Same house 1 year ago (%)
Geographical mobility - Same house 1 year ago (%) - White
Geographical mobility - Same house 1 year ago (%) - Black or African American
Geographical mobility - Same house 1 year ago (%) - Asian
Geographical mobility - Same house 1 year ago (%) - Hispanic or Latino
Geographical mobility - Same house 1 year ago (%) - American Indian and Alaska Native
Geographical mobility - Same house 1 year ago (%) - Multirace
Geographical mobility - Same house 1 year ago (%) - Other Race
Geographical mobility - Moved within same county (%)
Geographical mobility - Moved within same county (%) - White
Geographical mobility - Moved within same county (%) - Black or African American
Geographical mobility - Moved within same county (%) - Asian
Geographical mobility - Moved within same county (%) - Hispanic or Latino
Geographical mobility - Moved within same county (%) - American Indian and Alaska Native
Geographical mobility - Moved within same county (%) - Multirace
Geographical mobility - Moved within same county (%) - Other Race
Geographical mobility - Moved from different county within same state (%)
Geographical mobility - Moved from different county within same state (%) - White
Geographical mobility - Moved from different county within same state (%) - Black or African American
Geographical mobility - Moved from different county within same state (%) - Asian
Geographical mobility - Moved from different county within same state (%) - Hispanic or Latino
Geographical mobility - Moved from different county within same state (%) - American Indian and Alaska Native
Geographical mobility - Moved from different county within same state (%) - Multirace
Geographical mobility - Moved from different county within same state (%) - Other Race
Geographical mobility - Moved from different state (%)
Geographical mobility - Moved from different state (%) - White
Geographical mobility - Moved from different state (%) - Black or African American
Geographical mobility - Moved from different state (%) - Asian
Geographical mobility - Moved from different state (%) - Hispanic or Latino
Geographical mobility - Moved from different state (%) - American Indian and Alaska Native
Geographical mobility - Moved from different state (%) - Multirace
Geographical mobility - Moved from different state (%) - Other Race
Geographical mobility - Moved from abroad (%)
Geographical mobility - Moved from abroad (%) - White
Geographical mobility - Moved from abroad (%) - Black or African American
Geographical mobility - Moved from abroad (%) - Asian
Geographical mobility - Moved from abroad (%) - Hispanic or Latino
Geographical mobility - Moved from abroad (%) - American Indian and Alaska Native
Geographical mobility - Moved from abroad (%) - Multirace
Geographical mobility - Moved from abroad (%) - Other Race
Place of birth for the foreign-born population - Ireland (%)
Place of birth for the foreign-born population - Denmark (%)
Place of birth for the foreign-born population - Norway (%)
Place of birth for the foreign-born population - Sweden (%)
Place of birth for the foreign-born population - United Kingdom (%)
Place of birth for the foreign-born population - England (%)
Place of birth for the foreign-born population - Scotland (%)
Place of birth for the foreign-born population - Other Northern Europe (%)
Place of birth for the foreign-born population - Austria (%)
Place of birth for the foreign-born population - Belgium (%)
Place of birth for the foreign-born population - France (%)
Place of birth for the foreign-born population - Germany (%)
Place of birth for the foreign-born population - Netherlands (%)
Place of birth for the foreign-born population - Switzerland (%)
Place of birth for the foreign-born population - Other Western Europe (%)
Place of birth for the foreign-born population - Greece (%)
Place of birth for the foreign-born population - Italy (%)
Place of birth for the foreign-born population - Portugal (%)
Place of birth for the foreign-born population - Spain (%)
Place of birth for the foreign-born population - Other Southern Europe (%)
Place of birth for the foreign-born population - Albania (%)
Place of birth for the foreign-born population - Belarus (%)
Place of birth for the foreign-born population - Bosnia and Herzegovina (%)
Place of birth for the foreign-born population - Bulgaria (%)
Place of birth for the foreign-born population - Croatia (%)
Place of birth for the foreign-born population - Czechoslovakia (%)
Place of birth for the foreign-born population - Hungary (%)
Place of birth for the foreign-born population - Latvia (%)
Place of birth for the foreign-born population - Lithuania (%)
Place of birth for the foreign-born population - North Macedonia (Macedonia) (%)
Place of birth for the foreign-born population - Moldova (%)
Place of birth for the foreign-born population - Poland (%)
Place of birth for the foreign-born population - Romania (%)
Place of birth for the foreign-born population - Russia (%)
Place of birth for the foreign-born population - Serbia (%)
Place of birth for the foreign-born population - Ukraine (%)
Place of birth for the foreign-born population - Other Eastern Europe (%)
Place of birth for the foreign-born population - China (%)
Place of birth for the foreign-born population - Hong Kong (%)
Place of birth for the foreign-born population - Taiwan (%)
Place of birth for the foreign-born population - Japan (%)
Place of birth for the foreign-born population - Korea (%)
Place of birth for the foreign-born population - Other Eastern Asia (%)
Place of birth for the foreign-born population - Afghanistan (%)
Place of birth for the foreign-born population - Bangladesh (%)
Place of birth for the foreign-born population - India (%)
Place of birth for the foreign-born population - Iran (%)
Place of birth for the foreign-born population - Kazakhstan (%)
Place of birth for the foreign-born population - Nepal (%)
Place of birth for the foreign-born population - Pakistan (%)
Place of birth for the foreign-born population - Sri Lanka (%)
Place of birth for the foreign-born population - Uzbekistan (%)
Place of birth for the foreign-born population - Other South Central Asia (%)
Place of birth for the foreign-born population - Burma (%)
Place of birth for the foreign-born population - Cambodia (%)
Place of birth for the foreign-born population - Indonesia (%)
Place of birth for the foreign-born population - Laos (%)
Place of birth for the foreign-born population - Malaysia (%)
Place of birth for the foreign-born population - Philippines (%)
Place of birth for the foreign-born population - Singapore (%)
Place of birth for the foreign-born population - Thailand (%)
Place of birth for the foreign-born population - Vietnam (%)
Place of birth for the foreign-born population - Other South Eastern Asia (%)
Place of birth for the foreign-born population - Armenia (%)
Place of birth for the foreign-born population - Iraq (%)
Place of birth for the foreign-born population - Israel (%)
Place of birth for the foreign-born population - Jordan (%)
Place of birth for the foreign-born population - Kuwait (%)
Place of birth for the foreign-born population - Lebanon (%)
Place of birth for the foreign-born population - Saudi Arabia (%)
Place of birth for the foreign-born population - Syria (%)
Place of birth for the foreign-born population - Turkey (%)
Place of birth for the foreign-born population - Yemen (%)
Place of birth for the foreign-born population - Other Western Asia (%)
Place of birth for the foreign-born population - Eritrea (%)
Place of birth for the foreign-born population - Ethiopia (%)
Place of birth for the foreign-born population - Kenya (%)
Place of birth for the foreign-born population - Somalia (%)
Place of birth for the foreign-born population - Uganda (%)
Place of birth for the foreign-born population - Zimbabwe (%)
Place of birth for the foreign-born population - Other Eastern Africa (%)
Place of birth for the foreign-born population - Cameroon (%)
Place of birth for the foreign-born population - Congo (%)
Place of birth for the foreign-born population - Democratic Republic of Congo (Zaire) (%)
Place of birth for the foreign-born population - Other Middle Africa (%)
Place of birth for the foreign-born population - Egypt (%)
Place of birth for the foreign-born population - Morocco (%)
Place of birth for the foreign-born population - Sudan (%)
Place of birth for the foreign-born population - Other Northern Africa (%)
Place of birth for the foreign-born population - South Africa (%)
Place of birth for the foreign-born population - Other Southern Africa (%)
Place of birth for the foreign-born population - Cabo Verde (%)
Place of birth for the foreign-born population - Ghana (%)
Place of birth for the foreign-born population - Liberia (%)
Place of birth for the foreign-born population - Nigeria (%)
Place of birth for the foreign-born population - Senegal (%)
Place of birth for the foreign-born population - Sierra Leone (%)
Place of birth for the foreign-born population - Other Western Africa (%)
Place of birth for the foreign-born population - Australia (%)
Place of birth for the foreign-born population - New Zealand (%)
Place of birth for the foreign-born population - Fiji (%)
Place of birth for the foreign-born population - Micronesia (%)
Place of birth for the foreign-born population - Bahamas (%)
Place of birth for the foreign-born population - Barbados (%)
Place of birth for the foreign-born population - Cuba (%)
Place of birth for the foreign-born population - Dominica (%)
Place of birth for the foreign-born population - Dominican Republic (%)
Place of birth for the foreign-born population - Grenada (%)
Place of birth for the foreign-born population - Haiti (%)
Place of birth for the foreign-born population - Jamaica (%)
Place of birth for the foreign-born population - St. Vincent and the Grenadines (%)
Place of birth for the foreign-born population - Trinidad and Tobago (%)
Place of birth for the foreign-born population - West Indies (%)
Place of birth for the foreign-born population - Other Caribbean (%)
Place of birth for the foreign-born population - Belize (%)
Place of birth for the foreign-born population - Costa Rica (%)
Place of birth for the foreign-born population - El Salvador (%)
Place of birth for the foreign-born population - Guatemala (%)
Place of birth for the foreign-born population - Honduras (%)
Place of birth for the foreign-born population - Mexico (%)
Place of birth for the foreign-born population - Nicaragua (%)
Place of birth for the foreign-born population - Panama (%)
Place of birth for the foreign-born population - Other Central America (%)
Place of birth for the foreign-born population - Argentina (%)
Place of birth for the foreign-born population - Bolivia (%)
Place of birth for the foreign-born population - Brazil (%)
Place of birth for the foreign-born population - Chile (%)
Place of birth for the foreign-born population - Colombia (%)
Place of birth for the foreign-born population - Ecuador (%)
Place of birth for the foreign-born population - Guyana (%)
Place of birth for the foreign-born population - Peru (%)
Place of birth for the foreign-born population - Uruguay (%)
Place of birth for the foreign-born population - Venezuela (%)
Place of birth for the foreign-born population - Other South America (%)
Place of birth for the foreign-born population - Canada (%)
Place of birth for the foreign-born population - Other Northern America (%)
Place of birth for the foreign-born population - Other (%)
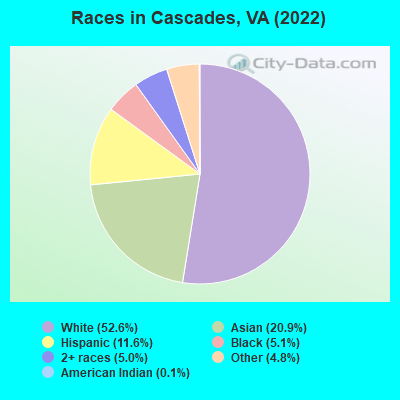
According to 2022 data, the most numerous races in Cascades, VA are White alone (6,771 residents), Black alone (659 residents), and Hispanic (1,491 residents). 65.1% of Cascades residents speak English at home.
Race distribution in Cascades 6,771 52.6% White alone 2,688 20.9% Asian alone 1,491 11.6% Hispanic 659 5.1% Black alone 647 5.0% Two or more races 618 4.8% Other race alone 16 0.1% American Indian alone 5 0.04% Native Hawaiian and Other
2000 2022
4,965,637 70.2% White alone 1,376,378 19.4% Black alone 329,540 4.7% Hispanic 259,277 3.7% Asian alone 114,022 1.6% Two or more races 18,596 0.3% American Indian alone 11,685 0.2% Other race alone 3,380 0.05% Native Hawaiian and Other
5,095,130 58.7% White alone 1,594,785 18.4% Black alone 905,750 10.4% Hispanic 602,881 6.9% Asian alone 406,047 4.7% Two or more races 60,419 0.7% Other race alone 11,738 0.1% American Indian alone 6,869 0.08% Native Hawaiian and Other
Income and house value in Cascades Median household income in 2022 $156,974 White non-Hispanic householdersover $200,000 Black householders$168,596 Asian householdersover $200,000 Two or more races householders$160,121 Hispanic or Latino race householders
Median age by race in Cascades
43.9 Median age for White residents37.4 49.0 50.2 Median age for Black or African American residents38.4 52.0 80.6 Median age for American Indian / Alaska Native residents-862,921,347.5 -673,154,906.1 39.1 Median age for Asian residents38.6 40.5 -1,157,453,935.2 Median age for Native Hawaiian / Pacific Islander residents-541,531,822.5 -714,150,046.8 2.8 Median age for Other race residents2.7 19.9 21.8 Median age for Two or more races residents54.4 21.0 44.0 Median age for White alone residents38.4 48.2 35.6 Median age for Hispanic or Latino residents41.9 35.9
Owner/renter occupied households by race in Cascades
House owners and renters - White residents 2,234 71.8% Owner occupied878 28.2% Renter occupiedHouse owners and renters - Black or African American residents 162 67.7% Owner occupied77 32.3% Renter occupiedHouse owners and renters - American Indian / Alaska Native residents 8 18.6% Owner occupied34 81.4% Renter occupiedHouse owners and renters - Asian residents 651 70.9% Owner occupied267 29.1% Renter occupiedHouse owners and renters - Other race residents 6 16.5% Owner occupied28 83.5% Renter occupiedHouse owners and renters - Two or more races residents 294 81.7% Owner occupied66 18.3% Renter occupiedHouse owners and renters - White alone residents 2,108 71.2% Owner occupied854 28.8% Renter occupiedHouse owners and renters - Hispanic or Latino residents 355 73.2% Owner occupied130 26.8% Renter occupied
Language usage in Cascades
English speakers - Total 65.1% of residents of Cascades speak English at home.
7.2% of residents speak Spanish at home 689 81.7% Speak English very well154 18.3% Speak English less than very well28.3% of residents speak other language at home 2,302 69.1% Speak English very well1,029 30.9% Speak English less than very well
English speakers - Born in the United States 91.2% of residents of Cascades speak English at home.
4.3% of residents speak Spanish at home 202 92.2% Speak English very well17 7.8% Speak English less than very well4.2% of residents speak other language at home 159 74.3% Speak English very well55 25.7% Speak English less than very well
English speakers - Native, born elsewhere 47.1% of residents of Cascades speak English at home.
24.5% of residents speak Spanish at home 113 100.0% Speak English very well31.0% of residents speak other language at home 143 100.0% Speak English very well
English speakers - Foreign-born 11.2% of residents of Cascades speak English at home.
12.7% of residents speak Spanish at home 287 69.7% Speak English very well125 30.3% Speak English less than very well78.8% of residents speak other language at home 1,597 62.6% Speak English very well954 37.4% Speak English less than very well
White (Caucasian) - Speak only English Native:
93.0% (5,374)Foreign-born:
9.2% (89)
White (Caucasian) - Speak another language Native:
7.0% (403)Foreign-born:
92.5% (893)
Black or African American - Speak only English Native:
93.6% (542)Foreign-born:
16.9% (20)
Black or African American - Speak another language Native:
6.4% (37)Foreign-born:
88.1% (102)
Asian - Speak only English Native:
48.1% (514)Foreign-born:
11.9% (173)
Asian - Speak another language Native:
52.6% (561)Foreign-born:
88.1% (1,281)
Other race - Speak only English Native:
88.2% (214)Foreign-born:
3.7% (7)
Other race - Speak another language Native:
10.7% (26)Foreign-born:
97.5% (179)
Two or more races - Speak only English Native:
79.3% (640)Foreign-born:
23.2% (100)
Two or more races - Speak another language Native:
16.7% (134)Foreign-born:
78.2% (336)
White alone - Speak only English Native:
94.6% (5,220)Foreign-born:
6.8% (74)
White alone - Speak another language Native:
5.2% (286)Foreign-born:
100.0% (1,094)
Hispanic or Latino - Speak only English Native:
71.4% (700)Foreign-born:
18.8% (86)
Hispanic or Latino - Speak another language Native:
29.8% (292)Foreign-born:
82.1% (376)
Foreign-born residents in Cascades
Marital status for residents in Cascades Marital status - White (Caucasian) population 15 years and over
Males 34.2% Never married56.8% Now married0.5% Separated2.2% Widowed6.3% DivorcedFemales 14.9% Never married47.8% Now married1.7% Separated11.7% Widowed23.9% DivorcedWomen who gave birth in the past 12 months Now married:
100.0% (24)Unmarried:
0.0% (0)
Women who did not give birth in the past 12 months Now married:
52.4% (747)Unmarried:
47.6% (679)
Marital status - Black or African American population 15 years and over
Males 23.1% Never married70.4% Now married0.0% Separated0.0% Widowed6.5% DivorcedFemales 31.8% Never married43.8% Now married0.0% Separated12.6% Widowed11.8% DivorcedWomen who gave birth in the past 12 months Now married:
100.0% (22)Unmarried:
0.0% (0)
Women who did not give birth in the past 12 months Now married:
37.4% (67)Unmarried:
62.6% (113)
Marital status - American Indian / Alaska Native population 15 years and over
Males 65.0% Never married35.0% Now married0.0% Separated0.0% Widowed0.0% DivorcedFemales 100.0% Never married0.0% Now married0.0% Separated0.0% Widowed0.0% DivorcedMarital status - Asian population 15 years and over
Males 30.8% Never married66.0% Now married0.0% Separated0.0% Widowed3.2% DivorcedFemales 20.7% Never married68.3% Now married0.8% Separated8.4% Widowed1.8% DivorcedWomen who gave birth in the past 12 months Now married:
100.0% (42)Unmarried:
0.0% (0)
Women who did not give birth in the past 12 months Now married:
69.6% (460)Unmarried:
30.4% (202)
Marital status - Other race population 15 years and over
Males 6.0% Never married43.0% Now married0.0% Separated0.0% Widowed51.0% DivorcedFemales 66.2% Never married26.1% Now married7.6% Separated0.0% Widowed0.0% DivorcedWomen who gave birth in the past 12 months Now married:
100.0% (6)Unmarried:
0.0% (0)
Women who did not give birth in the past 12 months Now married:
18.8% (19)Unmarried:
81.2% (80)
Marital status - Two or more races population 15 years and over
Males 31.1% Never married45.8% Now married4.3% Separated0.0% Widowed18.8% DivorcedFemales 56.5% Never married32.2% Now married0.0% Separated0.0% Widowed11.3% DivorcedWomen who gave birth in the past 12 months Now married:
100.0% (8)Unmarried:
0.0% (0)
Women who did not give birth in the past 12 months Now married:
22.6% (129)Unmarried:
77.4% (442)
Marital status - White alone, not Hispanic / Latino population 15 years and over
Males 31.8% Never married58.7% Now married0.5% Separated2.3% Widowed6.7% DivorcedFemales 15.7% Never married48.5% Now married1.8% Separated11.5% Widowed22.5% DivorcedWomen who gave birth in the past 12 months Now married:
100.0% (6)Unmarried:
0.0% (0)
Women who did not give birth in the past 12 months Now married:
50.7% (728)Unmarried:
49.3% (708)
Marital status - Hispanic or Latino population 15 years and over
Males 38.3% Never married35.4% Now married2.9% Separated0.0% Widowed23.3% DivorcedFemales 44.6% Never married28.7% Now married1.6% Separated4.1% Widowed21.0% DivorcedWomen who gave birth in the past 12 months Now married:
100.0% (20)Unmarried:
0.0% (0)
Women who did not give birth in the past 12 months Now married:
30.4% (158)Unmarried:
69.6% (360)
Ancestries in Cascades
504 7.8% Iranian423 6.6% English411 6.4% American337 5.2% Irish267 4.2% Italian213 3.3% German188 2.9% European148 2.3% Moroccan114 1.8% Greek113 1.8% Iraqi107 1.7% Egyptian65 1.0% Austrian56 0.9% Ethiopian55 0.9% Turkish48 0.7% Polish47 0.7% French40 0.6% Norwegian39 0.6% Romanian34 0.5% Dutch27 0.4% Northern European23 0.4% Jordanian23 0.4% Arab23 0.4% Bulgarian19 0.3% Welsh18 0.3% Scottish14 0.2% Canadian14 0.2% Scotch-Irish14 0.2% Afghan12 0.2% Eastern European11 0.2% Lebanese10 0.2% Russian9 0.1% Lithuanian7 0.1% Czech6 0.09% Swiss3 0.05% Slovak2 0.03% Portuguese
Geographical mobility in Cascades Same house 1 year ago 6,028 87.0% White (Caucasian)540 77.7% Black or African American39 96.1% American Indian / Alaska Native2,258 84.9% Asian8 95.3% Native Hawaiian / Pacific Islander767 100.0% Other race1,309 91.6% Two or more races5,758 85.8% White alone, not Hispanic / Latino1,501 100.0% Hispanic or LatinoMoved within same county 409 5.9% White / Caucasian78 11.2% Black or African American89 3.3% Asian1 0.2% Other race42 3.0% Two or more races423 6.3% White alone, not Hispanic / Latino14 0.9% Hispanic or LatinoMoved within same state 281 4.1% White / Caucasian56 8.1% Black or African American284 10.7% Asian42 2.9% Two or more races312 4.6% White alone, not Hispanic / Latino21 1.4% Hispanic or LatinoMoved from different state 183 2.6% White / Caucasian11 1.5% Black or African American28 1.1% Asian14 1.0% Two or more races189 2.8% White alone, not Hispanic / LatinoMoved from abroad 15 0.2% White20 1.4% Two or more races16 0.2% White alone, not Hispanic / Latino25 1.7% Hispanic or Latino
Children Nativity (place of birth) in Cascades
Children under 6 years - Living with two parents Both parents native 739 100.0% NativeBoth parents foreign-born 116 100.0% NativeOne native, one foreign-born parent 183 100.0% NativeChildren under 6 years - Living with one parent Native parent 125 100.0% NativeForeign-born parent 20 100.0% NativeChildren 6 to 17 years - Living with two parents Both parents native 579 97.1% Native17 2.9% Foreign-bornBoth parents foreign-born 399 89.2% Native48 10.8% Foreign-bornOne native, one foreign-born parent 316 100.0% NativeChildren 6 to 17 years - Living with one parent Native parent 195 100.0% NativeForeign-born parent 53 48.3% Native56 51.7% Foreign-born
Grandparents responsible for own grandchildren in Cascades
Grandparents (30 to 59 years) White / Caucasian 5 100.0% Not responsible for grandchildrenBlack or African American 5 100.0% Not responsible for grandchildrenWhite alone, not Hispanic / Latino 6 100.0% Not responsible for grandchildrenHispanic or Latino 5 100.0% Not responsible for grandchildren
Grandparents (60 years and over) White / Caucasian 26 100.0% Not responsible for grandchildrenBlack or African American 11 100.0% Responsible for grandchildrenWhite alone, not Hispanic / Latino 28 100.0% Not responsible for grandchildrenHispanic or Latino 31 100.0% Not responsible for grandchildren