Races in Falls Church, Virginia (VA) Detailed Stats
Data:
Races - White alone (%)
Races - White alone (% change since 2000)
Races - Black alone (%)
Races - Black alone (% change since 2000)
Races - American Indian alone (%)
Races - American Indian alone (% change since 2000)
Races - Asian alone (%)
Races - Asian alone (% change since 2000)
Races - Hispanic (%)
Races - Hispanic (% change since 2000)
Races - Native Hawaiian and Other Pacific Islander alone (%)
Races - Native Hawaiian and Other Pacific Islander alone (% change since 2000)
Races - Two or more races(%)
Races - Two or more races(% change since 2000)
Races - Other race alone (%)
Races - Other race alone (% change since 2000)
Racial diversity
Place of birth - Born in state of residence (%)
Place of birth - Born in state of residence (%) - White
Place of birth - Born in state of residence (%) - Black or African American
Place of birth - Born in state of residence (%) - Asian
Place of birth - Born in state of residence (%) - Hispanic or Latino
Place of birth - Born in state of residence (%) - American Indian and Alaska Native
Place of birth - Born in state of residence (%) - Multirace
Place of birth - Born in state of residence (%) - Other Race
Place of birth - Born in other state (%)
Place of birth - Born in other state (%) - White
Place of birth - Born in other state (%) - Black or African American
Place of birth - Born in other state (%) - Asian
Place of birth - Born in other state (%) - Hispanic or Latino
Place of birth - Born in other state (%) - American Indian and Alaska Native
Place of birth - Born in other state (%) - Multirace
Place of birth - Born in other state (%) - Other Race
Place of birth - Native, outside of US (%)
Place of birth - Native, outside of US (%) - White
Place of birth - Native, outside of US (%) - Black or African American
Place of birth - Native, outside of US (%) - Asian
Place of birth - Native, outside of US (%) - Hispanic or Latino
Place of birth - Native, outside of US (%) - American Indian and Alaska Native
Place of birth - Native, outside of US (%) - Multirace
Place of birth - Native, outside of US (%) - Other Race
Place of birth - Foreign born (%)
Place of birth - Foreign born (%) - White
Place of birth - Foreign born (%) - Black or African American
Place of birth - Foreign born (%) - Asian
Place of birth - Foreign born (%) - Hispanic or Latino
Place of birth - Foreign born (%) - American Indian and Alaska Native
Place of birth - Foreign born (%) - Multirace
Place of birth - Foreign born (%) - Other Race
Residents speaking English at home (%)
Residents speaking English at home - Born in the United States (%)
Residents speaking English at home - Native, born elsewhere (%)
Residents speaking English at home - Foreign born (%)
Residents speaking Spanish at home (%)
Residents speaking Spanish at home - Born in the United States (%)
Residents speaking Spanish at home - Native, born elsewhere (%)
Residents speaking Spanish at home - Foreign born (%)
Residents speaking other language at home (%)
Residents speaking other language at home - Born in the United States (%)
Residents speaking other language at home - Native, born elsewhere (%)
Residents speaking other language at home - Foreign born (%)
Marital status - Never married (%)
Marital status - Now married (%)
Marital status - Separated (%)
Marital status - Widowed (%)
Marital status - Divorced (%)
Ancestries Reported - Arab (%)
Ancestries Reported - Czech (%)
Ancestries Reported - Danish (%)
Ancestries Reported - Dutch (%)
Ancestries Reported - English (%)
Ancestries Reported - French (%)
Ancestries Reported - French Canadian (%)
Ancestries Reported - German (%)
Ancestries Reported - Greek (%)
Ancestries Reported - Hungarian (%)
Ancestries Reported - Irish (%)
Ancestries Reported - Italian (%)
Ancestries Reported - Lithuanian (%)
Ancestries Reported - Norwegian (%)
Ancestries Reported - Polish (%)
Ancestries Reported - Portuguese (%)
Ancestries Reported - Russian (%)
Ancestries Reported - Scotch-Irish (%)
Ancestries Reported - Scottish (%)
Ancestries Reported - Slovak (%)
Ancestries Reported - Subsaharan African (%)
Ancestries Reported - Swedish (%)
Ancestries Reported - Swiss (%)
Ancestries Reported - Ukrainian (%)
Ancestries Reported - United States (%)
Ancestries Reported - Welsh (%)
Ancestries Reported - West Indian (%)
Ancestries Reported - Other (%)
Geographical mobility - Same house 1 year ago (%)
Geographical mobility - Same house 1 year ago (%) - White
Geographical mobility - Same house 1 year ago (%) - Black or African American
Geographical mobility - Same house 1 year ago (%) - Asian
Geographical mobility - Same house 1 year ago (%) - Hispanic or Latino
Geographical mobility - Same house 1 year ago (%) - American Indian and Alaska Native
Geographical mobility - Same house 1 year ago (%) - Multirace
Geographical mobility - Same house 1 year ago (%) - Other Race
Geographical mobility - Moved within same county (%)
Geographical mobility - Moved within same county (%) - White
Geographical mobility - Moved within same county (%) - Black or African American
Geographical mobility - Moved within same county (%) - Asian
Geographical mobility - Moved within same county (%) - Hispanic or Latino
Geographical mobility - Moved within same county (%) - American Indian and Alaska Native
Geographical mobility - Moved within same county (%) - Multirace
Geographical mobility - Moved within same county (%) - Other Race
Geographical mobility - Moved from different county within same state (%)
Geographical mobility - Moved from different county within same state (%) - White
Geographical mobility - Moved from different county within same state (%) - Black or African American
Geographical mobility - Moved from different county within same state (%) - Asian
Geographical mobility - Moved from different county within same state (%) - Hispanic or Latino
Geographical mobility - Moved from different county within same state (%) - American Indian and Alaska Native
Geographical mobility - Moved from different county within same state (%) - Multirace
Geographical mobility - Moved from different county within same state (%) - Other Race
Geographical mobility - Moved from different state (%)
Geographical mobility - Moved from different state (%) - White
Geographical mobility - Moved from different state (%) - Black or African American
Geographical mobility - Moved from different state (%) - Asian
Geographical mobility - Moved from different state (%) - Hispanic or Latino
Geographical mobility - Moved from different state (%) - American Indian and Alaska Native
Geographical mobility - Moved from different state (%) - Multirace
Geographical mobility - Moved from different state (%) - Other Race
Geographical mobility - Moved from abroad (%)
Geographical mobility - Moved from abroad (%) - White
Geographical mobility - Moved from abroad (%) - Black or African American
Geographical mobility - Moved from abroad (%) - Asian
Geographical mobility - Moved from abroad (%) - Hispanic or Latino
Geographical mobility - Moved from abroad (%) - American Indian and Alaska Native
Geographical mobility - Moved from abroad (%) - Multirace
Geographical mobility - Moved from abroad (%) - Other Race
Place of birth for the foreign-born population - Ireland (%)
Place of birth for the foreign-born population - Denmark (%)
Place of birth for the foreign-born population - Norway (%)
Place of birth for the foreign-born population - Sweden (%)
Place of birth for the foreign-born population - United Kingdom (%)
Place of birth for the foreign-born population - England (%)
Place of birth for the foreign-born population - Scotland (%)
Place of birth for the foreign-born population - Other Northern Europe (%)
Place of birth for the foreign-born population - Austria (%)
Place of birth for the foreign-born population - Belgium (%)
Place of birth for the foreign-born population - France (%)
Place of birth for the foreign-born population - Germany (%)
Place of birth for the foreign-born population - Netherlands (%)
Place of birth for the foreign-born population - Switzerland (%)
Place of birth for the foreign-born population - Other Western Europe (%)
Place of birth for the foreign-born population - Greece (%)
Place of birth for the foreign-born population - Italy (%)
Place of birth for the foreign-born population - Portugal (%)
Place of birth for the foreign-born population - Spain (%)
Place of birth for the foreign-born population - Other Southern Europe (%)
Place of birth for the foreign-born population - Albania (%)
Place of birth for the foreign-born population - Belarus (%)
Place of birth for the foreign-born population - Bosnia and Herzegovina (%)
Place of birth for the foreign-born population - Bulgaria (%)
Place of birth for the foreign-born population - Croatia (%)
Place of birth for the foreign-born population - Czechoslovakia (%)
Place of birth for the foreign-born population - Hungary (%)
Place of birth for the foreign-born population - Latvia (%)
Place of birth for the foreign-born population - Lithuania (%)
Place of birth for the foreign-born population - North Macedonia (Macedonia) (%)
Place of birth for the foreign-born population - Moldova (%)
Place of birth for the foreign-born population - Poland (%)
Place of birth for the foreign-born population - Romania (%)
Place of birth for the foreign-born population - Russia (%)
Place of birth for the foreign-born population - Serbia (%)
Place of birth for the foreign-born population - Ukraine (%)
Place of birth for the foreign-born population - Other Eastern Europe (%)
Place of birth for the foreign-born population - China (%)
Place of birth for the foreign-born population - Hong Kong (%)
Place of birth for the foreign-born population - Taiwan (%)
Place of birth for the foreign-born population - Japan (%)
Place of birth for the foreign-born population - Korea (%)
Place of birth for the foreign-born population - Other Eastern Asia (%)
Place of birth for the foreign-born population - Afghanistan (%)
Place of birth for the foreign-born population - Bangladesh (%)
Place of birth for the foreign-born population - India (%)
Place of birth for the foreign-born population - Iran (%)
Place of birth for the foreign-born population - Kazakhstan (%)
Place of birth for the foreign-born population - Nepal (%)
Place of birth for the foreign-born population - Pakistan (%)
Place of birth for the foreign-born population - Sri Lanka (%)
Place of birth for the foreign-born population - Uzbekistan (%)
Place of birth for the foreign-born population - Other South Central Asia (%)
Place of birth for the foreign-born population - Burma (%)
Place of birth for the foreign-born population - Cambodia (%)
Place of birth for the foreign-born population - Indonesia (%)
Place of birth for the foreign-born population - Laos (%)
Place of birth for the foreign-born population - Malaysia (%)
Place of birth for the foreign-born population - Philippines (%)
Place of birth for the foreign-born population - Singapore (%)
Place of birth for the foreign-born population - Thailand (%)
Place of birth for the foreign-born population - Vietnam (%)
Place of birth for the foreign-born population - Other South Eastern Asia (%)
Place of birth for the foreign-born population - Armenia (%)
Place of birth for the foreign-born population - Iraq (%)
Place of birth for the foreign-born population - Israel (%)
Place of birth for the foreign-born population - Jordan (%)
Place of birth for the foreign-born population - Kuwait (%)
Place of birth for the foreign-born population - Lebanon (%)
Place of birth for the foreign-born population - Saudi Arabia (%)
Place of birth for the foreign-born population - Syria (%)
Place of birth for the foreign-born population - Turkey (%)
Place of birth for the foreign-born population - Yemen (%)
Place of birth for the foreign-born population - Other Western Asia (%)
Place of birth for the foreign-born population - Eritrea (%)
Place of birth for the foreign-born population - Ethiopia (%)
Place of birth for the foreign-born population - Kenya (%)
Place of birth for the foreign-born population - Somalia (%)
Place of birth for the foreign-born population - Uganda (%)
Place of birth for the foreign-born population - Zimbabwe (%)
Place of birth for the foreign-born population - Other Eastern Africa (%)
Place of birth for the foreign-born population - Cameroon (%)
Place of birth for the foreign-born population - Congo (%)
Place of birth for the foreign-born population - Democratic Republic of Congo (Zaire) (%)
Place of birth for the foreign-born population - Other Middle Africa (%)
Place of birth for the foreign-born population - Egypt (%)
Place of birth for the foreign-born population - Morocco (%)
Place of birth for the foreign-born population - Sudan (%)
Place of birth for the foreign-born population - Other Northern Africa (%)
Place of birth for the foreign-born population - South Africa (%)
Place of birth for the foreign-born population - Other Southern Africa (%)
Place of birth for the foreign-born population - Cabo Verde (%)
Place of birth for the foreign-born population - Ghana (%)
Place of birth for the foreign-born population - Liberia (%)
Place of birth for the foreign-born population - Nigeria (%)
Place of birth for the foreign-born population - Senegal (%)
Place of birth for the foreign-born population - Sierra Leone (%)
Place of birth for the foreign-born population - Other Western Africa (%)
Place of birth for the foreign-born population - Australia (%)
Place of birth for the foreign-born population - New Zealand (%)
Place of birth for the foreign-born population - Fiji (%)
Place of birth for the foreign-born population - Micronesia (%)
Place of birth for the foreign-born population - Bahamas (%)
Place of birth for the foreign-born population - Barbados (%)
Place of birth for the foreign-born population - Cuba (%)
Place of birth for the foreign-born population - Dominica (%)
Place of birth for the foreign-born population - Dominican Republic (%)
Place of birth for the foreign-born population - Grenada (%)
Place of birth for the foreign-born population - Haiti (%)
Place of birth for the foreign-born population - Jamaica (%)
Place of birth for the foreign-born population - St. Vincent and the Grenadines (%)
Place of birth for the foreign-born population - Trinidad and Tobago (%)
Place of birth for the foreign-born population - West Indies (%)
Place of birth for the foreign-born population - Other Caribbean (%)
Place of birth for the foreign-born population - Belize (%)
Place of birth for the foreign-born population - Costa Rica (%)
Place of birth for the foreign-born population - El Salvador (%)
Place of birth for the foreign-born population - Guatemala (%)
Place of birth for the foreign-born population - Honduras (%)
Place of birth for the foreign-born population - Mexico (%)
Place of birth for the foreign-born population - Nicaragua (%)
Place of birth for the foreign-born population - Panama (%)
Place of birth for the foreign-born population - Other Central America (%)
Place of birth for the foreign-born population - Argentina (%)
Place of birth for the foreign-born population - Bolivia (%)
Place of birth for the foreign-born population - Brazil (%)
Place of birth for the foreign-born population - Chile (%)
Place of birth for the foreign-born population - Colombia (%)
Place of birth for the foreign-born population - Ecuador (%)
Place of birth for the foreign-born population - Guyana (%)
Place of birth for the foreign-born population - Peru (%)
Place of birth for the foreign-born population - Uruguay (%)
Place of birth for the foreign-born population - Venezuela (%)
Place of birth for the foreign-born population - Other South America (%)
Place of birth for the foreign-born population - Canada (%)
Place of birth for the foreign-born population - Other Northern America (%)
Place of birth for the foreign-born population - Other (%)
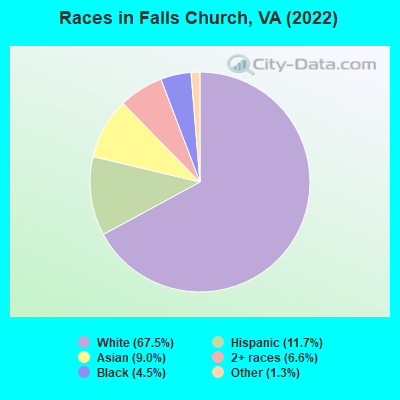
According to 2022 data, the most numerous races in Falls Church, VA are White alone (9,902 residents), Black alone (666 residents), and Hispanic (1,717 residents). 79.6% of Falls Church residents speak English at home. 15.6% of Falls Church, VA residents are foreign-born (7.6% born in Asia, 3.8% born in Latin America, 3.0% born in Europe), which is 23.3% greater than the foreign-born rate of 12.0% across the entire state of Virginia.
Race distribution in Falls Church
2000 2022
4,965,637 70.2% White alone 1,376,378 19.4% Black alone 329,540 4.7% Hispanic 259,277 3.7% Asian alone 114,022 1.6% Two or more races 18,596 0.3% American Indian alone 11,685 0.2% Other race alone 3,380 0.05% Native Hawaiian and Other
5,095,130 58.7% White alone 1,594,785 18.4% Black alone 905,750 10.4% Hispanic 602,881 6.9% Asian alone 406,047 4.7% Two or more races 60,419 0.7% Other race alone 11,738 0.1% American Indian alone 6,869 0.08% Native Hawaiian and Other
Income and house value in Falls Church Median household income in 2022 $173,390 White non-Hispanic householders$122,891 Asian householders$58,046 Some other race householders$133,431 Two or more races householders$67,585 Hispanic or Latino race householdersMedian 2022 house value over $1,000,000 White Non-Hispanic householders$777,926 Black or African American householders $743,283 Asian householdersover $1,000,000 Some other race householdersover $1,000,000 Two or more races householders$769,842 Hispanic or Latino householders
Median age by race in Falls Church
42.2 Median age for White residents41.4 42.4 31.7 Median age for Black or African American residents31.5 32.2 15.1 Median age for American Indian / Alaska Native residents-682,352,940.5 -687,861,271.0 44.0 Median age for Asian residents31.5 46.1 -611,955,419.9 Median age for Native Hawaiian / Pacific Islander residents-541,531,822.5 -714,150,046.8 47.8 Median age for Other race residents52.1 48.1 23.0 Median age for Two or more races residents20.8 25.0 42.2 Median age for White alone residents43.2 42.1 29.6 Median age for Hispanic or Latino residents19.9 34.8
Owner/renter occupied households by race in Falls Church
House owners and renters - White residents 2,588 59.6% Owner occupied1,755 40.4% Renter occupiedHouse owners and renters - Black or African American residents 36 16.3% Owner occupied187 83.7% Renter occupiedHouse owners and renters - American Indian / Alaska Native residents 9 100.0% Renter occupiedHouse owners and renters - Asian residents 352 66.6% Owner occupied176 33.4% Renter occupiedHouse owners and renters - Other race residents 21 7.4% Owner occupied265 92.6% Renter occupiedHouse owners and renters - Two or more races residents 311 60.7% Owner occupied202 39.3% Renter occupiedHouse owners and renters - White alone residents 2,563 60.0% Owner occupied1,709 40.0% Renter occupiedHouse owners and renters - Hispanic or Latino residents 152 26.5% Owner occupied423 73.5% Renter occupied
Language usage in Falls Church
English speakers - Total 79.6% of residents of Falls Church speak English at home.
6.6% of residents speak Spanish at home 728 78.9% Speak English very well195 21.1% Speak English less than very well14.0% of residents speak other language at home 1,459 74.7% Speak English very well495 25.3% Speak English less than very well
English speakers - Born in the United States 91.2% of residents of Falls Church speak English at home.
3.4% of residents speak Spanish at home 232 86.9% Speak English very well35 13.1% Speak English less than very well5.5% of residents speak other language at home 415 95.8% Speak English very well18 4.2% Speak English less than very well
English speakers - Native, born elsewhere 62.3% of residents of Falls Church speak English at home.
23.8% of residents speak Spanish at home 128 96.2% Speak English very well5 3.8% Speak English less than very well13.8% of residents speak other language at home 77 100.0% Speak English very well
English speakers - Foreign-born 22.3% of residents of Falls Church speak English at home.
19.5% of residents speak Spanish at home 283 64.2% Speak English very well158 35.8% Speak English less than very well58.5% of residents speak other language at home 910 68.7% Speak English very well414 31.3% Speak English less than very well
White (Caucasian) - Speak only English Native:
95.6% (8,378)Foreign-born:
32.9% (234)
White (Caucasian) - Speak another language Native:
4.1% (356)Foreign-born:
68.0% (482)
Black or African American - Speak only English Native:
97.5% (601)Foreign-born:
30.3% (15)
Black or African American - Speak another language Native:
2.4% (15)Foreign-born:
68.9% (35)
Asian - Speak only English Native:
57.7% (257)Foreign-born:
18.6% (152)
Asian - Speak another language Native:
41.1% (183)Foreign-born:
81.8% (670)
Other race - Speak another language Native:
19.0% (94)Foreign-born:
98.4% (165)
Two or more races - Speak only English Native:
70.7% (1,138)Foreign-born:
30.1% (97)
Two or more races - Speak another language Native:
30.7% (494)Foreign-born:
68.7% (222)
White alone - Speak only English Native:
96.4% (8,313)Foreign-born:
29.3% (234)
White alone - Speak another language Native:
3.5% (303)Foreign-born:
71.1% (567)
Hispanic or Latino - Speak only English Native:
60.7% (730)Foreign-born:
16.6% (80)
Hispanic or Latino - Speak another language Native:
39.8% (479)Foreign-born:
83.9% (403)
Foreign-born residents in Falls Church 2,295 residents are foreign born (7.6% Asia , 3.8% Latin America , 3.0% Europe ).
This city:
15.6%Virginia:
12.6%
Marital status for residents in Falls Church Marital status - White (Caucasian) population 15 years and over
Males 30.6% Never married60.5% Now married0.0% Separated3.3% Widowed5.6% DivorcedFemales 28.6% Never married54.1% Now married1.2% Separated6.3% Widowed9.9% DivorcedWomen who gave birth in the past 12 months Now married:
100.0% (99)Unmarried:
0.0% (0)
Women who did not give birth in the past 12 months Now married:
45.9% (963)Unmarried:
54.1% (1,134)
Marital status - Black or African American population 15 years and over
Males 51.2% Never married24.1% Now married0.0% Separated0.0% Widowed24.7% DivorcedFemales 47.4% Never married29.1% Now married0.0% Separated14.4% Widowed9.1% DivorcedWomen who did not give birth in the past 12 months Now married:
23.2% (51)Unmarried:
76.8% (170)
Marital status - American Indian / Alaska Native population 15 years and over
Males 0.0% Never married100.0% Now married0.0% Separated0.0% Widowed0.0% DivorcedFemales 0.0% Never married100.0% Now married0.0% Separated0.0% Widowed0.0% DivorcedMarital status - Asian population 15 years and over
Males 52.8% Never married45.9% Now married0.0% Separated1.3% Widowed0.0% DivorcedFemales 27.3% Never married59.2% Now married1.6% Separated5.6% Widowed6.2% DivorcedWomen who gave birth in the past 12 months Now married:
100.0% (4)Unmarried:
0.0% (0)
Women who did not give birth in the past 12 months Now married:
50.5% (203)Unmarried:
49.5% (199)
Marital status - Other race population 15 years and over
Males 41.6% Never married58.4% Now married0.0% Separated0.0% Widowed0.0% DivorcedFemales 22.6% Never married54.4% Now married0.0% Separated0.9% Widowed22.1% DivorcedWomen who did not give birth in the past 12 months Now married:
24.4% (42)Unmarried:
75.6% (130)
Marital status - Two or more races population 15 years and over
Males 62.3% Never married36.7% Now married0.0% Separated1.0% Widowed0.0% DivorcedFemales 54.9% Never married37.9% Now married0.0% Separated0.0% Widowed7.2% DivorcedWomen who did not give birth in the past 12 months Now married:
30.7% (179)Unmarried:
69.3% (405)
Marital status - White alone, not Hispanic / Latino population 15 years and over
Males 29.4% Never married61.3% Now married0.0% Separated3.4% Widowed5.9% DivorcedFemales 29.4% Never married53.4% Now married1.2% Separated5.7% Widowed10.3% DivorcedWomen who gave birth in the past 12 months Now married:
100.0% (102)Unmarried:
0.0% (0)
Women who did not give birth in the past 12 months Now married:
43.5% (891)Unmarried:
56.5% (1,158)
Marital status - Hispanic or Latino population 15 years and over
Males 58.3% Never married41.7% Now married0.0% Separated0.0% Widowed0.0% DivorcedFemales 40.5% Never married43.7% Now married0.0% Separated5.4% Widowed10.4% DivorcedWomen who did not give birth in the past 12 months Now married:
31.9% (155)Unmarried:
68.1% (331)
Ancestries in Falls Church
637 10.1% English472 7.5% Irish437 7.0% German371 5.9% American260 4.1% European219 3.5% Italian215 3.4% Eastern European210 3.3% Albanian161 2.6% Palestinian136 2.2% Scottish92 1.5% Turkish81 1.3% Polish72 1.1% Dutch65 1.0% Russian65 1.0% British52 0.8% French49 0.8% Northern European44 0.7% Iranian40 0.6% Bulgarian35 0.6% Swedish33 0.5% Scotch-Irish33 0.5% Greek30 0.5% Austrian27 0.4% Hungarian22 0.4% Norwegian19 0.3% Brazilian17 0.3% Australian15 0.2% Ethiopian14 0.2% Finnish11 0.2% Lithuanian8 0.1% Lebanese7 0.1% Kenyan7 0.1% British West Indian6 0.10% Danish6 0.10% Swiss5 0.08% Moroccan3 0.05% Canadian3 0.05% Macedonian
Children Nativity (place of birth) in Falls Church
Children under 6 years - Living with two parents Both parents native 551 96.5% Native20 3.5% Foreign-bornBoth parents foreign-born 59 74.2% Native21 25.8% Foreign-bornOne native, one foreign-born parent 163 100.0% NativeChildren 6 to 17 years - Living with two parents Both parents native 1,636 98.9% Native18 1.1% Foreign-bornBoth parents foreign-born 138 77.5% Native40 22.5% Foreign-bornOne native, one foreign-born parent 246 100.0% NativeChildren 6 to 17 years - Living with one parent Native parent 402 100.0% NativeForeign-born parent 160 49.9% Native161 50.1% Foreign-born