Races in Fort Belvoir, Virginia (VA) Detailed Stats
Data:
Races - White alone (%)
Races - White alone (% change since 2000)
Races - Black alone (%)
Races - Black alone (% change since 2000)
Races - American Indian alone (%)
Races - American Indian alone (% change since 2000)
Races - Asian alone (%)
Races - Asian alone (% change since 2000)
Races - Hispanic (%)
Races - Hispanic (% change since 2000)
Races - Native Hawaiian and Other Pacific Islander alone (%)
Races - Native Hawaiian and Other Pacific Islander alone (% change since 2000)
Races - Two or more races(%)
Races - Two or more races(% change since 2000)
Races - Other race alone (%)
Races - Other race alone (% change since 2000)
Racial diversity
Place of birth - Born in state of residence (%)
Place of birth - Born in state of residence (%) - White
Place of birth - Born in state of residence (%) - Black or African American
Place of birth - Born in state of residence (%) - Asian
Place of birth - Born in state of residence (%) - Hispanic or Latino
Place of birth - Born in state of residence (%) - American Indian and Alaska Native
Place of birth - Born in state of residence (%) - Multirace
Place of birth - Born in state of residence (%) - Other Race
Place of birth - Born in other state (%)
Place of birth - Born in other state (%) - White
Place of birth - Born in other state (%) - Black or African American
Place of birth - Born in other state (%) - Asian
Place of birth - Born in other state (%) - Hispanic or Latino
Place of birth - Born in other state (%) - American Indian and Alaska Native
Place of birth - Born in other state (%) - Multirace
Place of birth - Born in other state (%) - Other Race
Place of birth - Native, outside of US (%)
Place of birth - Native, outside of US (%) - White
Place of birth - Native, outside of US (%) - Black or African American
Place of birth - Native, outside of US (%) - Asian
Place of birth - Native, outside of US (%) - Hispanic or Latino
Place of birth - Native, outside of US (%) - American Indian and Alaska Native
Place of birth - Native, outside of US (%) - Multirace
Place of birth - Native, outside of US (%) - Other Race
Place of birth - Foreign born (%)
Place of birth - Foreign born (%) - White
Place of birth - Foreign born (%) - Black or African American
Place of birth - Foreign born (%) - Asian
Place of birth - Foreign born (%) - Hispanic or Latino
Place of birth - Foreign born (%) - American Indian and Alaska Native
Place of birth - Foreign born (%) - Multirace
Place of birth - Foreign born (%) - Other Race
Residents speaking English at home (%)
Residents speaking English at home - Born in the United States (%)
Residents speaking English at home - Native, born elsewhere (%)
Residents speaking English at home - Foreign born (%)
Residents speaking Spanish at home (%)
Residents speaking Spanish at home - Born in the United States (%)
Residents speaking Spanish at home - Native, born elsewhere (%)
Residents speaking Spanish at home - Foreign born (%)
Residents speaking other language at home (%)
Residents speaking other language at home - Born in the United States (%)
Residents speaking other language at home - Native, born elsewhere (%)
Residents speaking other language at home - Foreign born (%)
Marital status - Never married (%)
Marital status - Now married (%)
Marital status - Separated (%)
Marital status - Widowed (%)
Marital status - Divorced (%)
Ancestries Reported - Arab (%)
Ancestries Reported - Czech (%)
Ancestries Reported - Danish (%)
Ancestries Reported - Dutch (%)
Ancestries Reported - English (%)
Ancestries Reported - French (%)
Ancestries Reported - French Canadian (%)
Ancestries Reported - German (%)
Ancestries Reported - Greek (%)
Ancestries Reported - Hungarian (%)
Ancestries Reported - Irish (%)
Ancestries Reported - Italian (%)
Ancestries Reported - Lithuanian (%)
Ancestries Reported - Norwegian (%)
Ancestries Reported - Polish (%)
Ancestries Reported - Portuguese (%)
Ancestries Reported - Russian (%)
Ancestries Reported - Scotch-Irish (%)
Ancestries Reported - Scottish (%)
Ancestries Reported - Slovak (%)
Ancestries Reported - Subsaharan African (%)
Ancestries Reported - Swedish (%)
Ancestries Reported - Swiss (%)
Ancestries Reported - Ukrainian (%)
Ancestries Reported - United States (%)
Ancestries Reported - Welsh (%)
Ancestries Reported - West Indian (%)
Ancestries Reported - Other (%)
Geographical mobility - Same house 1 year ago (%)
Geographical mobility - Same house 1 year ago (%) - White
Geographical mobility - Same house 1 year ago (%) - Black or African American
Geographical mobility - Same house 1 year ago (%) - Asian
Geographical mobility - Same house 1 year ago (%) - Hispanic or Latino
Geographical mobility - Same house 1 year ago (%) - American Indian and Alaska Native
Geographical mobility - Same house 1 year ago (%) - Multirace
Geographical mobility - Same house 1 year ago (%) - Other Race
Geographical mobility - Moved within same county (%)
Geographical mobility - Moved within same county (%) - White
Geographical mobility - Moved within same county (%) - Black or African American
Geographical mobility - Moved within same county (%) - Asian
Geographical mobility - Moved within same county (%) - Hispanic or Latino
Geographical mobility - Moved within same county (%) - American Indian and Alaska Native
Geographical mobility - Moved within same county (%) - Multirace
Geographical mobility - Moved within same county (%) - Other Race
Geographical mobility - Moved from different county within same state (%)
Geographical mobility - Moved from different county within same state (%) - White
Geographical mobility - Moved from different county within same state (%) - Black or African American
Geographical mobility - Moved from different county within same state (%) - Asian
Geographical mobility - Moved from different county within same state (%) - Hispanic or Latino
Geographical mobility - Moved from different county within same state (%) - American Indian and Alaska Native
Geographical mobility - Moved from different county within same state (%) - Multirace
Geographical mobility - Moved from different county within same state (%) - Other Race
Geographical mobility - Moved from different state (%)
Geographical mobility - Moved from different state (%) - White
Geographical mobility - Moved from different state (%) - Black or African American
Geographical mobility - Moved from different state (%) - Asian
Geographical mobility - Moved from different state (%) - Hispanic or Latino
Geographical mobility - Moved from different state (%) - American Indian and Alaska Native
Geographical mobility - Moved from different state (%) - Multirace
Geographical mobility - Moved from different state (%) - Other Race
Geographical mobility - Moved from abroad (%)
Geographical mobility - Moved from abroad (%) - White
Geographical mobility - Moved from abroad (%) - Black or African American
Geographical mobility - Moved from abroad (%) - Asian
Geographical mobility - Moved from abroad (%) - Hispanic or Latino
Geographical mobility - Moved from abroad (%) - American Indian and Alaska Native
Geographical mobility - Moved from abroad (%) - Multirace
Geographical mobility - Moved from abroad (%) - Other Race
Place of birth for the foreign-born population - Ireland (%)
Place of birth for the foreign-born population - Denmark (%)
Place of birth for the foreign-born population - Norway (%)
Place of birth for the foreign-born population - Sweden (%)
Place of birth for the foreign-born population - United Kingdom (%)
Place of birth for the foreign-born population - England (%)
Place of birth for the foreign-born population - Scotland (%)
Place of birth for the foreign-born population - Other Northern Europe (%)
Place of birth for the foreign-born population - Austria (%)
Place of birth for the foreign-born population - Belgium (%)
Place of birth for the foreign-born population - France (%)
Place of birth for the foreign-born population - Germany (%)
Place of birth for the foreign-born population - Netherlands (%)
Place of birth for the foreign-born population - Switzerland (%)
Place of birth for the foreign-born population - Other Western Europe (%)
Place of birth for the foreign-born population - Greece (%)
Place of birth for the foreign-born population - Italy (%)
Place of birth for the foreign-born population - Portugal (%)
Place of birth for the foreign-born population - Spain (%)
Place of birth for the foreign-born population - Other Southern Europe (%)
Place of birth for the foreign-born population - Albania (%)
Place of birth for the foreign-born population - Belarus (%)
Place of birth for the foreign-born population - Bosnia and Herzegovina (%)
Place of birth for the foreign-born population - Bulgaria (%)
Place of birth for the foreign-born population - Croatia (%)
Place of birth for the foreign-born population - Czechoslovakia (%)
Place of birth for the foreign-born population - Hungary (%)
Place of birth for the foreign-born population - Latvia (%)
Place of birth for the foreign-born population - Lithuania (%)
Place of birth for the foreign-born population - North Macedonia (Macedonia) (%)
Place of birth for the foreign-born population - Moldova (%)
Place of birth for the foreign-born population - Poland (%)
Place of birth for the foreign-born population - Romania (%)
Place of birth for the foreign-born population - Russia (%)
Place of birth for the foreign-born population - Serbia (%)
Place of birth for the foreign-born population - Ukraine (%)
Place of birth for the foreign-born population - Other Eastern Europe (%)
Place of birth for the foreign-born population - China (%)
Place of birth for the foreign-born population - Hong Kong (%)
Place of birth for the foreign-born population - Taiwan (%)
Place of birth for the foreign-born population - Japan (%)
Place of birth for the foreign-born population - Korea (%)
Place of birth for the foreign-born population - Other Eastern Asia (%)
Place of birth for the foreign-born population - Afghanistan (%)
Place of birth for the foreign-born population - Bangladesh (%)
Place of birth for the foreign-born population - India (%)
Place of birth for the foreign-born population - Iran (%)
Place of birth for the foreign-born population - Kazakhstan (%)
Place of birth for the foreign-born population - Nepal (%)
Place of birth for the foreign-born population - Pakistan (%)
Place of birth for the foreign-born population - Sri Lanka (%)
Place of birth for the foreign-born population - Uzbekistan (%)
Place of birth for the foreign-born population - Other South Central Asia (%)
Place of birth for the foreign-born population - Burma (%)
Place of birth for the foreign-born population - Cambodia (%)
Place of birth for the foreign-born population - Indonesia (%)
Place of birth for the foreign-born population - Laos (%)
Place of birth for the foreign-born population - Malaysia (%)
Place of birth for the foreign-born population - Philippines (%)
Place of birth for the foreign-born population - Singapore (%)
Place of birth for the foreign-born population - Thailand (%)
Place of birth for the foreign-born population - Vietnam (%)
Place of birth for the foreign-born population - Other South Eastern Asia (%)
Place of birth for the foreign-born population - Armenia (%)
Place of birth for the foreign-born population - Iraq (%)
Place of birth for the foreign-born population - Israel (%)
Place of birth for the foreign-born population - Jordan (%)
Place of birth for the foreign-born population - Kuwait (%)
Place of birth for the foreign-born population - Lebanon (%)
Place of birth for the foreign-born population - Saudi Arabia (%)
Place of birth for the foreign-born population - Syria (%)
Place of birth for the foreign-born population - Turkey (%)
Place of birth for the foreign-born population - Yemen (%)
Place of birth for the foreign-born population - Other Western Asia (%)
Place of birth for the foreign-born population - Eritrea (%)
Place of birth for the foreign-born population - Ethiopia (%)
Place of birth for the foreign-born population - Kenya (%)
Place of birth for the foreign-born population - Somalia (%)
Place of birth for the foreign-born population - Uganda (%)
Place of birth for the foreign-born population - Zimbabwe (%)
Place of birth for the foreign-born population - Other Eastern Africa (%)
Place of birth for the foreign-born population - Cameroon (%)
Place of birth for the foreign-born population - Congo (%)
Place of birth for the foreign-born population - Democratic Republic of Congo (Zaire) (%)
Place of birth for the foreign-born population - Other Middle Africa (%)
Place of birth for the foreign-born population - Egypt (%)
Place of birth for the foreign-born population - Morocco (%)
Place of birth for the foreign-born population - Sudan (%)
Place of birth for the foreign-born population - Other Northern Africa (%)
Place of birth for the foreign-born population - South Africa (%)
Place of birth for the foreign-born population - Other Southern Africa (%)
Place of birth for the foreign-born population - Cabo Verde (%)
Place of birth for the foreign-born population - Ghana (%)
Place of birth for the foreign-born population - Liberia (%)
Place of birth for the foreign-born population - Nigeria (%)
Place of birth for the foreign-born population - Senegal (%)
Place of birth for the foreign-born population - Sierra Leone (%)
Place of birth for the foreign-born population - Other Western Africa (%)
Place of birth for the foreign-born population - Australia (%)
Place of birth for the foreign-born population - New Zealand (%)
Place of birth for the foreign-born population - Fiji (%)
Place of birth for the foreign-born population - Micronesia (%)
Place of birth for the foreign-born population - Bahamas (%)
Place of birth for the foreign-born population - Barbados (%)
Place of birth for the foreign-born population - Cuba (%)
Place of birth for the foreign-born population - Dominica (%)
Place of birth for the foreign-born population - Dominican Republic (%)
Place of birth for the foreign-born population - Grenada (%)
Place of birth for the foreign-born population - Haiti (%)
Place of birth for the foreign-born population - Jamaica (%)
Place of birth for the foreign-born population - St. Vincent and the Grenadines (%)
Place of birth for the foreign-born population - Trinidad and Tobago (%)
Place of birth for the foreign-born population - West Indies (%)
Place of birth for the foreign-born population - Other Caribbean (%)
Place of birth for the foreign-born population - Belize (%)
Place of birth for the foreign-born population - Costa Rica (%)
Place of birth for the foreign-born population - El Salvador (%)
Place of birth for the foreign-born population - Guatemala (%)
Place of birth for the foreign-born population - Honduras (%)
Place of birth for the foreign-born population - Mexico (%)
Place of birth for the foreign-born population - Nicaragua (%)
Place of birth for the foreign-born population - Panama (%)
Place of birth for the foreign-born population - Other Central America (%)
Place of birth for the foreign-born population - Argentina (%)
Place of birth for the foreign-born population - Bolivia (%)
Place of birth for the foreign-born population - Brazil (%)
Place of birth for the foreign-born population - Chile (%)
Place of birth for the foreign-born population - Colombia (%)
Place of birth for the foreign-born population - Ecuador (%)
Place of birth for the foreign-born population - Guyana (%)
Place of birth for the foreign-born population - Peru (%)
Place of birth for the foreign-born population - Uruguay (%)
Place of birth for the foreign-born population - Venezuela (%)
Place of birth for the foreign-born population - Other South America (%)
Place of birth for the foreign-born population - Canada (%)
Place of birth for the foreign-born population - Other Northern America (%)
Place of birth for the foreign-born population - Other (%)
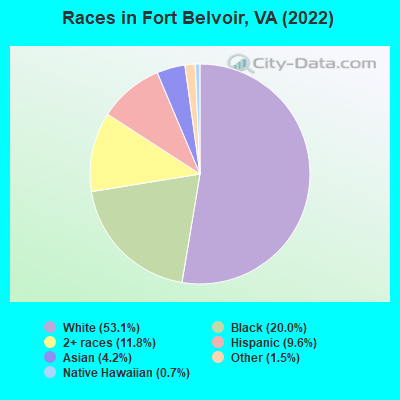
According to 2022 data, the most numerous races in Fort Belvoir, VA are White alone (4,126 residents), Black alone (1,551 residents), and Hispanic (744 residents). 91.8% of Fort Belvoir residents speak English at home. 3.7% of Fort Belvoir, VA residents are foreign-born (2.1% born in Asia, 1.1% born in Latin America), which is 223.6% less than the foreign-born rate of 12.0% across the entire state of Virginia.
Race distribution in Fort Belvoir
2000 2022
4,965,637 70.2% White alone 1,376,378 19.4% Black alone 329,540 4.7% Hispanic 259,277 3.7% Asian alone 114,022 1.6% Two or more races 18,596 0.3% American Indian alone 11,685 0.2% Other race alone 3,380 0.05% Native Hawaiian and Other
5,095,130 58.7% White alone 1,594,785 18.4% Black alone 905,750 10.4% Hispanic 602,881 6.9% Asian alone 406,047 4.7% Two or more races 60,419 0.7% Other race alone 11,738 0.1% American Indian alone 6,869 0.08% Native Hawaiian and Other
Income and house value in Fort Belvoir Median household income in 2022 $101,801 White non-Hispanic householders$116,134 Black householders$92,553 Asian householders$99,347 Two or more races householdersMedian 2022 house value $328,202 Black or African American householders $284,441 Asian householders
Median age by race in Fort Belvoir
22.7 Median age for White residents19.6 24.5 16.8 Median age for Black or African American residents19.6 9.7 -754,182,753.4 Median age for American Indian / Alaska Native residents-964,539,006.1 -669,005,847.3 32.8 Median age for Asian residents24.0 34.5 26.9 Median age for Native Hawaiian / Pacific Islander residents25.4 -584,518,166.9 12.9 Median age for Other race residents12.3 26.0 17.5 Median age for Two or more races residents15.9 18.9 22.3 Median age for White alone residents19.7 23.6 22.1 Median age for Hispanic or Latino residents16.3 25.9
Owner/renter occupied households by race in Fort Belvoir
House owners and renters - White residents 12 1.2% Owner occupied1,049 98.8% Renter occupiedHouse owners and renters - Black or African American residents 5 2.0% Owner occupied229 98.0% Renter occupiedHouse owners and renters - Asian residents 12 16.3% Owner occupied64 83.7% Renter occupiedHouse owners and renters - Native Hawaiian / Pacific Islander residents 8 100.0% Renter occupiedHouse owners and renters - Other race residents 71 100.0% Renter occupiedHouse owners and renters - Two or more races residents 15 3.3% Owner occupied433 96.7% Renter occupiedHouse owners and renters - White alone residents 13 1.2% Owner occupied1,040 98.8% Renter occupiedHouse owners and renters - Hispanic or Latino residents 11 4.9% Owner occupied209 95.1% Renter occupied
Language usage in Fort Belvoir
English speakers - Total 91.8% of residents of Fort Belvoir speak English at home.
5.0% of residents speak Spanish at home 302 88.3% Speak English very well40 11.7% Speak English less than very well3.9% of residents speak other language at home 184 68.7% Speak English very well84 31.3% Speak English less than very well
English speakers - Born in the United States 95.8% of residents of Fort Belvoir speak English at home.
3.5% of residents speak Spanish at home 178 96.7% Speak English very well6 3.3% Speak English less than very well0.7% of residents speak other language at home 39 100.0% Speak English very well
English speakers - Native, born elsewhere 65.2% of residents of Fort Belvoir speak English at home.
21.5% of residents speak Spanish at home 102 92.7% Speak English very well8 7.3% Speak English less than very well12.5% of residents speak other language at home 35 54.7% Speak English very well29 45.3% Speak English less than very well
English speakers - Foreign-born 29.4% of residents of Fort Belvoir speak English at home.
19.4% of residents speak Spanish at home 28 50.0% Speak English very well28 50.0% Speak English less than very well52.2% of residents speak other language at home 109 72.2% Speak English very well42 27.8% Speak English less than very well
White (Caucasian) - Speak only English Native:
97.3% (3,618)Foreign-born:
18.1% (6)
White (Caucasian) - Speak another language Native:
3.7% (139)Foreign-born:
79.2% (25)
Asian - Speak only English Native:
72.0% (167)Foreign-born:
32.4% (31)
Asian - Speak another language Native:
26.0% (60)Foreign-born:
70.3% (67)
Native Hawaiian / Pacific Islander - Speak only English Native:
88.0% (44)Foreign-born:
47.9% (10)
Other race - Speak only English Native:
80.2% (138)Foreign-born:
26.7% (21)
Other race - Speak another language Native:
31.0% (53)Foreign-born:
77.4% (62)
Two or more races - Speak only English Native:
82.8% (863)Foreign-born:
24.6% (27)
Two or more races - Speak another language Native:
16.5% (172)Foreign-born:
75.1% (83)
White alone - Speak only English Native:
97.3% (3,500)Foreign-born:
21.7% (6)
White alone - Speak another language Native:
3.0% (107)Foreign-born:
77.4% (22)
Hispanic or Latino - Speak only English Native:
54.2% (279)Foreign-born:
19.8% (14)
Hispanic or Latino - Speak another language Native:
47.1% (242)Foreign-born:
80.5% (57)
Foreign-born residents in Fort Belvoir 288 residents are foreign born (2.1% Asia , 1.1% Latin America ).
This city:
3.7%Virginia:
12.6%
Marital status for residents in Fort Belvoir Marital status - White (Caucasian) population 15 years and over
Males 19.0% Never married79.6% Now married0.0% Separated0.2% Widowed1.1% DivorcedFemales 13.1% Never married84.3% Now married0.0% Separated0.8% Widowed1.9% DivorcedWomen who gave birth in the past 12 months Now married:
100.0% (160)Unmarried:
0.0% (0)
Women who did not give birth in the past 12 months Now married:
83.1% (730)Unmarried:
16.9% (148)
Marital status - Black or African American population 15 years and over
Males 42.4% Never married55.3% Now married0.0% Separated1.0% Widowed1.3% DivorcedFemales 14.7% Never married64.1% Now married0.0% Separated0.0% Widowed21.2% DivorcedWomen who did not give birth in the past 12 months Now married:
74.8% (164)Unmarried:
25.2% (55)
Marital status - Asian population 15 years and over
Males 44.2% Never married55.8% Now married0.0% Separated0.0% Widowed0.0% DivorcedFemales 28.3% Never married67.6% Now married0.0% Separated0.0% Widowed4.1% DivorcedWomen who gave birth in the past 12 months Now married:
100.0% (5)Unmarried:
0.0% (0)
Women who did not give birth in the past 12 months Now married:
66.4% (81)Unmarried:
33.6% (41)
Marital status - Native Hawaiian / Pacific Islander population 15 years and over
Males 0.0% Never married100.0% Now married0.0% Separated0.0% Widowed0.0% DivorcedFemales 0.0% Never married100.0% Now married0.0% Separated0.0% Widowed0.0% DivorcedWomen who did not give birth in the past 12 months Now married:
100.0% (12)Unmarried:
0.0% (0)
Marital status - Other race population 15 years and over
Males 11.0% Never married89.0% Now married0.0% Separated0.0% Widowed0.0% DivorcedFemales 0.0% Never married87.5% Now married0.0% Separated0.0% Widowed12.5% DivorcedWomen who gave birth in the past 12 months Now married:
100.0% (29)Unmarried:
0.0% (0)
Women who did not give birth in the past 12 months Now married:
68.8% (14)Unmarried:
31.2% (6)
Marital status - Two or more races population 15 years and over
Males 30.7% Never married69.3% Now married0.0% Separated0.0% Widowed0.0% DivorcedFemales 29.3% Never married68.5% Now married0.0% Separated0.0% Widowed2.2% DivorcedWomen who gave birth in the past 12 months Now married:
100.0% (1)Unmarried:
0.0% (0)
Women who did not give birth in the past 12 months Now married:
71.5% (251)Unmarried:
28.5% (100)
Marital status - White alone, not Hispanic / Latino population 15 years and over
Males 20.3% Never married78.3% Now married0.0% Separated0.2% Widowed1.2% DivorcedFemales 10.4% Never married86.7% Now married0.0% Separated0.8% Widowed2.0% DivorcedWomen who gave birth in the past 12 months Now married:
100.0% (167)Unmarried:
0.0% (0)
Women who did not give birth in the past 12 months Now married:
86.7% (771)Unmarried:
13.3% (118)
Marital status - Hispanic or Latino population 15 years and over
Males 11.3% Never married88.7% Now married0.0% Separated0.0% Widowed0.0% DivorcedFemales 25.1% Never married72.0% Now married0.0% Separated0.0% Widowed2.9% DivorcedWomen who gave birth in the past 12 months Now married:
100.0% (18)Unmarried:
0.0% (0)
Women who did not give birth in the past 12 months Now married:
64.2% (88)Unmarried:
35.8% (49)
Ancestries in Fort Belvoir
476 13.9% American233 6.8% Irish225 6.6% German186 5.4% English124 3.6% Italian114 3.3% European26 0.8% Scottish23 0.7% Serbian17 0.5% Polish13 0.4% British11 0.3% Northern European10 0.3% Welsh8 0.2% Barbadian7 0.2% Eastern European6 0.2% Norwegian6 0.2% Scotch-Irish5 0.1% Swiss
Geographical mobility in Fort Belvoir Same house 1 year ago 2,400 59.4% White (Caucasian)1,028 66.3% Black or African American135 41.5% Asian23 32.9% Native Hawaiian / Pacific Islander183 58.5% Other race960 69.6% Two or more races2,448 60.5% White alone, not Hispanic / Latino378 53.3% Hispanic or LatinoMoved within same county 76 1.9% White / Caucasian5 0.3% Black or African American76 1.9% White alone, not Hispanic / Latino8 1.1% Hispanic or LatinoMoved within same state 158 3.9% White / Caucasian17 1.1% Black or African American15 1.1% Two or more races160 4.0% White alone, not Hispanic / Latino7 1.0% Hispanic or LatinoMoved from different state 1,169 28.9% White / Caucasian875 56.4% Black or African American118 36.5% Asian10 14.6% Native Hawaiian / Pacific Islander136 43.6% Other race345 25.0% Two or more races1,138 28.1% White alone, not Hispanic / Latino320 45.2% Hispanic or LatinoMoved from abroad 256 6.3% White83 25.5% Asian26 37.3% Native Hawaiian / Pacific Islander19 1.4% Two or more races245 6.1% White alone, not Hispanic / Latino55 7.8% Hispanic or Latino
Children Nativity (place of birth) in Fort Belvoir
Children under 6 years - Living with two parents Both parents native 1,279 100.0% NativeBoth parents foreign-born 2 100.0% NativeOne native, one foreign-born parent 113 100.0% NativeChildren under 6 years - Living with one parent Native parent 73 100.0% NativeForeign-born parent 7 100.0% NativeChildren 6 to 17 years - Living with two parents Both parents native 1,770 100.0% NativeBoth parents foreign-born 17 50.3% Native16 49.7% Foreign-bornOne native, one foreign-born parent 227 100.0% NativeChildren 6 to 17 years - Living with one parent Native parent 155 100.0% NativeForeign-born parent 8 51.3% Native7 48.7% Foreign-born
Grandparents responsible for own grandchildren in Fort Belvoir
Grandparents (30 to 59 years) White / Caucasian 5 100.0% Not responsible for grandchildrenWhite alone, not Hispanic / Latino 11 100.0% Not responsible for grandchildren
Grandparents (60 years and over) White / Caucasian 5 100.0% Not responsible for grandchildrenWhite alone, not Hispanic / Latino 6 100.0% Not responsible for grandchildren