Races in Halawa, Hawaii (HI) Detailed Stats
Data:
Races - White alone (%)
Races - White alone (% change since 2000)
Races - Black alone (%)
Races - Black alone (% change since 2000)
Races - American Indian alone (%)
Races - American Indian alone (% change since 2000)
Races - Asian alone (%)
Races - Asian alone (% change since 2000)
Races - Hispanic (%)
Races - Hispanic (% change since 2000)
Races - Native Hawaiian and Other Pacific Islander alone (%)
Races - Native Hawaiian and Other Pacific Islander alone (% change since 2000)
Races - Two or more races(%)
Races - Two or more races(% change since 2000)
Races - Other race alone (%)
Races - Other race alone (% change since 2000)
Racial diversity
Place of birth - Born in state of residence (%)
Place of birth - Born in state of residence (%) - White
Place of birth - Born in state of residence (%) - Black or African American
Place of birth - Born in state of residence (%) - Asian
Place of birth - Born in state of residence (%) - Hispanic or Latino
Place of birth - Born in state of residence (%) - American Indian and Alaska Native
Place of birth - Born in state of residence (%) - Multirace
Place of birth - Born in state of residence (%) - Other Race
Place of birth - Born in other state (%)
Place of birth - Born in other state (%) - White
Place of birth - Born in other state (%) - Black or African American
Place of birth - Born in other state (%) - Asian
Place of birth - Born in other state (%) - Hispanic or Latino
Place of birth - Born in other state (%) - American Indian and Alaska Native
Place of birth - Born in other state (%) - Multirace
Place of birth - Born in other state (%) - Other Race
Place of birth - Native, outside of US (%)
Place of birth - Native, outside of US (%) - White
Place of birth - Native, outside of US (%) - Black or African American
Place of birth - Native, outside of US (%) - Asian
Place of birth - Native, outside of US (%) - Hispanic or Latino
Place of birth - Native, outside of US (%) - American Indian and Alaska Native
Place of birth - Native, outside of US (%) - Multirace
Place of birth - Native, outside of US (%) - Other Race
Place of birth - Foreign born (%)
Place of birth - Foreign born (%) - White
Place of birth - Foreign born (%) - Black or African American
Place of birth - Foreign born (%) - Asian
Place of birth - Foreign born (%) - Hispanic or Latino
Place of birth - Foreign born (%) - American Indian and Alaska Native
Place of birth - Foreign born (%) - Multirace
Place of birth - Foreign born (%) - Other Race
Residents speaking English at home (%)
Residents speaking English at home - Born in the United States (%)
Residents speaking English at home - Native, born elsewhere (%)
Residents speaking English at home - Foreign born (%)
Residents speaking Spanish at home (%)
Residents speaking Spanish at home - Born in the United States (%)
Residents speaking Spanish at home - Native, born elsewhere (%)
Residents speaking Spanish at home - Foreign born (%)
Residents speaking other language at home (%)
Residents speaking other language at home - Born in the United States (%)
Residents speaking other language at home - Native, born elsewhere (%)
Residents speaking other language at home - Foreign born (%)
Marital status - Never married (%)
Marital status - Now married (%)
Marital status - Separated (%)
Marital status - Widowed (%)
Marital status - Divorced (%)
Ancestries Reported - Arab (%)
Ancestries Reported - Czech (%)
Ancestries Reported - Danish (%)
Ancestries Reported - Dutch (%)
Ancestries Reported - English (%)
Ancestries Reported - French (%)
Ancestries Reported - French Canadian (%)
Ancestries Reported - German (%)
Ancestries Reported - Greek (%)
Ancestries Reported - Hungarian (%)
Ancestries Reported - Irish (%)
Ancestries Reported - Italian (%)
Ancestries Reported - Lithuanian (%)
Ancestries Reported - Norwegian (%)
Ancestries Reported - Polish (%)
Ancestries Reported - Portuguese (%)
Ancestries Reported - Russian (%)
Ancestries Reported - Scotch-Irish (%)
Ancestries Reported - Scottish (%)
Ancestries Reported - Slovak (%)
Ancestries Reported - Subsaharan African (%)
Ancestries Reported - Swedish (%)
Ancestries Reported - Swiss (%)
Ancestries Reported - Ukrainian (%)
Ancestries Reported - United States (%)
Ancestries Reported - Welsh (%)
Ancestries Reported - West Indian (%)
Ancestries Reported - Other (%)
Geographical mobility - Same house 1 year ago (%)
Geographical mobility - Same house 1 year ago (%) - White
Geographical mobility - Same house 1 year ago (%) - Black or African American
Geographical mobility - Same house 1 year ago (%) - Asian
Geographical mobility - Same house 1 year ago (%) - Hispanic or Latino
Geographical mobility - Same house 1 year ago (%) - American Indian and Alaska Native
Geographical mobility - Same house 1 year ago (%) - Multirace
Geographical mobility - Same house 1 year ago (%) - Other Race
Geographical mobility - Moved within same county (%)
Geographical mobility - Moved within same county (%) - White
Geographical mobility - Moved within same county (%) - Black or African American
Geographical mobility - Moved within same county (%) - Asian
Geographical mobility - Moved within same county (%) - Hispanic or Latino
Geographical mobility - Moved within same county (%) - American Indian and Alaska Native
Geographical mobility - Moved within same county (%) - Multirace
Geographical mobility - Moved within same county (%) - Other Race
Geographical mobility - Moved from different county within same state (%)
Geographical mobility - Moved from different county within same state (%) - White
Geographical mobility - Moved from different county within same state (%) - Black or African American
Geographical mobility - Moved from different county within same state (%) - Asian
Geographical mobility - Moved from different county within same state (%) - Hispanic or Latino
Geographical mobility - Moved from different county within same state (%) - American Indian and Alaska Native
Geographical mobility - Moved from different county within same state (%) - Multirace
Geographical mobility - Moved from different county within same state (%) - Other Race
Geographical mobility - Moved from different state (%)
Geographical mobility - Moved from different state (%) - White
Geographical mobility - Moved from different state (%) - Black or African American
Geographical mobility - Moved from different state (%) - Asian
Geographical mobility - Moved from different state (%) - Hispanic or Latino
Geographical mobility - Moved from different state (%) - American Indian and Alaska Native
Geographical mobility - Moved from different state (%) - Multirace
Geographical mobility - Moved from different state (%) - Other Race
Geographical mobility - Moved from abroad (%)
Geographical mobility - Moved from abroad (%) - White
Geographical mobility - Moved from abroad (%) - Black or African American
Geographical mobility - Moved from abroad (%) - Asian
Geographical mobility - Moved from abroad (%) - Hispanic or Latino
Geographical mobility - Moved from abroad (%) - American Indian and Alaska Native
Geographical mobility - Moved from abroad (%) - Multirace
Geographical mobility - Moved from abroad (%) - Other Race
Place of birth for the foreign-born population - Ireland (%)
Place of birth for the foreign-born population - Denmark (%)
Place of birth for the foreign-born population - Norway (%)
Place of birth for the foreign-born population - Sweden (%)
Place of birth for the foreign-born population - United Kingdom (%)
Place of birth for the foreign-born population - England (%)
Place of birth for the foreign-born population - Scotland (%)
Place of birth for the foreign-born population - Other Northern Europe (%)
Place of birth for the foreign-born population - Austria (%)
Place of birth for the foreign-born population - Belgium (%)
Place of birth for the foreign-born population - France (%)
Place of birth for the foreign-born population - Germany (%)
Place of birth for the foreign-born population - Netherlands (%)
Place of birth for the foreign-born population - Switzerland (%)
Place of birth for the foreign-born population - Other Western Europe (%)
Place of birth for the foreign-born population - Greece (%)
Place of birth for the foreign-born population - Italy (%)
Place of birth for the foreign-born population - Portugal (%)
Place of birth for the foreign-born population - Spain (%)
Place of birth for the foreign-born population - Other Southern Europe (%)
Place of birth for the foreign-born population - Albania (%)
Place of birth for the foreign-born population - Belarus (%)
Place of birth for the foreign-born population - Bosnia and Herzegovina (%)
Place of birth for the foreign-born population - Bulgaria (%)
Place of birth for the foreign-born population - Croatia (%)
Place of birth for the foreign-born population - Czechoslovakia (%)
Place of birth for the foreign-born population - Hungary (%)
Place of birth for the foreign-born population - Latvia (%)
Place of birth for the foreign-born population - Lithuania (%)
Place of birth for the foreign-born population - North Macedonia (Macedonia) (%)
Place of birth for the foreign-born population - Moldova (%)
Place of birth for the foreign-born population - Poland (%)
Place of birth for the foreign-born population - Romania (%)
Place of birth for the foreign-born population - Russia (%)
Place of birth for the foreign-born population - Serbia (%)
Place of birth for the foreign-born population - Ukraine (%)
Place of birth for the foreign-born population - Other Eastern Europe (%)
Place of birth for the foreign-born population - China (%)
Place of birth for the foreign-born population - Hong Kong (%)
Place of birth for the foreign-born population - Taiwan (%)
Place of birth for the foreign-born population - Japan (%)
Place of birth for the foreign-born population - Korea (%)
Place of birth for the foreign-born population - Other Eastern Asia (%)
Place of birth for the foreign-born population - Afghanistan (%)
Place of birth for the foreign-born population - Bangladesh (%)
Place of birth for the foreign-born population - India (%)
Place of birth for the foreign-born population - Iran (%)
Place of birth for the foreign-born population - Kazakhstan (%)
Place of birth for the foreign-born population - Nepal (%)
Place of birth for the foreign-born population - Pakistan (%)
Place of birth for the foreign-born population - Sri Lanka (%)
Place of birth for the foreign-born population - Uzbekistan (%)
Place of birth for the foreign-born population - Other South Central Asia (%)
Place of birth for the foreign-born population - Burma (%)
Place of birth for the foreign-born population - Cambodia (%)
Place of birth for the foreign-born population - Indonesia (%)
Place of birth for the foreign-born population - Laos (%)
Place of birth for the foreign-born population - Malaysia (%)
Place of birth for the foreign-born population - Philippines (%)
Place of birth for the foreign-born population - Singapore (%)
Place of birth for the foreign-born population - Thailand (%)
Place of birth for the foreign-born population - Vietnam (%)
Place of birth for the foreign-born population - Other South Eastern Asia (%)
Place of birth for the foreign-born population - Armenia (%)
Place of birth for the foreign-born population - Iraq (%)
Place of birth for the foreign-born population - Israel (%)
Place of birth for the foreign-born population - Jordan (%)
Place of birth for the foreign-born population - Kuwait (%)
Place of birth for the foreign-born population - Lebanon (%)
Place of birth for the foreign-born population - Saudi Arabia (%)
Place of birth for the foreign-born population - Syria (%)
Place of birth for the foreign-born population - Turkey (%)
Place of birth for the foreign-born population - Yemen (%)
Place of birth for the foreign-born population - Other Western Asia (%)
Place of birth for the foreign-born population - Eritrea (%)
Place of birth for the foreign-born population - Ethiopia (%)
Place of birth for the foreign-born population - Kenya (%)
Place of birth for the foreign-born population - Somalia (%)
Place of birth for the foreign-born population - Uganda (%)
Place of birth for the foreign-born population - Zimbabwe (%)
Place of birth for the foreign-born population - Other Eastern Africa (%)
Place of birth for the foreign-born population - Cameroon (%)
Place of birth for the foreign-born population - Congo (%)
Place of birth for the foreign-born population - Democratic Republic of Congo (Zaire) (%)
Place of birth for the foreign-born population - Other Middle Africa (%)
Place of birth for the foreign-born population - Egypt (%)
Place of birth for the foreign-born population - Morocco (%)
Place of birth for the foreign-born population - Sudan (%)
Place of birth for the foreign-born population - Other Northern Africa (%)
Place of birth for the foreign-born population - South Africa (%)
Place of birth for the foreign-born population - Other Southern Africa (%)
Place of birth for the foreign-born population - Cabo Verde (%)
Place of birth for the foreign-born population - Ghana (%)
Place of birth for the foreign-born population - Liberia (%)
Place of birth for the foreign-born population - Nigeria (%)
Place of birth for the foreign-born population - Senegal (%)
Place of birth for the foreign-born population - Sierra Leone (%)
Place of birth for the foreign-born population - Other Western Africa (%)
Place of birth for the foreign-born population - Australia (%)
Place of birth for the foreign-born population - New Zealand (%)
Place of birth for the foreign-born population - Fiji (%)
Place of birth for the foreign-born population - Micronesia (%)
Place of birth for the foreign-born population - Bahamas (%)
Place of birth for the foreign-born population - Barbados (%)
Place of birth for the foreign-born population - Cuba (%)
Place of birth for the foreign-born population - Dominica (%)
Place of birth for the foreign-born population - Dominican Republic (%)
Place of birth for the foreign-born population - Grenada (%)
Place of birth for the foreign-born population - Haiti (%)
Place of birth for the foreign-born population - Jamaica (%)
Place of birth for the foreign-born population - St. Vincent and the Grenadines (%)
Place of birth for the foreign-born population - Trinidad and Tobago (%)
Place of birth for the foreign-born population - West Indies (%)
Place of birth for the foreign-born population - Other Caribbean (%)
Place of birth for the foreign-born population - Belize (%)
Place of birth for the foreign-born population - Costa Rica (%)
Place of birth for the foreign-born population - El Salvador (%)
Place of birth for the foreign-born population - Guatemala (%)
Place of birth for the foreign-born population - Honduras (%)
Place of birth for the foreign-born population - Mexico (%)
Place of birth for the foreign-born population - Nicaragua (%)
Place of birth for the foreign-born population - Panama (%)
Place of birth for the foreign-born population - Other Central America (%)
Place of birth for the foreign-born population - Argentina (%)
Place of birth for the foreign-born population - Bolivia (%)
Place of birth for the foreign-born population - Brazil (%)
Place of birth for the foreign-born population - Chile (%)
Place of birth for the foreign-born population - Colombia (%)
Place of birth for the foreign-born population - Ecuador (%)
Place of birth for the foreign-born population - Guyana (%)
Place of birth for the foreign-born population - Peru (%)
Place of birth for the foreign-born population - Uruguay (%)
Place of birth for the foreign-born population - Venezuela (%)
Place of birth for the foreign-born population - Other South America (%)
Place of birth for the foreign-born population - Canada (%)
Place of birth for the foreign-born population - Other Northern America (%)
Place of birth for the foreign-born population - Other (%)
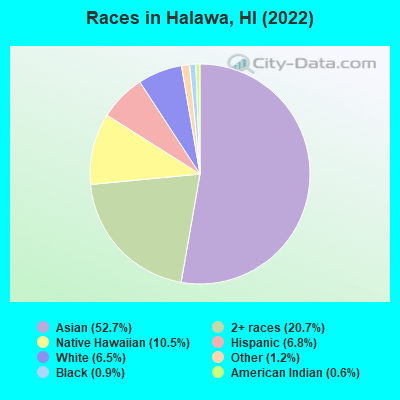
According to 2022 data, the most numerous races in Halawa, HI are Asian alone (7,492 residents), Two or more races (2,936 residents), and White alone (929 residents). 69.5% of Halawa residents speak English at home. 22.9% of Halawa, HI residents are foreign-born (16.8% born in Asia, 4.7% born in Oceania), which is 21.5% greater than the foreign-born rate of 18.0% across the entire state of Hawaii.
Race distribution in Halawa
2000 2022
494,149 40.8% Asian alone 277,091 22.9% White alone 218,700 18.1% Two or more races 108,441 9.0% Native Hawaiian and Other 87,699 7.2% Hispanic 20,829 1.7% Black alone 2,089 0.2% Other race alone 2,539 0.2% American Indian alone
498,125 34.6% Asian alone 318,574 22.1% Two or more races 297,937 20.7% White alone 160,103 11.1% Hispanic 134,567 9.3% Native Hawaiian and Other 23,682 1.6% Black alone 5,378 0.4% Other race alone 1,830 0.1% American Indian alone
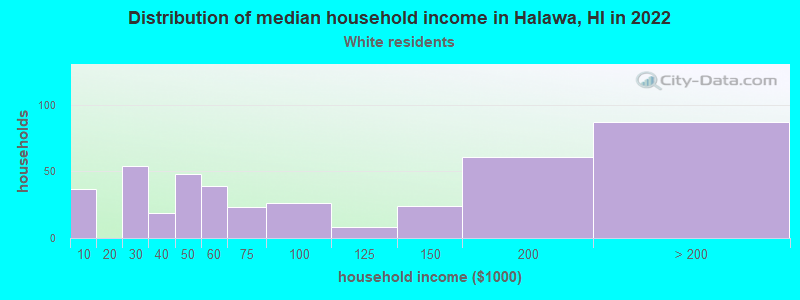
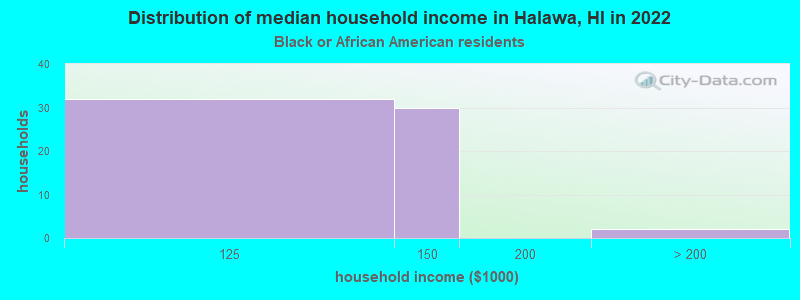
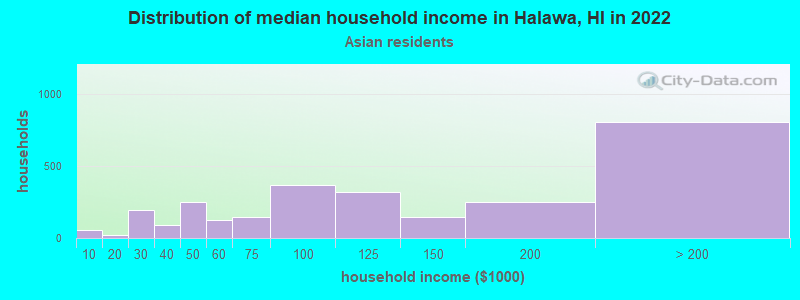
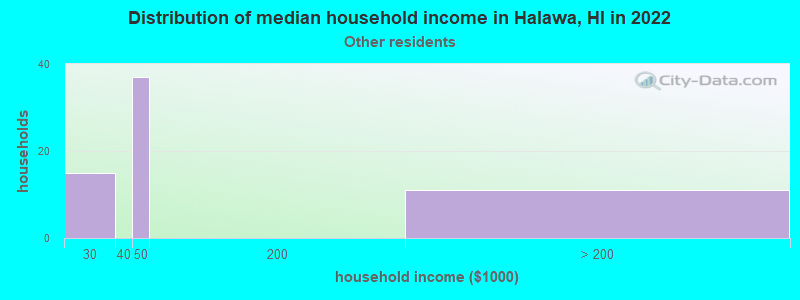
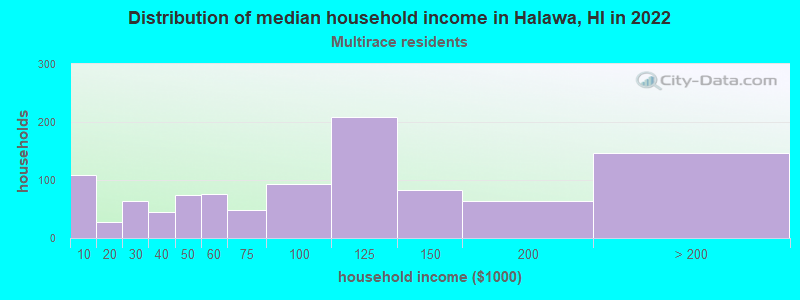
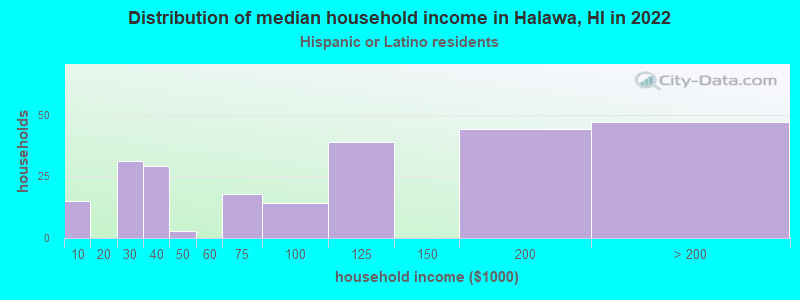
Income and house value in Halawa Median household income in 2022 $79,124 White non-Hispanic householders$104,666 Black householders$105,781 Asian householders$34,349 Native Hawaiian and other Pacific Islander householders$41,589 Some other race householders$96,831 Two or more races householders$108,907 Hispanic or Latino race householdersMedian 2022 house value over $1,000,000 White Non-Hispanic householders$974,564 Black or African American householders over $1,000,000 Asian householdersover $1,000,000 Native Hawaiian and other Pacific Islander householders$987,186 Two or more races householders$958,532 Hispanic or Latino householders
Median age by race in Halawa
46.9 Median age for White residents40.0 52.4 48.8 Median age for Black or African American residents46.2 -709,604,519.1 29.3 Median age for American Indian / Alaska Native residents-715,953,306.7 8.4 55.3 Median age for Asian residents54.5 58.1 28.6 Median age for Native Hawaiian / Pacific Islander residents33.5 25.3 45.0 Median age for Other race residents54.5 44.8 30.5 Median age for Two or more races residents28.2 33.5 51.8 Median age for White alone residents41.2 52.9 25.0 Median age for Hispanic or Latino residents24.6 27.8
Owner/renter occupied households by race in Halawa
House owners and renters - White residents 222 53.1% Owner occupied196 46.9% Renter occupiedHouse owners and renters - Black or African American residents 5 7.9% Owner occupied59 92.1% Renter occupiedHouse owners and renters - American Indian / Alaska Native residents 19 100.0% Renter occupiedHouse owners and renters - Asian residents 2,396 86.3% Owner occupied381 13.7% Renter occupiedHouse owners and renters - Native Hawaiian / Pacific Islander residents 83 18.0% Owner occupied378 82.0% Renter occupiedHouse owners and renters - Other race residents 77 85.9% Owner occupied13 14.1% Renter occupiedHouse owners and renters - Two or more races residents 512 49.8% Owner occupied517 50.2% Renter occupiedHouse owners and renters - White alone residents 222 57.5% Owner occupied164 42.5% Renter occupiedHouse owners and renters - Hispanic or Latino residents 49 21.1% Owner occupied185 78.9% Renter occupied
Language usage in Halawa
English speakers - Total 69.5% of residents of Halawa speak English at home.
0.5% of residents speak Spanish at home 39 60.0% Speak English very well26 40.0% Speak English less than very well29.5% of residents speak other language at home 1,662 41.2% Speak English very well2,371 58.8% Speak English less than very well
English speakers - Born in the United States 88.9% of residents of Halawa speak English at home.
0.7% of residents speak Spanish at home 14 100.0% Speak English very well7.5% of residents speak other language at home 79 54.5% Speak English very well66 45.5% Speak English less than very well
English speakers - Native, born elsewhere 62.2% of residents of Halawa speak English at home.
1.0% of residents speak Spanish at home 6 100.0% Speak English very well35.9% of residents speak other language at home 90 42.3% Speak English very well123 57.7% Speak English less than very well
English speakers - Foreign-born 8.9% of residents of Halawa speak English at home.
1.0% of residents speak Spanish at home 31 100.0% Speak English less than very well90.3% of residents speak other language at home 841 30.4% Speak English very well1,924 69.6% Speak English less than very well
White (Caucasian) - Speak only English Native:
98.0% (928)Foreign-born:
18.3% (9)
White (Caucasian) - Speak another language Native:
2.8% (26)Foreign-born:
76.5% (37)
Black or African American - Speak another language Native:
6.7% (8)Foreign-born:
100.0% (3)
Asian - Speak only English Native:
85.1% (4,342)Foreign-born:
5.9% (130)
Asian - Speak another language Native:
14.8% (754)Foreign-born:
94.2% (2,082)
Native Hawaiian / Pacific Islander - Speak only English Native:
74.7% (585)Foreign-born:
18.5% (121)
Native Hawaiian / Pacific Islander - Speak another language Native:
24.5% (192)Foreign-born:
81.0% (527)
Other race - Speak another language Native:
15.4% (39)Foreign-born:
98.0% (15)
Two or more races - Speak only English Native:
90.0% (3,008)Foreign-born:
5.5% (9)
Two or more races - Speak another language Native:
10.0% (336)Foreign-born:
93.8% (147)
White alone - Speak only English Native:
96.7% (849)Foreign-born:
17.1% (9)
White alone - Speak another language Native:
3.4% (30)Foreign-born:
82.5% (43)
Hispanic or Latino - Speak another language Native:
4.4% (39)Foreign-born:
95.6% (20)
Foreign-born residents in Halawa 3,257 residents are foreign born (16.8% Asia , 4.7% Oceania ).
This city:
22.9%Hawaii:
18.0%
Marital status for residents in Halawa Marital status - White (Caucasian) population 15 years and over
Males 51.7% Never married40.2% Now married1.3% Separated2.2% Widowed4.5% DivorcedFemales 19.6% Never married40.8% Now married0.0% Separated18.4% Widowed21.2% DivorcedWomen who did not give birth in the past 12 months Now married:
32.4% (55)Unmarried:
67.6% (115)
Marital status - Black or African American population 15 years and over
Males 24.4% Never married42.9% Now married10.9% Separated5.9% Widowed16.0% DivorcedFemales 0.0% Never married100.0% Now married0.0% Separated0.0% Widowed0.0% DivorcedWomen who did not give birth in the past 12 months Now married:
100.0% (24)Unmarried:
0.0% (0)
Marital status - American Indian / Alaska Native population 15 years and over
Males 100.0% Never married0.0% Now married0.0% Separated0.0% Widowed0.0% DivorcedFemales 0.0% Never married0.0% Now married0.0% Separated0.0% Widowed100.0% DivorcedWomen who did not give birth in the past 12 months Now married:
0.0% (0)Unmarried:
100.0% (28)
Marital status - Asian population 15 years and over
Males 32.9% Never married55.7% Now married1.6% Separated2.8% Widowed6.9% DivorcedFemales 22.5% Never married46.3% Now married0.2% Separated15.6% Widowed15.4% DivorcedWomen who gave birth in the past 12 months Now married:
86.8% (56)Unmarried:
13.2% (9)
Women who did not give birth in the past 12 months Now married:
37.6% (494)Unmarried:
62.4% (820)
Marital status - Native Hawaiian / Pacific Islander population 15 years and over
Males 53.9% Never married38.1% Now married0.0% Separated1.3% Widowed6.7% DivorcedFemales 51.3% Never married38.1% Now married5.2% Separated1.9% Widowed3.5% DivorcedWomen who gave birth in the past 12 months Now married:
0.0% (0)Unmarried:
100.0% (25)
Women who did not give birth in the past 12 months Now married:
39.0% (168)Unmarried:
61.0% (261)
Marital status - Other race population 15 years and over
Males 31.0% Never married69.0% Now married0.0% Separated0.0% Widowed0.0% DivorcedFemales 8.3% Never married71.2% Now married0.0% Separated0.0% Widowed20.5% DivorcedWomen who did not give birth in the past 12 months Now married:
77.6% (139)Unmarried:
22.4% (40)
Marital status - Two or more races population 15 years and over
Males 49.0% Never married43.8% Now married0.0% Separated3.5% Widowed3.7% DivorcedFemales 44.7% Never married35.3% Now married0.4% Separated5.5% Widowed14.2% DivorcedWomen who gave birth in the past 12 months Now married:
55.0% (12)Unmarried:
45.0% (10)
Women who did not give birth in the past 12 months Now married:
31.4% (315)Unmarried:
68.6% (687)
Marital status - White alone, not Hispanic / Latino population 15 years and over
Males 53.9% Never married38.8% Now married1.5% Separated0.9% Widowed5.0% DivorcedFemales 21.2% Never married36.0% Now married0.0% Separated19.9% Widowed23.0% DivorcedWomen who did not give birth in the past 12 months Now married:
18.0% (26)Unmarried:
82.0% (118)
Marital status - Hispanic or Latino population 15 years and over
Males 66.6% Never married27.2% Now married0.0% Separated3.4% Widowed2.8% DivorcedFemales 33.7% Never married47.3% Now married1.4% Separated0.6% Widowed17.0% DivorcedWomen who did not give birth in the past 12 months Now married:
45.8% (132)Unmarried:
54.2% (156)
Ancestries in Halawa
58 0.8% American56 0.7% German51 0.7% African19 0.2% Irish18 0.2% English13 0.2% Portuguese8 0.1% Scottish7 0.09% Italian7 0.09% Nigerian5 0.07% French3 0.04% Eastern European
Children Nativity (place of birth) in Halawa
Children under 6 years - Living with two parents Both parents native 283 99.0% Native3 1.0% Foreign-bornBoth parents foreign-born 87 86.5% Native14 13.5% Foreign-bornOne native, one foreign-born parent 45 100.0% NativeChildren under 6 years - Living with one parent Native parent 115 100.0% NativeForeign-born parent 67 100.0% NativeChildren 6 to 17 years - Living with two parents Both parents native 636 99.2% Native5 0.8% Foreign-bornBoth parents foreign-born 109 47.7% Native119 52.3% Foreign-bornOne native, one foreign-born parent 53 100.0% NativeChildren 6 to 17 years - Living with one parent Native parent 380 100.0% NativeForeign-born parent 67 45.6% Native80 54.4% Foreign-born
Grandparents responsible for own grandchildren in Halawa
Grandparents (30 to 59 years) Asian 7 8.1% Responsible for grandchildren76 91.9% Not responsible for grandchildrenNative Hawaiian / Pacific Islander 20 45.1% Responsible for grandchildren24 54.9% Not responsible for grandchildrenTwo or more races 14 64.8% Responsible for grandchildren7 35.2% Not responsible for grandchildrenGrandparents (60 years and over) Asian 17 3.8% Responsible for grandchildren434 96.2% Not responsible for grandchildrenNative Hawaiian / Pacific Islander 14 27.2% Responsible for grandchildren37 72.8% Not responsible for grandchildrenTwo or more races 9 11.8% Responsible for grandchildren68 88.2% Not responsible for grandchildren