Races in Hastings, Minnesota (MN) Detailed Stats
Data:
Races - White alone (%)
Races - White alone (% change since 2000)
Races - Black alone (%)
Races - Black alone (% change since 2000)
Races - American Indian alone (%)
Races - American Indian alone (% change since 2000)
Races - Asian alone (%)
Races - Asian alone (% change since 2000)
Races - Hispanic (%)
Races - Hispanic (% change since 2000)
Races - Native Hawaiian and Other Pacific Islander alone (%)
Races - Native Hawaiian and Other Pacific Islander alone (% change since 2000)
Races - Two or more races(%)
Races - Two or more races(% change since 2000)
Races - Other race alone (%)
Races - Other race alone (% change since 2000)
Racial diversity
Place of birth - Born in state of residence (%)
Place of birth - Born in state of residence (%) - White
Place of birth - Born in state of residence (%) - Black or African American
Place of birth - Born in state of residence (%) - Asian
Place of birth - Born in state of residence (%) - Hispanic or Latino
Place of birth - Born in state of residence (%) - American Indian and Alaska Native
Place of birth - Born in state of residence (%) - Multirace
Place of birth - Born in state of residence (%) - Other Race
Place of birth - Born in other state (%)
Place of birth - Born in other state (%) - White
Place of birth - Born in other state (%) - Black or African American
Place of birth - Born in other state (%) - Asian
Place of birth - Born in other state (%) - Hispanic or Latino
Place of birth - Born in other state (%) - American Indian and Alaska Native
Place of birth - Born in other state (%) - Multirace
Place of birth - Born in other state (%) - Other Race
Place of birth - Native, outside of US (%)
Place of birth - Native, outside of US (%) - White
Place of birth - Native, outside of US (%) - Black or African American
Place of birth - Native, outside of US (%) - Asian
Place of birth - Native, outside of US (%) - Hispanic or Latino
Place of birth - Native, outside of US (%) - American Indian and Alaska Native
Place of birth - Native, outside of US (%) - Multirace
Place of birth - Native, outside of US (%) - Other Race
Place of birth - Foreign born (%)
Place of birth - Foreign born (%) - White
Place of birth - Foreign born (%) - Black or African American
Place of birth - Foreign born (%) - Asian
Place of birth - Foreign born (%) - Hispanic or Latino
Place of birth - Foreign born (%) - American Indian and Alaska Native
Place of birth - Foreign born (%) - Multirace
Place of birth - Foreign born (%) - Other Race
Residents speaking English at home (%)
Residents speaking English at home - Born in the United States (%)
Residents speaking English at home - Native, born elsewhere (%)
Residents speaking English at home - Foreign born (%)
Residents speaking Spanish at home (%)
Residents speaking Spanish at home - Born in the United States (%)
Residents speaking Spanish at home - Native, born elsewhere (%)
Residents speaking Spanish at home - Foreign born (%)
Residents speaking other language at home (%)
Residents speaking other language at home - Born in the United States (%)
Residents speaking other language at home - Native, born elsewhere (%)
Residents speaking other language at home - Foreign born (%)
Marital status - Never married (%)
Marital status - Now married (%)
Marital status - Separated (%)
Marital status - Widowed (%)
Marital status - Divorced (%)
Ancestries Reported - Arab (%)
Ancestries Reported - Czech (%)
Ancestries Reported - Danish (%)
Ancestries Reported - Dutch (%)
Ancestries Reported - English (%)
Ancestries Reported - French (%)
Ancestries Reported - French Canadian (%)
Ancestries Reported - German (%)
Ancestries Reported - Greek (%)
Ancestries Reported - Hungarian (%)
Ancestries Reported - Irish (%)
Ancestries Reported - Italian (%)
Ancestries Reported - Lithuanian (%)
Ancestries Reported - Norwegian (%)
Ancestries Reported - Polish (%)
Ancestries Reported - Portuguese (%)
Ancestries Reported - Russian (%)
Ancestries Reported - Scotch-Irish (%)
Ancestries Reported - Scottish (%)
Ancestries Reported - Slovak (%)
Ancestries Reported - Subsaharan African (%)
Ancestries Reported - Swedish (%)
Ancestries Reported - Swiss (%)
Ancestries Reported - Ukrainian (%)
Ancestries Reported - United States (%)
Ancestries Reported - Welsh (%)
Ancestries Reported - West Indian (%)
Ancestries Reported - Other (%)
Geographical mobility - Same house 1 year ago (%)
Geographical mobility - Same house 1 year ago (%) - White
Geographical mobility - Same house 1 year ago (%) - Black or African American
Geographical mobility - Same house 1 year ago (%) - Asian
Geographical mobility - Same house 1 year ago (%) - Hispanic or Latino
Geographical mobility - Same house 1 year ago (%) - American Indian and Alaska Native
Geographical mobility - Same house 1 year ago (%) - Multirace
Geographical mobility - Same house 1 year ago (%) - Other Race
Geographical mobility - Moved within same county (%)
Geographical mobility - Moved within same county (%) - White
Geographical mobility - Moved within same county (%) - Black or African American
Geographical mobility - Moved within same county (%) - Asian
Geographical mobility - Moved within same county (%) - Hispanic or Latino
Geographical mobility - Moved within same county (%) - American Indian and Alaska Native
Geographical mobility - Moved within same county (%) - Multirace
Geographical mobility - Moved within same county (%) - Other Race
Geographical mobility - Moved from different county within same state (%)
Geographical mobility - Moved from different county within same state (%) - White
Geographical mobility - Moved from different county within same state (%) - Black or African American
Geographical mobility - Moved from different county within same state (%) - Asian
Geographical mobility - Moved from different county within same state (%) - Hispanic or Latino
Geographical mobility - Moved from different county within same state (%) - American Indian and Alaska Native
Geographical mobility - Moved from different county within same state (%) - Multirace
Geographical mobility - Moved from different county within same state (%) - Other Race
Geographical mobility - Moved from different state (%)
Geographical mobility - Moved from different state (%) - White
Geographical mobility - Moved from different state (%) - Black or African American
Geographical mobility - Moved from different state (%) - Asian
Geographical mobility - Moved from different state (%) - Hispanic or Latino
Geographical mobility - Moved from different state (%) - American Indian and Alaska Native
Geographical mobility - Moved from different state (%) - Multirace
Geographical mobility - Moved from different state (%) - Other Race
Geographical mobility - Moved from abroad (%)
Geographical mobility - Moved from abroad (%) - White
Geographical mobility - Moved from abroad (%) - Black or African American
Geographical mobility - Moved from abroad (%) - Asian
Geographical mobility - Moved from abroad (%) - Hispanic or Latino
Geographical mobility - Moved from abroad (%) - American Indian and Alaska Native
Geographical mobility - Moved from abroad (%) - Multirace
Geographical mobility - Moved from abroad (%) - Other Race
Place of birth for the foreign-born population - Ireland (%)
Place of birth for the foreign-born population - Denmark (%)
Place of birth for the foreign-born population - Norway (%)
Place of birth for the foreign-born population - Sweden (%)
Place of birth for the foreign-born population - United Kingdom (%)
Place of birth for the foreign-born population - England (%)
Place of birth for the foreign-born population - Scotland (%)
Place of birth for the foreign-born population - Other Northern Europe (%)
Place of birth for the foreign-born population - Austria (%)
Place of birth for the foreign-born population - Belgium (%)
Place of birth for the foreign-born population - France (%)
Place of birth for the foreign-born population - Germany (%)
Place of birth for the foreign-born population - Netherlands (%)
Place of birth for the foreign-born population - Switzerland (%)
Place of birth for the foreign-born population - Other Western Europe (%)
Place of birth for the foreign-born population - Greece (%)
Place of birth for the foreign-born population - Italy (%)
Place of birth for the foreign-born population - Portugal (%)
Place of birth for the foreign-born population - Spain (%)
Place of birth for the foreign-born population - Other Southern Europe (%)
Place of birth for the foreign-born population - Albania (%)
Place of birth for the foreign-born population - Belarus (%)
Place of birth for the foreign-born population - Bosnia and Herzegovina (%)
Place of birth for the foreign-born population - Bulgaria (%)
Place of birth for the foreign-born population - Croatia (%)
Place of birth for the foreign-born population - Czechoslovakia (%)
Place of birth for the foreign-born population - Hungary (%)
Place of birth for the foreign-born population - Latvia (%)
Place of birth for the foreign-born population - Lithuania (%)
Place of birth for the foreign-born population - North Macedonia (Macedonia) (%)
Place of birth for the foreign-born population - Moldova (%)
Place of birth for the foreign-born population - Poland (%)
Place of birth for the foreign-born population - Romania (%)
Place of birth for the foreign-born population - Russia (%)
Place of birth for the foreign-born population - Serbia (%)
Place of birth for the foreign-born population - Ukraine (%)
Place of birth for the foreign-born population - Other Eastern Europe (%)
Place of birth for the foreign-born population - China (%)
Place of birth for the foreign-born population - Hong Kong (%)
Place of birth for the foreign-born population - Taiwan (%)
Place of birth for the foreign-born population - Japan (%)
Place of birth for the foreign-born population - Korea (%)
Place of birth for the foreign-born population - Other Eastern Asia (%)
Place of birth for the foreign-born population - Afghanistan (%)
Place of birth for the foreign-born population - Bangladesh (%)
Place of birth for the foreign-born population - India (%)
Place of birth for the foreign-born population - Iran (%)
Place of birth for the foreign-born population - Kazakhstan (%)
Place of birth for the foreign-born population - Nepal (%)
Place of birth for the foreign-born population - Pakistan (%)
Place of birth for the foreign-born population - Sri Lanka (%)
Place of birth for the foreign-born population - Uzbekistan (%)
Place of birth for the foreign-born population - Other South Central Asia (%)
Place of birth for the foreign-born population - Burma (%)
Place of birth for the foreign-born population - Cambodia (%)
Place of birth for the foreign-born population - Indonesia (%)
Place of birth for the foreign-born population - Laos (%)
Place of birth for the foreign-born population - Malaysia (%)
Place of birth for the foreign-born population - Philippines (%)
Place of birth for the foreign-born population - Singapore (%)
Place of birth for the foreign-born population - Thailand (%)
Place of birth for the foreign-born population - Vietnam (%)
Place of birth for the foreign-born population - Other South Eastern Asia (%)
Place of birth for the foreign-born population - Armenia (%)
Place of birth for the foreign-born population - Iraq (%)
Place of birth for the foreign-born population - Israel (%)
Place of birth for the foreign-born population - Jordan (%)
Place of birth for the foreign-born population - Kuwait (%)
Place of birth for the foreign-born population - Lebanon (%)
Place of birth for the foreign-born population - Saudi Arabia (%)
Place of birth for the foreign-born population - Syria (%)
Place of birth for the foreign-born population - Turkey (%)
Place of birth for the foreign-born population - Yemen (%)
Place of birth for the foreign-born population - Other Western Asia (%)
Place of birth for the foreign-born population - Eritrea (%)
Place of birth for the foreign-born population - Ethiopia (%)
Place of birth for the foreign-born population - Kenya (%)
Place of birth for the foreign-born population - Somalia (%)
Place of birth for the foreign-born population - Uganda (%)
Place of birth for the foreign-born population - Zimbabwe (%)
Place of birth for the foreign-born population - Other Eastern Africa (%)
Place of birth for the foreign-born population - Cameroon (%)
Place of birth for the foreign-born population - Congo (%)
Place of birth for the foreign-born population - Democratic Republic of Congo (Zaire) (%)
Place of birth for the foreign-born population - Other Middle Africa (%)
Place of birth for the foreign-born population - Egypt (%)
Place of birth for the foreign-born population - Morocco (%)
Place of birth for the foreign-born population - Sudan (%)
Place of birth for the foreign-born population - Other Northern Africa (%)
Place of birth for the foreign-born population - South Africa (%)
Place of birth for the foreign-born population - Other Southern Africa (%)
Place of birth for the foreign-born population - Cabo Verde (%)
Place of birth for the foreign-born population - Ghana (%)
Place of birth for the foreign-born population - Liberia (%)
Place of birth for the foreign-born population - Nigeria (%)
Place of birth for the foreign-born population - Senegal (%)
Place of birth for the foreign-born population - Sierra Leone (%)
Place of birth for the foreign-born population - Other Western Africa (%)
Place of birth for the foreign-born population - Australia (%)
Place of birth for the foreign-born population - New Zealand (%)
Place of birth for the foreign-born population - Fiji (%)
Place of birth for the foreign-born population - Micronesia (%)
Place of birth for the foreign-born population - Bahamas (%)
Place of birth for the foreign-born population - Barbados (%)
Place of birth for the foreign-born population - Cuba (%)
Place of birth for the foreign-born population - Dominica (%)
Place of birth for the foreign-born population - Dominican Republic (%)
Place of birth for the foreign-born population - Grenada (%)
Place of birth for the foreign-born population - Haiti (%)
Place of birth for the foreign-born population - Jamaica (%)
Place of birth for the foreign-born population - St. Vincent and the Grenadines (%)
Place of birth for the foreign-born population - Trinidad and Tobago (%)
Place of birth for the foreign-born population - West Indies (%)
Place of birth for the foreign-born population - Other Caribbean (%)
Place of birth for the foreign-born population - Belize (%)
Place of birth for the foreign-born population - Costa Rica (%)
Place of birth for the foreign-born population - El Salvador (%)
Place of birth for the foreign-born population - Guatemala (%)
Place of birth for the foreign-born population - Honduras (%)
Place of birth for the foreign-born population - Mexico (%)
Place of birth for the foreign-born population - Nicaragua (%)
Place of birth for the foreign-born population - Panama (%)
Place of birth for the foreign-born population - Other Central America (%)
Place of birth for the foreign-born population - Argentina (%)
Place of birth for the foreign-born population - Bolivia (%)
Place of birth for the foreign-born population - Brazil (%)
Place of birth for the foreign-born population - Chile (%)
Place of birth for the foreign-born population - Colombia (%)
Place of birth for the foreign-born population - Ecuador (%)
Place of birth for the foreign-born population - Guyana (%)
Place of birth for the foreign-born population - Peru (%)
Place of birth for the foreign-born population - Uruguay (%)
Place of birth for the foreign-born population - Venezuela (%)
Place of birth for the foreign-born population - Other South America (%)
Place of birth for the foreign-born population - Canada (%)
Place of birth for the foreign-born population - Other Northern America (%)
Place of birth for the foreign-born population - Other (%)
Latest news about races in Hastings, MN collected exclusively by city-data.com from local newspapers, TV, and radio stations
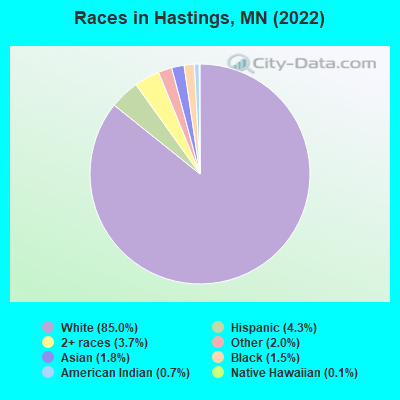
According to 2022 data, the most numerous races in Hastings, MN are White alone (18,922 residents), Black alone (337 residents), and Hispanic (958 residents). 96.2% of Hastings residents speak English at home. 2.1% of Hastings, MN residents are foreign-born (1.0% born in Latin America, 0.4% born in Asia, 0.4% born in Europe), which is 289.0% less than the foreign-born rate of 8.0% across the entire state of Minnesota.
Race distribution in Hastings
2000 2022
4,337,143 88.2% White alone 168,813 3.4% Black alone 143,382 2.9% Hispanic 141,083 2.9% Asian alone 70,304 1.4% Two or more races 52,009 1.1% American Indian alone 5,031 0.1% Other race alone 1,714 0.03% Native Hawaiian and Other
4,356,347 76.2% White alone 395,179 6.9% Black alone 333,830 5.8% Hispanic 294,800 5.2% Asian alone 259,649 4.5% Two or more races 42,125 0.7% American Indian alone 32,976 0.6% Other race alone 2,278 0.04% Native Hawaiian and Other
Income and house value in Hastings Median household income in 2022 $84,968 White non-Hispanic householders$84,772 Asian householdersMedian 2022 house value $302,402 White Non-Hispanic householders$327,200 American Indian or Alaska Native householders $319,393 Asian householders$430,527 Some other race householders$308,601 Two or more races householders$274,159 Hispanic or Latino householders
Median age by race in Hastings
45.3 Median age for White residents44.8 45.6 25.4 Median age for Black or African American residents31.6 24.4 26.1 Median age for American Indian / Alaska Native residents25.9 33.5 23.4 Median age for Asian residents9.5 23.7 57.6 Median age for Native Hawaiian / Pacific Islander residents-856,799,036.4 -534,959,349.1 21.5 Median age for Other race residents23.2 27.4 22.0 Median age for Two or more races residents15.0 38.1 45.5 Median age for White alone residents45.1 45.8 19.3 Median age for Hispanic or Latino residents18.6 28.0
Owner/renter occupied households by race in Hastings
House owners and renters - White residents 6,137 72.4% Owner occupied2,342 27.6% Renter occupiedHouse owners and renters - Black or African American residents 8 11.5% Owner occupied64 88.5% Renter occupiedHouse owners and renters - American Indian / Alaska Native residents 11 71.3% Owner occupied5 28.7% Renter occupiedHouse owners and renters - Asian residents 57 84.1% Owner occupied11 15.9% Renter occupiedHouse owners and renters - Native Hawaiian / Pacific Islander residents 50 100.0% Owner occupiedHouse owners and renters - Other race residents 103 43.7% Owner occupied133 56.3% Renter occupiedHouse owners and renters - Two or more races residents 116 54.6% Owner occupied97 45.4% Renter occupiedHouse owners and renters - White alone residents 6,129 72.4% Owner occupied2,339 27.6% Renter occupiedHouse owners and renters - Hispanic or Latino residents 159 72.8% Owner occupied59 27.2% Renter occupied
Language usage in Hastings
English speakers - Total 96.2% of residents of Hastings speak English at home.
1.6% of residents speak Spanish at home 275 79.5% Speak English very well71 20.5% Speak English less than very well1.5% of residents speak other language at home 198 60.7% Speak English very well128 39.3% Speak English less than very well
English speakers - Born in the United States 96.0% of residents of Hastings speak English at home.
2.4% of residents speak Spanish at home 129 100.0% Speak English very well1.1% of residents speak other language at home 58 100.0% Speak English very well
English speakers - Native, born elsewhere 97.9% of residents of Hastings speak English at home.
4.3% of residents speak Spanish at home 2 100.0% Speak English very well
English speakers - Foreign-born 31.6% of residents of Hastings speak English at home.
33.1% of residents speak Spanish at home 74 47.4% Speak English very well82 52.6% Speak English less than very well30.7% of residents speak other language at home 56 38.6% Speak English very well89 61.4% Speak English less than very well
White (Caucasian) - Speak only English Native:
99.2% (18,202)Foreign-born:
36.7% (56)
White (Caucasian) - Speak another language Native:
1.0% (190)Foreign-born:
61.1% (92)
Black or African American - Speak only English Native:
93.8% (268)Foreign-born:
67.9% (20)
Asian - Speak only English Native:
84.9% (257)Foreign-born:
0.9% (1)
Asian - Speak another language Native:
21.6% (65)Foreign-born:
98.9% (100)
Other race - Speak only English Native:
78.0% (263)Foreign-born:
74.8% (116)
Other race - Speak another language Native:
12.5% (42)Foreign-born:
38.5% (60)
Two or more races - Speak only English Native:
100.0% (697)Foreign-born:
24.4% (10)
White alone - Speak only English Native:
99.4% (18,022)Foreign-born:
61.9% (60)
White alone - Speak another language Native:
0.8% (137)Foreign-born:
40.0% (39)
Hispanic or Latino - Speak only English Native:
73.3% (396)Foreign-born:
21.1% (57)
Hispanic or Latino - Speak another language Native:
26.2% (142)Foreign-born:
73.1% (195)
Foreign-born residents in Hastings 458 residents are foreign born (1.0% Latin America , 0.4% Asia , 0.4% Europe ).
This city:
2.1%Minnesota:
8.5%
Marital status for residents in Hastings Marital status - White (Caucasian) population 15 years and over
Males 31.4% Never married54.5% Now married0.7% Separated2.1% Widowed11.4% DivorcedFemales 23.9% Never married52.3% Now married0.8% Separated10.0% Widowed13.0% DivorcedWomen who gave birth in the past 12 months Now married:
74.1% (121)Unmarried:
25.9% (42)
Women who did not give birth in the past 12 months Now married:
49.4% (1,749)Unmarried:
50.6% (1,794)
Marital status - Black or African American population 15 years and over
Males 53.7% Never married41.8% Now married3.4% Separated0.0% Widowed1.1% DivorcedFemales 7.6% Never married81.8% Now married0.0% Separated0.0% Widowed10.6% DivorcedWomen who did not give birth in the past 12 months Now married:
91.5% (64)Unmarried:
8.5% (6)
Marital status - American Indian / Alaska Native population 15 years and over
Males 78.4% Never married11.8% Now married0.0% Separated9.8% Widowed0.0% DivorcedFemales 57.5% Never married21.8% Now married0.0% Separated6.9% Widowed13.8% DivorcedWomen who did not give birth in the past 12 months Now married:
23.5% (20)Unmarried:
76.5% (65)
Marital status - Asian population 15 years and over
Males 34.9% Never married65.1% Now married0.0% Separated0.0% Widowed0.0% DivorcedFemales 45.2% Never married41.9% Now married0.0% Separated0.0% Widowed12.9% DivorcedWomen who gave birth in the past 12 months Now married:
100.0% (7)Unmarried:
0.0% (0)
Women who did not give birth in the past 12 months Now married:
28.0% (34)Unmarried:
72.0% (87)
Marital status - Native Hawaiian / Pacific Islander population 15 years and over
Males 0.0% Never married100.0% Now married0.0% Separated0.0% Widowed0.0% DivorcedFemales 0.0% Never married100.0% Now married0.0% Separated0.0% Widowed0.0% DivorcedMarital status - Other race population 15 years and over
Males 82.2% Never married17.8% Now married0.0% Separated0.0% Widowed0.0% DivorcedFemales 69.9% Never married30.1% Now married0.0% Separated0.0% Widowed0.0% DivorcedWomen who did not give birth in the past 12 months Now married:
13.1% (19)Unmarried:
86.9% (125)
Marital status - Two or more races population 15 years and over
Males 19.7% Never married55.5% Now married0.0% Separated0.0% Widowed24.8% DivorcedFemales 40.1% Never married46.5% Now married0.0% Separated3.0% Widowed10.4% DivorcedWomen who gave birth in the past 12 months Now married:
0.0% (0)Unmarried:
100.0% (33)
Women who did not give birth in the past 12 months Now married:
50.7% (132)Unmarried:
49.3% (128)
Marital status - White alone, not Hispanic / Latino population 15 years and over
Males 31.8% Never married54.0% Now married0.7% Separated1.9% Widowed11.6% DivorcedFemales 24.2% Never married52.1% Now married0.8% Separated9.8% Widowed13.1% DivorcedWomen who gave birth in the past 12 months Now married:
69.3% (67)Unmarried:
30.7% (30)
Women who did not give birth in the past 12 months Now married:
49.6% (1,796)Unmarried:
50.4% (1,828)
Marital status - Hispanic or Latino population 15 years and over
Males 23.1% Never married69.0% Now married0.0% Separated7.8% Widowed0.0% DivorcedFemales 32.8% Never married49.3% Now married0.0% Separated12.7% Widowed5.2% DivorcedWomen who gave birth in the past 12 months Now married:
80.8% (62)Unmarried:
19.2% (15)
Women who did not give birth in the past 12 months Now married:
12.9% (14)Unmarried:
87.1% (93)
Ancestries in Hastings
2,887 35.1% German849 10.3% Norwegian685 8.3% English683 8.3% American513 6.2% European461 5.6% Irish145 1.8% Hungarian128 1.6% French123 1.5% Polish102 1.2% Swedish93 1.1% Lebanese93 1.1% Danish82 1.0% Italian79 1.0% Czech73 0.9% Brazilian49 0.6% Dutch39 0.5% French Canadian38 0.5% Finnish21 0.3% Belgian21 0.3% Portuguese21 0.3% Scottish18 0.2% Swiss17 0.2% Nigerian15 0.2% Canadian15 0.2% African14 0.2% Scandinavian14 0.2% South African11 0.1% Luxembourger10 0.1% Austrian7 0.09% Czechoslovakian5 0.06% Scotch-Irish4 0.05% Ethiopian1 0.01% Russian
Children Nativity (place of birth) in Hastings
Children under 6 years - Living with two parents Both parents native 912 100.0% NativeOne native, one foreign-born parent 29 100.0% NativeChildren under 6 years - Living with one parent Native parent 211 100.0% NativeForeign-born parent 3 100.0% NativeChildren 6 to 17 years - Living with two parents Both parents native 2,675 99.8% Native4 0.2% Foreign-bornOne native, one foreign-born parent 176 100.0% NativeChildren 6 to 17 years - Living with one parent Native parent 531 100.0% NativeForeign-born parent 35 48.3% Native37 51.7% Foreign-born
Grandparents responsible for own grandchildren in Hastings
Grandparents (30 to 59 years) White / Caucasian 24 50.2% Responsible for grandchildren24 49.8% Not responsible for grandchildrenTwo or more races 7 100.0% Responsible for grandchildrenWhite alone, not Hispanic / Latino 25 62.2% Responsible for grandchildren15 37.8% Not responsible for grandchildrenHispanic or Latino 10 100.0% Not responsible for grandchildrenGrandparents (60 years and over) White / Caucasian 54 27.1% Responsible for grandchildren146 72.9% Not responsible for grandchildrenWhite alone, not Hispanic / Latino 54 29.3% Responsible for grandchildren131 70.7% Not responsible for grandchildrenHispanic or Latino 12 100.0% Not responsible for grandchildren