Races in Hickam Housing, Hawaii (HI) Detailed Stats
Data:
Races - White alone (%)
Races - White alone (% change since 2000)
Races - Black alone (%)
Races - Black alone (% change since 2000)
Races - American Indian alone (%)
Races - American Indian alone (% change since 2000)
Races - Asian alone (%)
Races - Asian alone (% change since 2000)
Races - Hispanic (%)
Races - Hispanic (% change since 2000)
Races - Native Hawaiian and Other Pacific Islander alone (%)
Races - Native Hawaiian and Other Pacific Islander alone (% change since 2000)
Races - Two or more races(%)
Races - Two or more races(% change since 2000)
Races - Other race alone (%)
Races - Other race alone (% change since 2000)
Racial diversity
Place of birth - Born in state of residence (%)
Place of birth - Born in state of residence (%) - White
Place of birth - Born in state of residence (%) - Black or African American
Place of birth - Born in state of residence (%) - Asian
Place of birth - Born in state of residence (%) - Hispanic or Latino
Place of birth - Born in state of residence (%) - American Indian and Alaska Native
Place of birth - Born in state of residence (%) - Multirace
Place of birth - Born in state of residence (%) - Other Race
Place of birth - Born in other state (%)
Place of birth - Born in other state (%) - White
Place of birth - Born in other state (%) - Black or African American
Place of birth - Born in other state (%) - Asian
Place of birth - Born in other state (%) - Hispanic or Latino
Place of birth - Born in other state (%) - American Indian and Alaska Native
Place of birth - Born in other state (%) - Multirace
Place of birth - Born in other state (%) - Other Race
Place of birth - Native, outside of US (%)
Place of birth - Native, outside of US (%) - White
Place of birth - Native, outside of US (%) - Black or African American
Place of birth - Native, outside of US (%) - Asian
Place of birth - Native, outside of US (%) - Hispanic or Latino
Place of birth - Native, outside of US (%) - American Indian and Alaska Native
Place of birth - Native, outside of US (%) - Multirace
Place of birth - Native, outside of US (%) - Other Race
Place of birth - Foreign born (%)
Place of birth - Foreign born (%) - White
Place of birth - Foreign born (%) - Black or African American
Place of birth - Foreign born (%) - Asian
Place of birth - Foreign born (%) - Hispanic or Latino
Place of birth - Foreign born (%) - American Indian and Alaska Native
Place of birth - Foreign born (%) - Multirace
Place of birth - Foreign born (%) - Other Race
Residents speaking English at home (%)
Residents speaking English at home - Born in the United States (%)
Residents speaking English at home - Native, born elsewhere (%)
Residents speaking English at home - Foreign born (%)
Residents speaking Spanish at home (%)
Residents speaking Spanish at home - Born in the United States (%)
Residents speaking Spanish at home - Native, born elsewhere (%)
Residents speaking Spanish at home - Foreign born (%)
Residents speaking other language at home (%)
Residents speaking other language at home - Born in the United States (%)
Residents speaking other language at home - Native, born elsewhere (%)
Residents speaking other language at home - Foreign born (%)
Marital status - Never married (%)
Marital status - Now married (%)
Marital status - Separated (%)
Marital status - Widowed (%)
Marital status - Divorced (%)
Ancestries Reported - Arab (%)
Ancestries Reported - Czech (%)
Ancestries Reported - Danish (%)
Ancestries Reported - Dutch (%)
Ancestries Reported - English (%)
Ancestries Reported - French (%)
Ancestries Reported - French Canadian (%)
Ancestries Reported - German (%)
Ancestries Reported - Greek (%)
Ancestries Reported - Hungarian (%)
Ancestries Reported - Irish (%)
Ancestries Reported - Italian (%)
Ancestries Reported - Lithuanian (%)
Ancestries Reported - Norwegian (%)
Ancestries Reported - Polish (%)
Ancestries Reported - Portuguese (%)
Ancestries Reported - Russian (%)
Ancestries Reported - Scotch-Irish (%)
Ancestries Reported - Scottish (%)
Ancestries Reported - Slovak (%)
Ancestries Reported - Subsaharan African (%)
Ancestries Reported - Swedish (%)
Ancestries Reported - Swiss (%)
Ancestries Reported - Ukrainian (%)
Ancestries Reported - United States (%)
Ancestries Reported - Welsh (%)
Ancestries Reported - West Indian (%)
Ancestries Reported - Other (%)
Geographical mobility - Same house 1 year ago (%)
Geographical mobility - Same house 1 year ago (%) - White
Geographical mobility - Same house 1 year ago (%) - Black or African American
Geographical mobility - Same house 1 year ago (%) - Asian
Geographical mobility - Same house 1 year ago (%) - Hispanic or Latino
Geographical mobility - Same house 1 year ago (%) - American Indian and Alaska Native
Geographical mobility - Same house 1 year ago (%) - Multirace
Geographical mobility - Same house 1 year ago (%) - Other Race
Geographical mobility - Moved within same county (%)
Geographical mobility - Moved within same county (%) - White
Geographical mobility - Moved within same county (%) - Black or African American
Geographical mobility - Moved within same county (%) - Asian
Geographical mobility - Moved within same county (%) - Hispanic or Latino
Geographical mobility - Moved within same county (%) - American Indian and Alaska Native
Geographical mobility - Moved within same county (%) - Multirace
Geographical mobility - Moved within same county (%) - Other Race
Geographical mobility - Moved from different county within same state (%)
Geographical mobility - Moved from different county within same state (%) - White
Geographical mobility - Moved from different county within same state (%) - Black or African American
Geographical mobility - Moved from different county within same state (%) - Asian
Geographical mobility - Moved from different county within same state (%) - Hispanic or Latino
Geographical mobility - Moved from different county within same state (%) - American Indian and Alaska Native
Geographical mobility - Moved from different county within same state (%) - Multirace
Geographical mobility - Moved from different county within same state (%) - Other Race
Geographical mobility - Moved from different state (%)
Geographical mobility - Moved from different state (%) - White
Geographical mobility - Moved from different state (%) - Black or African American
Geographical mobility - Moved from different state (%) - Asian
Geographical mobility - Moved from different state (%) - Hispanic or Latino
Geographical mobility - Moved from different state (%) - American Indian and Alaska Native
Geographical mobility - Moved from different state (%) - Multirace
Geographical mobility - Moved from different state (%) - Other Race
Geographical mobility - Moved from abroad (%)
Geographical mobility - Moved from abroad (%) - White
Geographical mobility - Moved from abroad (%) - Black or African American
Geographical mobility - Moved from abroad (%) - Asian
Geographical mobility - Moved from abroad (%) - Hispanic or Latino
Geographical mobility - Moved from abroad (%) - American Indian and Alaska Native
Geographical mobility - Moved from abroad (%) - Multirace
Geographical mobility - Moved from abroad (%) - Other Race
Place of birth for the foreign-born population - Ireland (%)
Place of birth for the foreign-born population - Denmark (%)
Place of birth for the foreign-born population - Norway (%)
Place of birth for the foreign-born population - Sweden (%)
Place of birth for the foreign-born population - United Kingdom (%)
Place of birth for the foreign-born population - England (%)
Place of birth for the foreign-born population - Scotland (%)
Place of birth for the foreign-born population - Other Northern Europe (%)
Place of birth for the foreign-born population - Austria (%)
Place of birth for the foreign-born population - Belgium (%)
Place of birth for the foreign-born population - France (%)
Place of birth for the foreign-born population - Germany (%)
Place of birth for the foreign-born population - Netherlands (%)
Place of birth for the foreign-born population - Switzerland (%)
Place of birth for the foreign-born population - Other Western Europe (%)
Place of birth for the foreign-born population - Greece (%)
Place of birth for the foreign-born population - Italy (%)
Place of birth for the foreign-born population - Portugal (%)
Place of birth for the foreign-born population - Spain (%)
Place of birth for the foreign-born population - Other Southern Europe (%)
Place of birth for the foreign-born population - Albania (%)
Place of birth for the foreign-born population - Belarus (%)
Place of birth for the foreign-born population - Bosnia and Herzegovina (%)
Place of birth for the foreign-born population - Bulgaria (%)
Place of birth for the foreign-born population - Croatia (%)
Place of birth for the foreign-born population - Czechoslovakia (%)
Place of birth for the foreign-born population - Hungary (%)
Place of birth for the foreign-born population - Latvia (%)
Place of birth for the foreign-born population - Lithuania (%)
Place of birth for the foreign-born population - North Macedonia (Macedonia) (%)
Place of birth for the foreign-born population - Moldova (%)
Place of birth for the foreign-born population - Poland (%)
Place of birth for the foreign-born population - Romania (%)
Place of birth for the foreign-born population - Russia (%)
Place of birth for the foreign-born population - Serbia (%)
Place of birth for the foreign-born population - Ukraine (%)
Place of birth for the foreign-born population - Other Eastern Europe (%)
Place of birth for the foreign-born population - China (%)
Place of birth for the foreign-born population - Hong Kong (%)
Place of birth for the foreign-born population - Taiwan (%)
Place of birth for the foreign-born population - Japan (%)
Place of birth for the foreign-born population - Korea (%)
Place of birth for the foreign-born population - Other Eastern Asia (%)
Place of birth for the foreign-born population - Afghanistan (%)
Place of birth for the foreign-born population - Bangladesh (%)
Place of birth for the foreign-born population - India (%)
Place of birth for the foreign-born population - Iran (%)
Place of birth for the foreign-born population - Kazakhstan (%)
Place of birth for the foreign-born population - Nepal (%)
Place of birth for the foreign-born population - Pakistan (%)
Place of birth for the foreign-born population - Sri Lanka (%)
Place of birth for the foreign-born population - Uzbekistan (%)
Place of birth for the foreign-born population - Other South Central Asia (%)
Place of birth for the foreign-born population - Burma (%)
Place of birth for the foreign-born population - Cambodia (%)
Place of birth for the foreign-born population - Indonesia (%)
Place of birth for the foreign-born population - Laos (%)
Place of birth for the foreign-born population - Malaysia (%)
Place of birth for the foreign-born population - Philippines (%)
Place of birth for the foreign-born population - Singapore (%)
Place of birth for the foreign-born population - Thailand (%)
Place of birth for the foreign-born population - Vietnam (%)
Place of birth for the foreign-born population - Other South Eastern Asia (%)
Place of birth for the foreign-born population - Armenia (%)
Place of birth for the foreign-born population - Iraq (%)
Place of birth for the foreign-born population - Israel (%)
Place of birth for the foreign-born population - Jordan (%)
Place of birth for the foreign-born population - Kuwait (%)
Place of birth for the foreign-born population - Lebanon (%)
Place of birth for the foreign-born population - Saudi Arabia (%)
Place of birth for the foreign-born population - Syria (%)
Place of birth for the foreign-born population - Turkey (%)
Place of birth for the foreign-born population - Yemen (%)
Place of birth for the foreign-born population - Other Western Asia (%)
Place of birth for the foreign-born population - Eritrea (%)
Place of birth for the foreign-born population - Ethiopia (%)
Place of birth for the foreign-born population - Kenya (%)
Place of birth for the foreign-born population - Somalia (%)
Place of birth for the foreign-born population - Uganda (%)
Place of birth for the foreign-born population - Zimbabwe (%)
Place of birth for the foreign-born population - Other Eastern Africa (%)
Place of birth for the foreign-born population - Cameroon (%)
Place of birth for the foreign-born population - Congo (%)
Place of birth for the foreign-born population - Democratic Republic of Congo (Zaire) (%)
Place of birth for the foreign-born population - Other Middle Africa (%)
Place of birth for the foreign-born population - Egypt (%)
Place of birth for the foreign-born population - Morocco (%)
Place of birth for the foreign-born population - Sudan (%)
Place of birth for the foreign-born population - Other Northern Africa (%)
Place of birth for the foreign-born population - South Africa (%)
Place of birth for the foreign-born population - Other Southern Africa (%)
Place of birth for the foreign-born population - Cabo Verde (%)
Place of birth for the foreign-born population - Ghana (%)
Place of birth for the foreign-born population - Liberia (%)
Place of birth for the foreign-born population - Nigeria (%)
Place of birth for the foreign-born population - Senegal (%)
Place of birth for the foreign-born population - Sierra Leone (%)
Place of birth for the foreign-born population - Other Western Africa (%)
Place of birth for the foreign-born population - Australia (%)
Place of birth for the foreign-born population - New Zealand (%)
Place of birth for the foreign-born population - Fiji (%)
Place of birth for the foreign-born population - Micronesia (%)
Place of birth for the foreign-born population - Bahamas (%)
Place of birth for the foreign-born population - Barbados (%)
Place of birth for the foreign-born population - Cuba (%)
Place of birth for the foreign-born population - Dominica (%)
Place of birth for the foreign-born population - Dominican Republic (%)
Place of birth for the foreign-born population - Grenada (%)
Place of birth for the foreign-born population - Haiti (%)
Place of birth for the foreign-born population - Jamaica (%)
Place of birth for the foreign-born population - St. Vincent and the Grenadines (%)
Place of birth for the foreign-born population - Trinidad and Tobago (%)
Place of birth for the foreign-born population - West Indies (%)
Place of birth for the foreign-born population - Other Caribbean (%)
Place of birth for the foreign-born population - Belize (%)
Place of birth for the foreign-born population - Costa Rica (%)
Place of birth for the foreign-born population - El Salvador (%)
Place of birth for the foreign-born population - Guatemala (%)
Place of birth for the foreign-born population - Honduras (%)
Place of birth for the foreign-born population - Mexico (%)
Place of birth for the foreign-born population - Nicaragua (%)
Place of birth for the foreign-born population - Panama (%)
Place of birth for the foreign-born population - Other Central America (%)
Place of birth for the foreign-born population - Argentina (%)
Place of birth for the foreign-born population - Bolivia (%)
Place of birth for the foreign-born population - Brazil (%)
Place of birth for the foreign-born population - Chile (%)
Place of birth for the foreign-born population - Colombia (%)
Place of birth for the foreign-born population - Ecuador (%)
Place of birth for the foreign-born population - Guyana (%)
Place of birth for the foreign-born population - Peru (%)
Place of birth for the foreign-born population - Uruguay (%)
Place of birth for the foreign-born population - Venezuela (%)
Place of birth for the foreign-born population - Other South America (%)
Place of birth for the foreign-born population - Canada (%)
Place of birth for the foreign-born population - Other Northern America (%)
Place of birth for the foreign-born population - Other (%)
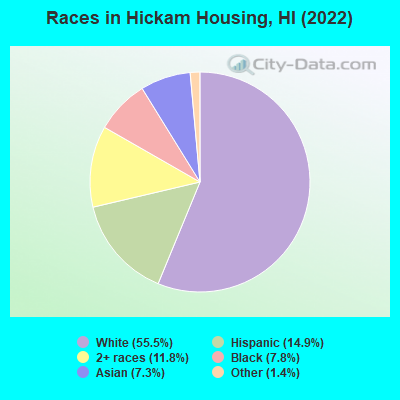
According to 2022 data, the most numerous races in Hickam Housing, HI are Asian alone (683 residents), Two or more races (1,105 residents), and White alone (5,197 residents). 90.5% of Hickam Housing residents speak English at home. 7.1% of Hickam Housing, HI residents are foreign-born (4.2% born in Asia, 1.8% born in Latin America), which is 154.3% less than the foreign-born rate of 18.0% across the entire state of Hawaii.
Race distribution in Hickam Housing
2000 2022
494,149 40.8% Asian alone 277,091 22.9% White alone 218,700 18.1% Two or more races 108,441 9.0% Native Hawaiian and Other 87,699 7.2% Hispanic 20,829 1.7% Black alone 2,089 0.2% Other race alone 2,539 0.2% American Indian alone
498,125 34.6% Asian alone 318,574 22.1% Two or more races 297,937 20.7% White alone 160,103 11.1% Hispanic 134,567 9.3% Native Hawaiian and Other 23,682 1.6% Black alone 5,378 0.4% Other race alone 1,830 0.1% American Indian alone
Income and house value in Hickam Housing Median household income in 2022 $122,848 White non-Hispanic householders$79,150 Black householders$111,906 Asian householders$69,793 Some other race householders$109,089 Two or more races householders$71,544 Hispanic or Latino race householdersMedian 2022 house value $-934,236,421 White Non-Hispanic householders
Median age by race in Hickam Housing
27.0 Median age for White residents26.1 27.4 30.5 Median age for Black or African American residents31.3 26.5 -693,430,656.2 Median age for American Indian / Alaska Native residents-715,953,306.7 -629,508,196.1 36.5 Median age for Asian residents20.9 40.4 -676,587,300.9 Median age for Native Hawaiian / Pacific Islander residents-672,782,873.9 -682,170,542.0 26.0 Median age for Other race residents26.5 20.3 13.6 Median age for Two or more races residents15.3 13.5 27.2 Median age for White alone residents25.9 27.7 24.1 Median age for Hispanic or Latino residents26.7 23.0
Owner/renter occupied households by race in Hickam Housing
House owners and renters - White residents 8 0.4% Owner occupied1,795 99.6% Renter occupiedHouse owners and renters - Black or African American residents 424 100.0% Renter occupiedHouse owners and renters - American Indian / Alaska Native residents 9 100.0% Renter occupiedHouse owners and renters - Asian residents 102 100.0% Renter occupiedHouse owners and renters - Native Hawaiian / Pacific Islander residents 3 100.0% Renter occupiedHouse owners and renters - Other race residents 127 100.0% Renter occupiedHouse owners and renters - Two or more races residents 286 100.0% Renter occupiedHouse owners and renters - White alone residents 8 0.5% Owner occupied1,641 99.5% Renter occupiedHouse owners and renters - Hispanic or Latino residents 477 100.0% Renter occupied
Language usage in Hickam Housing
English speakers - Total 90.5% of residents of Hickam Housing speak English at home.
3.8% of residents speak Spanish at home 293 92.4% Speak English very well24 7.6% Speak English less than very well6.8% of residents speak other language at home 404 70.9% Speak English very well166 29.1% Speak English less than very well
English speakers - Born in the United States 94.8% of residents of Hickam Housing speak English at home.
2.6% of residents speak Spanish at home 176 98.3% Speak English very well3 1.7% Speak English less than very well2.7% of residents speak other language at home 164 85.9% Speak English very well27 14.1% Speak English less than very well
English speakers - Native, born elsewhere 80.6% of residents of Hickam Housing speak English at home.
12.6% of residents speak Spanish at home 47 100.0% Speak English very well10.2% of residents speak other language at home 38 100.0% Speak English very well
English speakers - Foreign-born 42.3% of residents of Hickam Housing speak English at home.
12.3% of residents speak Spanish at home 52 67.5% Speak English very well25 32.5% Speak English less than very well45.4% of residents speak other language at home 162 57.2% Speak English very well121 42.8% Speak English less than very well
White (Caucasian) - Speak only English Native:
96.5% (4,674)Foreign-born:
41.9% (54)
White (Caucasian) - Speak another language Native:
3.9% (190)Foreign-born:
56.3% (72)
Black or African American - Speak only English Native:
100.0% (754)Foreign-born:
100.0% (44)
Asian - Speak only English Native:
79.9% (276)Foreign-born:
33.1% (123)
Asian - Speak another language Native:
19.7% (68)Foreign-born:
66.8% (249)
Other race - Speak another language Native:
17.8% (77)Foreign-born:
98.0% (15)
Two or more races - Speak another language Native:
12.4% (148)Foreign-born:
99.2% (28)
White alone - Speak only English Native:
96.4% (4,319)Foreign-born:
78.2% (54)
White alone - Speak another language Native:
3.7% (166)Foreign-born:
22.1% (15)
Hispanic or Latino - Speak another language Native:
18.5% (235)Foreign-born:
95.6% (82)
Foreign-born residents in Hickam Housing 663 residents are foreign born (4.2% Asia , 1.8% Latin America ).
This city:
7.1%Hawaii:
18.0%
Marital status for residents in Hickam Housing Marital status - White (Caucasian) population 15 years and over
Males 22.6% Never married75.8% Now married0.0% Separated0.0% Widowed1.6% DivorcedFemales 16.0% Never married79.7% Now married0.8% Separated1.1% Widowed2.4% DivorcedWomen who gave birth in the past 12 months Now married:
100.0% (77)Unmarried:
0.0% (0)
Women who did not give birth in the past 12 months Now married:
80.0% (1,125)Unmarried:
20.0% (282)
Marital status - Black or African American population 15 years and over
Males 41.0% Never married48.5% Now married0.0% Separated0.0% Widowed10.5% DivorcedFemales 53.5% Never married39.8% Now married0.0% Separated0.0% Widowed6.7% DivorcedWomen who did not give birth in the past 12 months Now married:
37.0% (116)Unmarried:
63.0% (197)
Marital status - Asian population 15 years and over
Males 38.5% Never married61.0% Now married0.0% Separated0.0% Widowed0.5% DivorcedFemales 16.5% Never married79.2% Now married0.0% Separated0.0% Widowed4.3% DivorcedWomen who gave birth in the past 12 months Now married:
100.0% (33)Unmarried:
0.0% (0)
Women who did not give birth in the past 12 months Now married:
74.8% (214)Unmarried:
25.2% (72)
Marital status - Other race population 15 years and over
Males 16.6% Never married65.6% Now married0.0% Separated0.0% Widowed17.8% DivorcedFemales 8.8% Never married91.2% Now married0.0% Separated0.0% Widowed0.0% DivorcedWomen who gave birth in the past 12 months Now married:
100.0% (16)Unmarried:
0.0% (0)
Women who did not give birth in the past 12 months Now married:
90.3% (140)Unmarried:
9.7% (15)
Marital status - Two or more races population 15 years and over
Males 30.1% Never married62.9% Now married0.0% Separated0.0% Widowed7.0% DivorcedFemales 21.9% Never married70.5% Now married0.0% Separated0.0% Widowed7.5% DivorcedWomen who did not give birth in the past 12 months Now married:
72.3% (181)Unmarried:
27.7% (69)
Marital status - White alone, not Hispanic / Latino population 15 years and over
Males 22.5% Never married75.7% Now married0.0% Separated0.0% Widowed1.8% DivorcedFemales 14.0% Never married81.2% Now married0.9% Separated1.2% Widowed2.7% DivorcedWomen who gave birth in the past 12 months Now married:
100.0% (79)Unmarried:
0.0% (0)
Women who did not give birth in the past 12 months Now married:
81.8% (1,064)Unmarried:
18.2% (237)
Marital status - Hispanic or Latino population 15 years and over
Males 20.0% Never married74.7% Now married0.0% Separated0.0% Widowed5.3% DivorcedFemales 20.4% Never married75.0% Now married0.0% Separated0.0% Widowed4.6% DivorcedWomen who did not give birth in the past 12 months Now married:
78.2% (328)Unmarried:
21.8% (91)
Ancestries in Hickam Housing
607 13.4% English252 5.5% Irish229 5.0% German218 4.8% American170 3.7% European119 2.6% French104 2.3% Jamaican50 1.1% Trinidadian and Tobagonian46 1.0% Italian45 1.0% Scottish26 0.6% Nigerian23 0.5% British22 0.5% African20 0.4% Dutch19 0.4% Swedish17 0.4% Ukrainian16 0.4% Slavic15 0.3% Czechoslovakian14 0.3% Brazilian10 0.2% Norwegian9 0.2% Egyptian9 0.2% Slovak8 0.2% Arab7 0.2% French Canadian7 0.2% Russian3 0.07% Swiss
Children Nativity (place of birth) in Hickam Housing
Children under 6 years - Living with two parents Both parents native 876 100.0% NativeBoth parents foreign-born 10 100.0% NativeOne native, one foreign-born parent 148 100.0% NativeChildren under 6 years - Living with one parent Native parent 57 100.0% NativeChildren 6 to 17 years - Living with two parents Both parents native 1,532 99.1% Native13 0.9% Foreign-bornBoth parents foreign-born 81 91.5% Native8 8.5% Foreign-bornOne native, one foreign-born parent 208 88.8% Native26 11.2% Foreign-bornChildren 6 to 17 years - Living with one parent Native parent 176 100.0% Native
Grandparents responsible for own grandchildren in Hickam Housing
Grandparents (30 to 59 years) Asian 16 100.0% Not responsible for grandchildren
Grandparents (60 years and over)