Races in Kailua, Hawaii (HI) Detailed Stats
Data:
Races - White alone (%)
Races - White alone (% change since 2000)
Races - Black alone (%)
Races - Black alone (% change since 2000)
Races - American Indian alone (%)
Races - American Indian alone (% change since 2000)
Races - Asian alone (%)
Races - Asian alone (% change since 2000)
Races - Hispanic (%)
Races - Hispanic (% change since 2000)
Races - Native Hawaiian and Other Pacific Islander alone (%)
Races - Native Hawaiian and Other Pacific Islander alone (% change since 2000)
Races - Two or more races(%)
Races - Two or more races(% change since 2000)
Races - Other race alone (%)
Races - Other race alone (% change since 2000)
Racial diversity
Place of birth - Born in state of residence (%)
Place of birth - Born in state of residence (%) - White
Place of birth - Born in state of residence (%) - Black or African American
Place of birth - Born in state of residence (%) - Asian
Place of birth - Born in state of residence (%) - Hispanic or Latino
Place of birth - Born in state of residence (%) - American Indian and Alaska Native
Place of birth - Born in state of residence (%) - Multirace
Place of birth - Born in state of residence (%) - Other Race
Place of birth - Born in other state (%)
Place of birth - Born in other state (%) - White
Place of birth - Born in other state (%) - Black or African American
Place of birth - Born in other state (%) - Asian
Place of birth - Born in other state (%) - Hispanic or Latino
Place of birth - Born in other state (%) - American Indian and Alaska Native
Place of birth - Born in other state (%) - Multirace
Place of birth - Born in other state (%) - Other Race
Place of birth - Native, outside of US (%)
Place of birth - Native, outside of US (%) - White
Place of birth - Native, outside of US (%) - Black or African American
Place of birth - Native, outside of US (%) - Asian
Place of birth - Native, outside of US (%) - Hispanic or Latino
Place of birth - Native, outside of US (%) - American Indian and Alaska Native
Place of birth - Native, outside of US (%) - Multirace
Place of birth - Native, outside of US (%) - Other Race
Place of birth - Foreign born (%)
Place of birth - Foreign born (%) - White
Place of birth - Foreign born (%) - Black or African American
Place of birth - Foreign born (%) - Asian
Place of birth - Foreign born (%) - Hispanic or Latino
Place of birth - Foreign born (%) - American Indian and Alaska Native
Place of birth - Foreign born (%) - Multirace
Place of birth - Foreign born (%) - Other Race
Residents speaking English at home (%)
Residents speaking English at home - Born in the United States (%)
Residents speaking English at home - Native, born elsewhere (%)
Residents speaking English at home - Foreign born (%)
Residents speaking Spanish at home (%)
Residents speaking Spanish at home - Born in the United States (%)
Residents speaking Spanish at home - Native, born elsewhere (%)
Residents speaking Spanish at home - Foreign born (%)
Residents speaking other language at home (%)
Residents speaking other language at home - Born in the United States (%)
Residents speaking other language at home - Native, born elsewhere (%)
Residents speaking other language at home - Foreign born (%)
Marital status - Never married (%)
Marital status - Now married (%)
Marital status - Separated (%)
Marital status - Widowed (%)
Marital status - Divorced (%)
Ancestries Reported - Arab (%)
Ancestries Reported - Czech (%)
Ancestries Reported - Danish (%)
Ancestries Reported - Dutch (%)
Ancestries Reported - English (%)
Ancestries Reported - French (%)
Ancestries Reported - French Canadian (%)
Ancestries Reported - German (%)
Ancestries Reported - Greek (%)
Ancestries Reported - Hungarian (%)
Ancestries Reported - Irish (%)
Ancestries Reported - Italian (%)
Ancestries Reported - Lithuanian (%)
Ancestries Reported - Norwegian (%)
Ancestries Reported - Polish (%)
Ancestries Reported - Portuguese (%)
Ancestries Reported - Russian (%)
Ancestries Reported - Scotch-Irish (%)
Ancestries Reported - Scottish (%)
Ancestries Reported - Slovak (%)
Ancestries Reported - Subsaharan African (%)
Ancestries Reported - Swedish (%)
Ancestries Reported - Swiss (%)
Ancestries Reported - Ukrainian (%)
Ancestries Reported - United States (%)
Ancestries Reported - Welsh (%)
Ancestries Reported - West Indian (%)
Ancestries Reported - Other (%)
Geographical mobility - Same house 1 year ago (%)
Geographical mobility - Same house 1 year ago (%) - White
Geographical mobility - Same house 1 year ago (%) - Black or African American
Geographical mobility - Same house 1 year ago (%) - Asian
Geographical mobility - Same house 1 year ago (%) - Hispanic or Latino
Geographical mobility - Same house 1 year ago (%) - American Indian and Alaska Native
Geographical mobility - Same house 1 year ago (%) - Multirace
Geographical mobility - Same house 1 year ago (%) - Other Race
Geographical mobility - Moved within same county (%)
Geographical mobility - Moved within same county (%) - White
Geographical mobility - Moved within same county (%) - Black or African American
Geographical mobility - Moved within same county (%) - Asian
Geographical mobility - Moved within same county (%) - Hispanic or Latino
Geographical mobility - Moved within same county (%) - American Indian and Alaska Native
Geographical mobility - Moved within same county (%) - Multirace
Geographical mobility - Moved within same county (%) - Other Race
Geographical mobility - Moved from different county within same state (%)
Geographical mobility - Moved from different county within same state (%) - White
Geographical mobility - Moved from different county within same state (%) - Black or African American
Geographical mobility - Moved from different county within same state (%) - Asian
Geographical mobility - Moved from different county within same state (%) - Hispanic or Latino
Geographical mobility - Moved from different county within same state (%) - American Indian and Alaska Native
Geographical mobility - Moved from different county within same state (%) - Multirace
Geographical mobility - Moved from different county within same state (%) - Other Race
Geographical mobility - Moved from different state (%)
Geographical mobility - Moved from different state (%) - White
Geographical mobility - Moved from different state (%) - Black or African American
Geographical mobility - Moved from different state (%) - Asian
Geographical mobility - Moved from different state (%) - Hispanic or Latino
Geographical mobility - Moved from different state (%) - American Indian and Alaska Native
Geographical mobility - Moved from different state (%) - Multirace
Geographical mobility - Moved from different state (%) - Other Race
Geographical mobility - Moved from abroad (%)
Geographical mobility - Moved from abroad (%) - White
Geographical mobility - Moved from abroad (%) - Black or African American
Geographical mobility - Moved from abroad (%) - Asian
Geographical mobility - Moved from abroad (%) - Hispanic or Latino
Geographical mobility - Moved from abroad (%) - American Indian and Alaska Native
Geographical mobility - Moved from abroad (%) - Multirace
Geographical mobility - Moved from abroad (%) - Other Race
Place of birth for the foreign-born population - Ireland (%)
Place of birth for the foreign-born population - Denmark (%)
Place of birth for the foreign-born population - Norway (%)
Place of birth for the foreign-born population - Sweden (%)
Place of birth for the foreign-born population - United Kingdom (%)
Place of birth for the foreign-born population - England (%)
Place of birth for the foreign-born population - Scotland (%)
Place of birth for the foreign-born population - Other Northern Europe (%)
Place of birth for the foreign-born population - Austria (%)
Place of birth for the foreign-born population - Belgium (%)
Place of birth for the foreign-born population - France (%)
Place of birth for the foreign-born population - Germany (%)
Place of birth for the foreign-born population - Netherlands (%)
Place of birth for the foreign-born population - Switzerland (%)
Place of birth for the foreign-born population - Other Western Europe (%)
Place of birth for the foreign-born population - Greece (%)
Place of birth for the foreign-born population - Italy (%)
Place of birth for the foreign-born population - Portugal (%)
Place of birth for the foreign-born population - Spain (%)
Place of birth for the foreign-born population - Other Southern Europe (%)
Place of birth for the foreign-born population - Albania (%)
Place of birth for the foreign-born population - Belarus (%)
Place of birth for the foreign-born population - Bosnia and Herzegovina (%)
Place of birth for the foreign-born population - Bulgaria (%)
Place of birth for the foreign-born population - Croatia (%)
Place of birth for the foreign-born population - Czechoslovakia (%)
Place of birth for the foreign-born population - Hungary (%)
Place of birth for the foreign-born population - Latvia (%)
Place of birth for the foreign-born population - Lithuania (%)
Place of birth for the foreign-born population - North Macedonia (Macedonia) (%)
Place of birth for the foreign-born population - Moldova (%)
Place of birth for the foreign-born population - Poland (%)
Place of birth for the foreign-born population - Romania (%)
Place of birth for the foreign-born population - Russia (%)
Place of birth for the foreign-born population - Serbia (%)
Place of birth for the foreign-born population - Ukraine (%)
Place of birth for the foreign-born population - Other Eastern Europe (%)
Place of birth for the foreign-born population - China (%)
Place of birth for the foreign-born population - Hong Kong (%)
Place of birth for the foreign-born population - Taiwan (%)
Place of birth for the foreign-born population - Japan (%)
Place of birth for the foreign-born population - Korea (%)
Place of birth for the foreign-born population - Other Eastern Asia (%)
Place of birth for the foreign-born population - Afghanistan (%)
Place of birth for the foreign-born population - Bangladesh (%)
Place of birth for the foreign-born population - India (%)
Place of birth for the foreign-born population - Iran (%)
Place of birth for the foreign-born population - Kazakhstan (%)
Place of birth for the foreign-born population - Nepal (%)
Place of birth for the foreign-born population - Pakistan (%)
Place of birth for the foreign-born population - Sri Lanka (%)
Place of birth for the foreign-born population - Uzbekistan (%)
Place of birth for the foreign-born population - Other South Central Asia (%)
Place of birth for the foreign-born population - Burma (%)
Place of birth for the foreign-born population - Cambodia (%)
Place of birth for the foreign-born population - Indonesia (%)
Place of birth for the foreign-born population - Laos (%)
Place of birth for the foreign-born population - Malaysia (%)
Place of birth for the foreign-born population - Philippines (%)
Place of birth for the foreign-born population - Singapore (%)
Place of birth for the foreign-born population - Thailand (%)
Place of birth for the foreign-born population - Vietnam (%)
Place of birth for the foreign-born population - Other South Eastern Asia (%)
Place of birth for the foreign-born population - Armenia (%)
Place of birth for the foreign-born population - Iraq (%)
Place of birth for the foreign-born population - Israel (%)
Place of birth for the foreign-born population - Jordan (%)
Place of birth for the foreign-born population - Kuwait (%)
Place of birth for the foreign-born population - Lebanon (%)
Place of birth for the foreign-born population - Saudi Arabia (%)
Place of birth for the foreign-born population - Syria (%)
Place of birth for the foreign-born population - Turkey (%)
Place of birth for the foreign-born population - Yemen (%)
Place of birth for the foreign-born population - Other Western Asia (%)
Place of birth for the foreign-born population - Eritrea (%)
Place of birth for the foreign-born population - Ethiopia (%)
Place of birth for the foreign-born population - Kenya (%)
Place of birth for the foreign-born population - Somalia (%)
Place of birth for the foreign-born population - Uganda (%)
Place of birth for the foreign-born population - Zimbabwe (%)
Place of birth for the foreign-born population - Other Eastern Africa (%)
Place of birth for the foreign-born population - Cameroon (%)
Place of birth for the foreign-born population - Congo (%)
Place of birth for the foreign-born population - Democratic Republic of Congo (Zaire) (%)
Place of birth for the foreign-born population - Other Middle Africa (%)
Place of birth for the foreign-born population - Egypt (%)
Place of birth for the foreign-born population - Morocco (%)
Place of birth for the foreign-born population - Sudan (%)
Place of birth for the foreign-born population - Other Northern Africa (%)
Place of birth for the foreign-born population - South Africa (%)
Place of birth for the foreign-born population - Other Southern Africa (%)
Place of birth for the foreign-born population - Cabo Verde (%)
Place of birth for the foreign-born population - Ghana (%)
Place of birth for the foreign-born population - Liberia (%)
Place of birth for the foreign-born population - Nigeria (%)
Place of birth for the foreign-born population - Senegal (%)
Place of birth for the foreign-born population - Sierra Leone (%)
Place of birth for the foreign-born population - Other Western Africa (%)
Place of birth for the foreign-born population - Australia (%)
Place of birth for the foreign-born population - New Zealand (%)
Place of birth for the foreign-born population - Fiji (%)
Place of birth for the foreign-born population - Micronesia (%)
Place of birth for the foreign-born population - Bahamas (%)
Place of birth for the foreign-born population - Barbados (%)
Place of birth for the foreign-born population - Cuba (%)
Place of birth for the foreign-born population - Dominica (%)
Place of birth for the foreign-born population - Dominican Republic (%)
Place of birth for the foreign-born population - Grenada (%)
Place of birth for the foreign-born population - Haiti (%)
Place of birth for the foreign-born population - Jamaica (%)
Place of birth for the foreign-born population - St. Vincent and the Grenadines (%)
Place of birth for the foreign-born population - Trinidad and Tobago (%)
Place of birth for the foreign-born population - West Indies (%)
Place of birth for the foreign-born population - Other Caribbean (%)
Place of birth for the foreign-born population - Belize (%)
Place of birth for the foreign-born population - Costa Rica (%)
Place of birth for the foreign-born population - El Salvador (%)
Place of birth for the foreign-born population - Guatemala (%)
Place of birth for the foreign-born population - Honduras (%)
Place of birth for the foreign-born population - Mexico (%)
Place of birth for the foreign-born population - Nicaragua (%)
Place of birth for the foreign-born population - Panama (%)
Place of birth for the foreign-born population - Other Central America (%)
Place of birth for the foreign-born population - Argentina (%)
Place of birth for the foreign-born population - Bolivia (%)
Place of birth for the foreign-born population - Brazil (%)
Place of birth for the foreign-born population - Chile (%)
Place of birth for the foreign-born population - Colombia (%)
Place of birth for the foreign-born population - Ecuador (%)
Place of birth for the foreign-born population - Guyana (%)
Place of birth for the foreign-born population - Peru (%)
Place of birth for the foreign-born population - Uruguay (%)
Place of birth for the foreign-born population - Venezuela (%)
Place of birth for the foreign-born population - Other South America (%)
Place of birth for the foreign-born population - Canada (%)
Place of birth for the foreign-born population - Other Northern America (%)
Place of birth for the foreign-born population - Other (%)
Latest news about races in Kailua, HI collected exclusively by city-data.com from local newspapers, TV, and radio stations
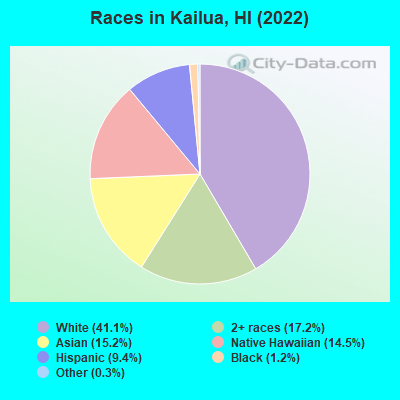
According to 2022 data, the most numerous races in Kailua, HI are Asian alone (3,336 residents), Two or more races (3,757 residents), and White alone (8,987 residents). 76.2% of Kailua residents speak English at home. 22.4% of Kailua, HI residents are foreign-born (10.8% born in Asia, 5.3% born in Oceania, 3.7% born in Latin America), which is 19.6% greater than the foreign-born rate of 18.0% across the entire state of Hawaii.
Race distribution in Kailua
2000 2022
3,596 36.4% White alone 2,242 22.7% Two or more races 1,720 17.4% Asian alone 1,219 12.4% Native Hawaiian and Other 1,007 10.2% Hispanic 45 0.5% Black alone 37 0.4% American Indian alone 4 0.04% Other race alone
8,987 41.1% White alone 3,757 17.2% Two or more races 3,336 15.2% Asian alone 3,179 14.5% Native Hawaiian and Other 2,063 9.4% Hispanic 260 1.2% Black alone 75 0.3% Other race alone 20 0.09% American Indian alone
2000 2022
494,149 40.8% Asian alone 277,091 22.9% White alone 218,700 18.1% Two or more races 108,441 9.0% Native Hawaiian and Other 87,699 7.2% Hispanic 20,829 1.7% Black alone 2,089 0.2% Other race alone 2,539 0.2% American Indian alone
498,125 34.6% Asian alone 318,574 22.1% Two or more races 297,937 20.7% White alone 160,103 11.1% Hispanic 134,567 9.3% Native Hawaiian and Other 23,682 1.6% Black alone 5,378 0.4% Other race alone 1,830 0.1% American Indian alone
Income and house value in Kailua Median household income in 2022 $96,334 White non-Hispanic householders$174,668 Black householders$69,032 Asian householders$64,770 Native Hawaiian and other Pacific Islander householders$106,408 Some other race householders$86,157 Two or more races householders$105,116 Hispanic or Latino race householdersMedian 2022 house value $865,194 White Non-Hispanic householders$566,427 Black or African American householders $706,594 Asian householders$506,520 Native Hawaiian and other Pacific Islander householders$853,289 Some other race householders$688,545 Two or more races householders$886,699 Hispanic or Latino householders
Median age by race in Kailua
57.0 Median age for White residents54.1 58.4 31.1 Median age for Black or African American residents32.5 -646,651,269.6 -1,073,212,746.6 Median age for American Indian / Alaska Native residents-1,082,456,139.3 -1,051,217,463.3 49.0 Median age for Asian residents50.6 50.0 28.2 Median age for Native Hawaiian / Pacific Islander residents27.1 30.0 22.3 Median age for Other race residents16.4 29.7 27.7 Median age for Two or more races residents31.6 27.0 56.8 Median age for White alone residents55.1 59.2 23.6 Median age for Hispanic or Latino residents24.4 22.6
Owner/renter occupied households by race in Kailua
House owners and renters - White residents 3,090 76.3% Owner occupied959 23.7% Renter occupiedHouse owners and renters - Black or African American residents 34 23.8% Owner occupied110 76.2% Renter occupiedHouse owners and renters - Asian residents 842 72.1% Owner occupied326 27.9% Renter occupiedHouse owners and renters - Native Hawaiian / Pacific Islander residents 367 41.1% Owner occupied526 58.9% Renter occupiedHouse owners and renters - Other race residents 124 58.3% Owner occupied89 41.7% Renter occupiedHouse owners and renters - Two or more races residents 581 61.6% Owner occupied362 38.4% Renter occupiedHouse owners and renters - White alone residents 3,060 75.7% Owner occupied984 24.3% Renter occupiedHouse owners and renters - Hispanic or Latino residents 189 45.6% Owner occupied225 54.4% Renter occupied
Language usage in Kailua
English speakers - Total 76.2% of residents of Kailua speak English at home.
3.4% of residents speak Spanish at home 404 57.8% Speak English very well295 42.2% Speak English less than very well19.6% of residents speak other language at home 2,455 60.6% Speak English very well1,597 39.4% Speak English less than very well
English speakers - Born in the United States 93.0% of residents of Kailua speak English at home.
2.8% of residents speak Spanish at home 240 100.0% Speak English very well3.1% of residents speak other language at home 265 99.6% Speak English very well1 0.4% Speak English less than very well
English speakers - Native, born elsewhere 57.6% of residents of Kailua speak English at home.
21.4% of residents speak Spanish at home 65 100.0% Speak English very well18.1% of residents speak other language at home 55 100.0% Speak English very well
English speakers - Foreign-born 25.7% of residents of Kailua speak English at home.
8.2% of residents speak Spanish at home 35 9.5% Speak English very well334 90.5% Speak English less than very well65.2% of residents speak other language at home 1,402 47.7% Speak English very well1,539 52.3% Speak English less than very well
White (Caucasian) - Speak only English Native:
100.0% (7,750)Foreign-born:
61.1% (646)
White (Caucasian) - Speak another language Native:
1.2% (95)Foreign-born:
28.2% (299)
Asian - Speak only English Native:
88.2% (1,496)Foreign-born:
7.3% (118)
Asian - Speak another language Native:
12.2% (208)Foreign-born:
91.9% (1,482)
Native Hawaiian / Pacific Islander - Speak only English Native:
54.2% (1,111)Foreign-born:
6.6% (74)
Native Hawaiian / Pacific Islander - Speak another language Native:
41.9% (858)Foreign-born:
91.5% (1,020)
Other race - Speak only English Native:
71.2% (314)Foreign-born:
8.8% (52)
Other race - Speak another language Native:
25.8% (113)Foreign-born:
71.4% (422)
Two or more races - Speak only English Native:
94.9% (3,318)Foreign-born:
43.5% (126)
Two or more races - Speak another language Native:
8.0% (281)Foreign-born:
43.4% (126)
White alone - Speak only English Native:
98.9% (7,712)Foreign-born:
61.0% (629)
White alone - Speak another language Native:
1.5% (116)Foreign-born:
29.2% (301)
Hispanic or Latino - Speak only English Native:
88.8% (1,091)Foreign-born:
19.8% (125)
Hispanic or Latino - Speak another language Native:
13.9% (171)Foreign-born:
60.9% (386)
Foreign-born residents in Kailua 4,902 residents are foreign born (10.8% Asia , 5.3% Oceania , 3.7% Latin America ).
This city:
22.4%Hawaii:
18.0%
Marital status for residents in Kailua Marital status - White (Caucasian) population 15 years and over
Males 27.2% Never married59.0% Now married3.2% Separated3.8% Widowed6.9% DivorcedFemales 16.6% Never married58.7% Now married0.0% Separated11.5% Widowed13.1% DivorcedWomen who gave birth in the past 12 months Now married:
100.0% (156)Unmarried:
0.0% (0)
Women who did not give birth in the past 12 months Now married:
50.2% (643)Unmarried:
49.8% (638)
Marital status - Black or African American population 15 years and over
Males 80.2% Never married0.0% Now married0.0% Separated19.8% Widowed0.0% DivorcedFemales 100.0% Never married0.0% Now married0.0% Separated0.0% Widowed0.0% DivorcedMarital status - American Indian / Alaska Native population 15 years and over
Males 0.0% Never married0.0% Now married0.0% Separated0.0% Widowed100.0% DivorcedFemales 0.0% Never married100.0% Now married0.0% Separated0.0% Widowed0.0% DivorcedMarital status - Asian population 15 years and over
Males 34.0% Never married60.3% Now married0.0% Separated1.0% Widowed4.8% DivorcedFemales 26.0% Never married55.8% Now married0.0% Separated3.1% Widowed15.1% DivorcedWomen who gave birth in the past 12 months Now married:
100.0% (14)Unmarried:
0.0% (0)
Women who did not give birth in the past 12 months Now married:
56.2% (445)Unmarried:
43.8% (348)
Marital status - Native Hawaiian / Pacific Islander population 15 years and over
Males 47.9% Never married41.0% Now married0.0% Separated4.2% Widowed6.9% DivorcedFemales 35.8% Never married46.4% Now married4.5% Separated8.4% Widowed4.9% DivorcedWomen who gave birth in the past 12 months Now married:
78.1% (27)Unmarried:
21.9% (7)
Women who did not give birth in the past 12 months Now married:
43.1% (333)Unmarried:
56.9% (440)
Marital status - Other race population 15 years and over
Males 52.2% Never married33.4% Now married0.0% Separated0.0% Widowed14.4% DivorcedFemales 57.1% Never married18.3% Now married0.0% Separated0.0% Widowed24.6% DivorcedWomen who did not give birth in the past 12 months Now married:
18.3% (49)Unmarried:
81.7% (221)
Marital status - Two or more races population 15 years and over
Males 51.0% Never married41.3% Now married2.0% Separated1.0% Widowed4.7% DivorcedFemales 47.0% Never married39.1% Now married1.2% Separated1.0% Widowed11.7% DivorcedWomen who gave birth in the past 12 months Now married:
16.0% (4)Unmarried:
84.0% (23)
Women who did not give birth in the past 12 months Now married:
30.3% (253)Unmarried:
69.7% (583)
Marital status - White alone, not Hispanic / Latino population 15 years and over
Males 26.9% Never married59.4% Now married3.3% Separated3.5% Widowed7.0% DivorcedFemales 16.3% Never married58.6% Now married0.0% Separated11.7% Widowed13.4% DivorcedWomen who gave birth in the past 12 months Now married:
100.0% (167)Unmarried:
0.0% (0)
Women who did not give birth in the past 12 months Now married:
49.8% (652)Unmarried:
50.2% (657)
Marital status - Hispanic or Latino population 15 years and over
Males 56.2% Never married29.8% Now married0.0% Separated3.0% Widowed11.0% DivorcedFemales 45.2% Never married44.2% Now married0.0% Separated0.2% Widowed10.4% DivorcedWomen who did not give birth in the past 12 months Now married:
33.5% (150)Unmarried:
66.5% (298)
Ancestries in Kailua
672 6.4% English486 4.6% Irish376 3.6% German279 2.7% American221 2.1% Italian167 1.6% Scandinavian118 1.1% European84 0.8% Eastern European79 0.8% Scottish70 0.7% Norwegian69 0.7% Northern European50 0.5% Brazilian48 0.5% French44 0.4% Dutch41 0.4% Polish41 0.4% Portuguese34 0.3% Armenian34 0.3% Swedish23 0.2% Czech22 0.2% Austrian20 0.2% Iranian16 0.2% French Canadian16 0.2% Welsh15 0.1% Scotch-Irish13 0.1% Greek12 0.1% Canadian12 0.1% New Zealander11 0.1% Australian11 0.1% British10 0.10% Egyptian10 0.10% Haitian1 0.01% Russian
Geographical mobility in Kailua Same house 1 year ago 7,297 82.0% White (Caucasian)244 96.5% Black or African American9 93.1% American Indian / Alaska Native2,937 84.6% Asian3,141 93.3% Native Hawaiian / Pacific Islander548 52.1% Other race3,614 84.8% Two or more races7,313 81.7% White alone, not Hispanic / Latino1,192 65.4% Hispanic or LatinoMoved within same county 485 5.4% White / Caucasian301 8.7% Asian127 3.8% Native Hawaiian / Pacific Islander300 28.5% Other race392 9.2% Two or more races529 5.9% White alone, not Hispanic / Latino440 24.1% Hispanic or LatinoMoved within same state 68 2.0% Native Hawaiian / Pacific Islander7 0.2% Two or more racesMoved from different state 1,088 12.2% White / Caucasian204 5.9% Asian28 0.8% Native Hawaiian / Pacific Islander145 3.4% Two or more races1,063 11.9% White alone, not Hispanic / Latino75 4.1% Hispanic or LatinoMoved from abroad 20 0.2% White81 1.9% Two or more races21 0.2% White alone, not Hispanic / Latino
Children Nativity (place of birth) in Kailua
Children under 6 years - Living with two parents Both parents native 191 100.0% NativeBoth parents foreign-born 113 100.0% NativeOne native, one foreign-born parent 529 100.0% NativeChildren under 6 years - Living with one parent Native parent 294 100.0% NativeForeign-born parent 54 20.7% Native205 79.3% Foreign-bornChildren 6 to 17 years - Living with two parents Both parents native 959 100.0% NativeBoth parents foreign-born 353 64.3% Native196 35.7% Foreign-bornOne native, one foreign-born parent 130 100.0% NativeChildren 6 to 17 years - Living with one parent Native parent 740 100.0% NativeForeign-born parent 336 46.1% Native394 53.9% Foreign-born
Grandparents responsible for own grandchildren in Kailua
Grandparents (30 to 59 years) White / Caucasian 31 65.7% Responsible for grandchildren16 34.3% Not responsible for grandchildrenAsian 149 100.0% Not responsible for grandchildrenNative Hawaiian / Pacific Islander 41 65.6% Responsible for grandchildren21 34.4% Not responsible for grandchildrenOther race 80 100.0% Responsible for grandchildrenTwo or more races 4 100.0% Not responsible for grandchildrenWhite alone, not Hispanic / Latino 29 65.2% Responsible for grandchildren15 34.8% Not responsible for grandchildrenHispanic or Latino 55 100.0% Responsible for grandchildrenGrandparents (60 years and over) White / Caucasian 72 73.0% Responsible for grandchildren26 27.0% Not responsible for grandchildrenAsian 38 27.9% Responsible for grandchildren99 72.1% Not responsible for grandchildrenNative Hawaiian / Pacific Islander 86 53.1% Responsible for grandchildren76 46.9% Not responsible for grandchildrenTwo or more races 23 26.5% Responsible for grandchildren64 73.5% Not responsible for grandchildrenWhite alone, not Hispanic / Latino 36 59.0% Responsible for grandchildren25 41.0% Not responsible for grandchildrenHispanic or Latino 1 100.0% Not responsible for grandchildren