Races in Lakeville, Minnesota (MN) Detailed Stats
Data:
Races - White alone (%)
Races - White alone (% change since 2000)
Races - Black alone (%)
Races - Black alone (% change since 2000)
Races - American Indian alone (%)
Races - American Indian alone (% change since 2000)
Races - Asian alone (%)
Races - Asian alone (% change since 2000)
Races - Hispanic (%)
Races - Hispanic (% change since 2000)
Races - Native Hawaiian and Other Pacific Islander alone (%)
Races - Native Hawaiian and Other Pacific Islander alone (% change since 2000)
Races - Two or more races(%)
Races - Two or more races(% change since 2000)
Races - Other race alone (%)
Races - Other race alone (% change since 2000)
Racial diversity
Place of birth - Born in state of residence (%)
Place of birth - Born in state of residence (%) - White
Place of birth - Born in state of residence (%) - Black or African American
Place of birth - Born in state of residence (%) - Asian
Place of birth - Born in state of residence (%) - Hispanic or Latino
Place of birth - Born in state of residence (%) - American Indian and Alaska Native
Place of birth - Born in state of residence (%) - Multirace
Place of birth - Born in state of residence (%) - Other Race
Place of birth - Born in other state (%)
Place of birth - Born in other state (%) - White
Place of birth - Born in other state (%) - Black or African American
Place of birth - Born in other state (%) - Asian
Place of birth - Born in other state (%) - Hispanic or Latino
Place of birth - Born in other state (%) - American Indian and Alaska Native
Place of birth - Born in other state (%) - Multirace
Place of birth - Born in other state (%) - Other Race
Place of birth - Native, outside of US (%)
Place of birth - Native, outside of US (%) - White
Place of birth - Native, outside of US (%) - Black or African American
Place of birth - Native, outside of US (%) - Asian
Place of birth - Native, outside of US (%) - Hispanic or Latino
Place of birth - Native, outside of US (%) - American Indian and Alaska Native
Place of birth - Native, outside of US (%) - Multirace
Place of birth - Native, outside of US (%) - Other Race
Place of birth - Foreign born (%)
Place of birth - Foreign born (%) - White
Place of birth - Foreign born (%) - Black or African American
Place of birth - Foreign born (%) - Asian
Place of birth - Foreign born (%) - Hispanic or Latino
Place of birth - Foreign born (%) - American Indian and Alaska Native
Place of birth - Foreign born (%) - Multirace
Place of birth - Foreign born (%) - Other Race
Residents speaking English at home (%)
Residents speaking English at home - Born in the United States (%)
Residents speaking English at home - Native, born elsewhere (%)
Residents speaking English at home - Foreign born (%)
Residents speaking Spanish at home (%)
Residents speaking Spanish at home - Born in the United States (%)
Residents speaking Spanish at home - Native, born elsewhere (%)
Residents speaking Spanish at home - Foreign born (%)
Residents speaking other language at home (%)
Residents speaking other language at home - Born in the United States (%)
Residents speaking other language at home - Native, born elsewhere (%)
Residents speaking other language at home - Foreign born (%)
Marital status - Never married (%)
Marital status - Now married (%)
Marital status - Separated (%)
Marital status - Widowed (%)
Marital status - Divorced (%)
Ancestries Reported - Arab (%)
Ancestries Reported - Czech (%)
Ancestries Reported - Danish (%)
Ancestries Reported - Dutch (%)
Ancestries Reported - English (%)
Ancestries Reported - French (%)
Ancestries Reported - French Canadian (%)
Ancestries Reported - German (%)
Ancestries Reported - Greek (%)
Ancestries Reported - Hungarian (%)
Ancestries Reported - Irish (%)
Ancestries Reported - Italian (%)
Ancestries Reported - Lithuanian (%)
Ancestries Reported - Norwegian (%)
Ancestries Reported - Polish (%)
Ancestries Reported - Portuguese (%)
Ancestries Reported - Russian (%)
Ancestries Reported - Scotch-Irish (%)
Ancestries Reported - Scottish (%)
Ancestries Reported - Slovak (%)
Ancestries Reported - Subsaharan African (%)
Ancestries Reported - Swedish (%)
Ancestries Reported - Swiss (%)
Ancestries Reported - Ukrainian (%)
Ancestries Reported - United States (%)
Ancestries Reported - Welsh (%)
Ancestries Reported - West Indian (%)
Ancestries Reported - Other (%)
Geographical mobility - Same house 1 year ago (%)
Geographical mobility - Same house 1 year ago (%) - White
Geographical mobility - Same house 1 year ago (%) - Black or African American
Geographical mobility - Same house 1 year ago (%) - Asian
Geographical mobility - Same house 1 year ago (%) - Hispanic or Latino
Geographical mobility - Same house 1 year ago (%) - American Indian and Alaska Native
Geographical mobility - Same house 1 year ago (%) - Multirace
Geographical mobility - Same house 1 year ago (%) - Other Race
Geographical mobility - Moved within same county (%)
Geographical mobility - Moved within same county (%) - White
Geographical mobility - Moved within same county (%) - Black or African American
Geographical mobility - Moved within same county (%) - Asian
Geographical mobility - Moved within same county (%) - Hispanic or Latino
Geographical mobility - Moved within same county (%) - American Indian and Alaska Native
Geographical mobility - Moved within same county (%) - Multirace
Geographical mobility - Moved within same county (%) - Other Race
Geographical mobility - Moved from different county within same state (%)
Geographical mobility - Moved from different county within same state (%) - White
Geographical mobility - Moved from different county within same state (%) - Black or African American
Geographical mobility - Moved from different county within same state (%) - Asian
Geographical mobility - Moved from different county within same state (%) - Hispanic or Latino
Geographical mobility - Moved from different county within same state (%) - American Indian and Alaska Native
Geographical mobility - Moved from different county within same state (%) - Multirace
Geographical mobility - Moved from different county within same state (%) - Other Race
Geographical mobility - Moved from different state (%)
Geographical mobility - Moved from different state (%) - White
Geographical mobility - Moved from different state (%) - Black or African American
Geographical mobility - Moved from different state (%) - Asian
Geographical mobility - Moved from different state (%) - Hispanic or Latino
Geographical mobility - Moved from different state (%) - American Indian and Alaska Native
Geographical mobility - Moved from different state (%) - Multirace
Geographical mobility - Moved from different state (%) - Other Race
Geographical mobility - Moved from abroad (%)
Geographical mobility - Moved from abroad (%) - White
Geographical mobility - Moved from abroad (%) - Black or African American
Geographical mobility - Moved from abroad (%) - Asian
Geographical mobility - Moved from abroad (%) - Hispanic or Latino
Geographical mobility - Moved from abroad (%) - American Indian and Alaska Native
Geographical mobility - Moved from abroad (%) - Multirace
Geographical mobility - Moved from abroad (%) - Other Race
Place of birth for the foreign-born population - Ireland (%)
Place of birth for the foreign-born population - Denmark (%)
Place of birth for the foreign-born population - Norway (%)
Place of birth for the foreign-born population - Sweden (%)
Place of birth for the foreign-born population - United Kingdom (%)
Place of birth for the foreign-born population - England (%)
Place of birth for the foreign-born population - Scotland (%)
Place of birth for the foreign-born population - Other Northern Europe (%)
Place of birth for the foreign-born population - Austria (%)
Place of birth for the foreign-born population - Belgium (%)
Place of birth for the foreign-born population - France (%)
Place of birth for the foreign-born population - Germany (%)
Place of birth for the foreign-born population - Netherlands (%)
Place of birth for the foreign-born population - Switzerland (%)
Place of birth for the foreign-born population - Other Western Europe (%)
Place of birth for the foreign-born population - Greece (%)
Place of birth for the foreign-born population - Italy (%)
Place of birth for the foreign-born population - Portugal (%)
Place of birth for the foreign-born population - Spain (%)
Place of birth for the foreign-born population - Other Southern Europe (%)
Place of birth for the foreign-born population - Albania (%)
Place of birth for the foreign-born population - Belarus (%)
Place of birth for the foreign-born population - Bosnia and Herzegovina (%)
Place of birth for the foreign-born population - Bulgaria (%)
Place of birth for the foreign-born population - Croatia (%)
Place of birth for the foreign-born population - Czechoslovakia (%)
Place of birth for the foreign-born population - Hungary (%)
Place of birth for the foreign-born population - Latvia (%)
Place of birth for the foreign-born population - Lithuania (%)
Place of birth for the foreign-born population - North Macedonia (Macedonia) (%)
Place of birth for the foreign-born population - Moldova (%)
Place of birth for the foreign-born population - Poland (%)
Place of birth for the foreign-born population - Romania (%)
Place of birth for the foreign-born population - Russia (%)
Place of birth for the foreign-born population - Serbia (%)
Place of birth for the foreign-born population - Ukraine (%)
Place of birth for the foreign-born population - Other Eastern Europe (%)
Place of birth for the foreign-born population - China (%)
Place of birth for the foreign-born population - Hong Kong (%)
Place of birth for the foreign-born population - Taiwan (%)
Place of birth for the foreign-born population - Japan (%)
Place of birth for the foreign-born population - Korea (%)
Place of birth for the foreign-born population - Other Eastern Asia (%)
Place of birth for the foreign-born population - Afghanistan (%)
Place of birth for the foreign-born population - Bangladesh (%)
Place of birth for the foreign-born population - India (%)
Place of birth for the foreign-born population - Iran (%)
Place of birth for the foreign-born population - Kazakhstan (%)
Place of birth for the foreign-born population - Nepal (%)
Place of birth for the foreign-born population - Pakistan (%)
Place of birth for the foreign-born population - Sri Lanka (%)
Place of birth for the foreign-born population - Uzbekistan (%)
Place of birth for the foreign-born population - Other South Central Asia (%)
Place of birth for the foreign-born population - Burma (%)
Place of birth for the foreign-born population - Cambodia (%)
Place of birth for the foreign-born population - Indonesia (%)
Place of birth for the foreign-born population - Laos (%)
Place of birth for the foreign-born population - Malaysia (%)
Place of birth for the foreign-born population - Philippines (%)
Place of birth for the foreign-born population - Singapore (%)
Place of birth for the foreign-born population - Thailand (%)
Place of birth for the foreign-born population - Vietnam (%)
Place of birth for the foreign-born population - Other South Eastern Asia (%)
Place of birth for the foreign-born population - Armenia (%)
Place of birth for the foreign-born population - Iraq (%)
Place of birth for the foreign-born population - Israel (%)
Place of birth for the foreign-born population - Jordan (%)
Place of birth for the foreign-born population - Kuwait (%)
Place of birth for the foreign-born population - Lebanon (%)
Place of birth for the foreign-born population - Saudi Arabia (%)
Place of birth for the foreign-born population - Syria (%)
Place of birth for the foreign-born population - Turkey (%)
Place of birth for the foreign-born population - Yemen (%)
Place of birth for the foreign-born population - Other Western Asia (%)
Place of birth for the foreign-born population - Eritrea (%)
Place of birth for the foreign-born population - Ethiopia (%)
Place of birth for the foreign-born population - Kenya (%)
Place of birth for the foreign-born population - Somalia (%)
Place of birth for the foreign-born population - Uganda (%)
Place of birth for the foreign-born population - Zimbabwe (%)
Place of birth for the foreign-born population - Other Eastern Africa (%)
Place of birth for the foreign-born population - Cameroon (%)
Place of birth for the foreign-born population - Congo (%)
Place of birth for the foreign-born population - Democratic Republic of Congo (Zaire) (%)
Place of birth for the foreign-born population - Other Middle Africa (%)
Place of birth for the foreign-born population - Egypt (%)
Place of birth for the foreign-born population - Morocco (%)
Place of birth for the foreign-born population - Sudan (%)
Place of birth for the foreign-born population - Other Northern Africa (%)
Place of birth for the foreign-born population - South Africa (%)
Place of birth for the foreign-born population - Other Southern Africa (%)
Place of birth for the foreign-born population - Cabo Verde (%)
Place of birth for the foreign-born population - Ghana (%)
Place of birth for the foreign-born population - Liberia (%)
Place of birth for the foreign-born population - Nigeria (%)
Place of birth for the foreign-born population - Senegal (%)
Place of birth for the foreign-born population - Sierra Leone (%)
Place of birth for the foreign-born population - Other Western Africa (%)
Place of birth for the foreign-born population - Australia (%)
Place of birth for the foreign-born population - New Zealand (%)
Place of birth for the foreign-born population - Fiji (%)
Place of birth for the foreign-born population - Micronesia (%)
Place of birth for the foreign-born population - Bahamas (%)
Place of birth for the foreign-born population - Barbados (%)
Place of birth for the foreign-born population - Cuba (%)
Place of birth for the foreign-born population - Dominica (%)
Place of birth for the foreign-born population - Dominican Republic (%)
Place of birth for the foreign-born population - Grenada (%)
Place of birth for the foreign-born population - Haiti (%)
Place of birth for the foreign-born population - Jamaica (%)
Place of birth for the foreign-born population - St. Vincent and the Grenadines (%)
Place of birth for the foreign-born population - Trinidad and Tobago (%)
Place of birth for the foreign-born population - West Indies (%)
Place of birth for the foreign-born population - Other Caribbean (%)
Place of birth for the foreign-born population - Belize (%)
Place of birth for the foreign-born population - Costa Rica (%)
Place of birth for the foreign-born population - El Salvador (%)
Place of birth for the foreign-born population - Guatemala (%)
Place of birth for the foreign-born population - Honduras (%)
Place of birth for the foreign-born population - Mexico (%)
Place of birth for the foreign-born population - Nicaragua (%)
Place of birth for the foreign-born population - Panama (%)
Place of birth for the foreign-born population - Other Central America (%)
Place of birth for the foreign-born population - Argentina (%)
Place of birth for the foreign-born population - Bolivia (%)
Place of birth for the foreign-born population - Brazil (%)
Place of birth for the foreign-born population - Chile (%)
Place of birth for the foreign-born population - Colombia (%)
Place of birth for the foreign-born population - Ecuador (%)
Place of birth for the foreign-born population - Guyana (%)
Place of birth for the foreign-born population - Peru (%)
Place of birth for the foreign-born population - Uruguay (%)
Place of birth for the foreign-born population - Venezuela (%)
Place of birth for the foreign-born population - Other South America (%)
Place of birth for the foreign-born population - Canada (%)
Place of birth for the foreign-born population - Other Northern America (%)
Place of birth for the foreign-born population - Other (%)
Latest news about races in Lakeville, MN collected exclusively by city-data.com from local newspapers, TV, and radio stations
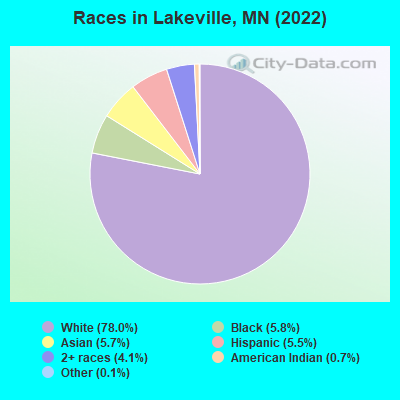
According to 2022 data, the most numerous races in Lakeville, MN are White alone (58,158 residents), Black alone (4,325 residents), and Hispanic (4,125 residents). 88.4% of Lakeville residents speak English at home. 8.7% of Lakeville, MN residents are foreign-born (3.4% born in Asia, 1.9% born in Africa, 1.8% born in Latin America), which is 8.5% greater than the foreign-born rate of 8.0% across the entire state of Minnesota.
Race distribution in Lakeville
2000 2022
4,337,143 88.2% White alone 168,813 3.4% Black alone 143,382 2.9% Hispanic 141,083 2.9% Asian alone 70,304 1.4% Two or more races 52,009 1.1% American Indian alone 5,031 0.1% Other race alone 1,714 0.03% Native Hawaiian and Other
4,356,347 76.2% White alone 395,179 6.9% Black alone 333,830 5.8% Hispanic 294,800 5.2% Asian alone 259,649 4.5% Two or more races 42,125 0.7% American Indian alone 32,976 0.6% Other race alone 2,278 0.04% Native Hawaiian and Other
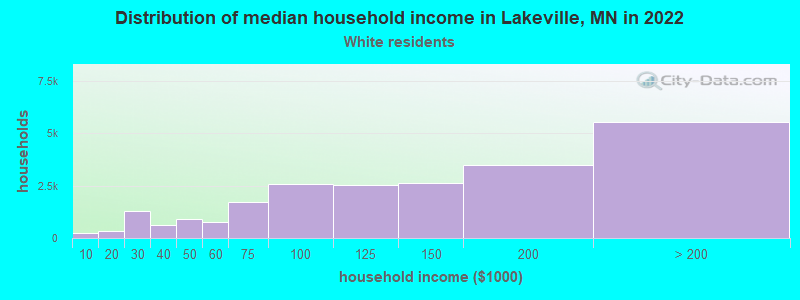
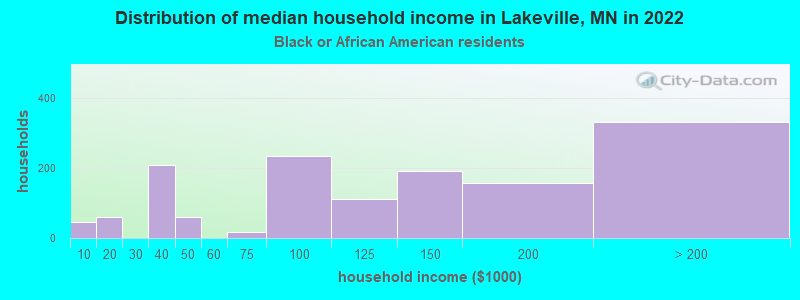
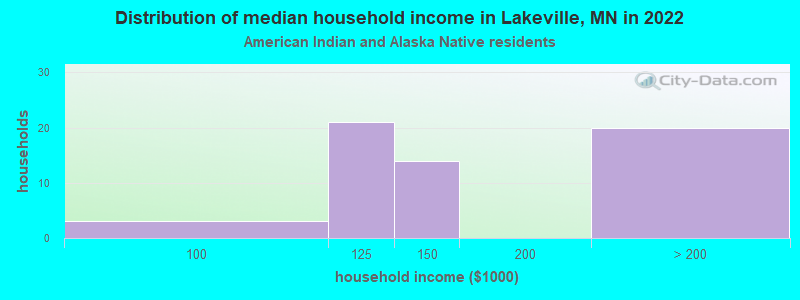
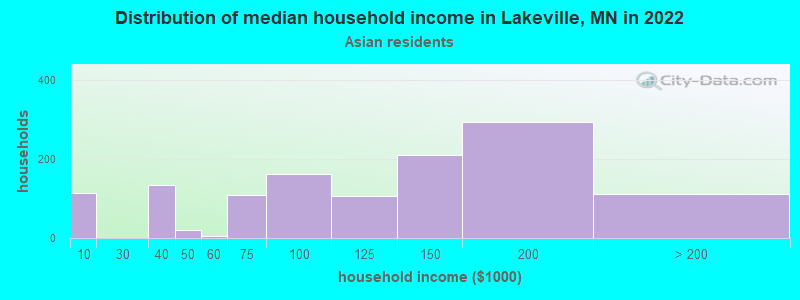
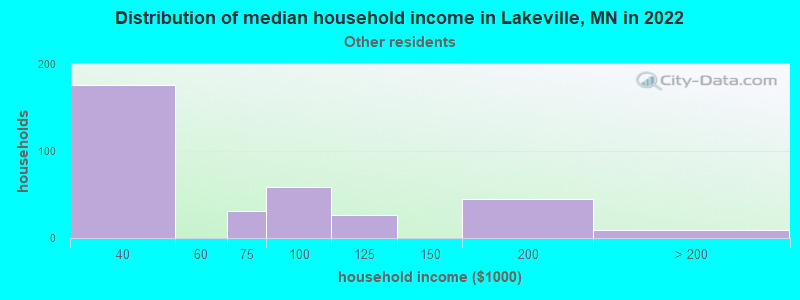
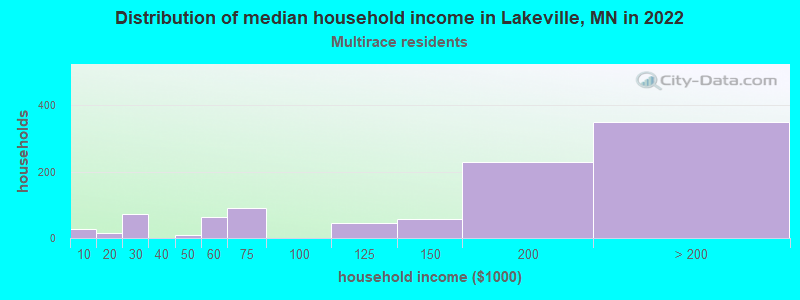
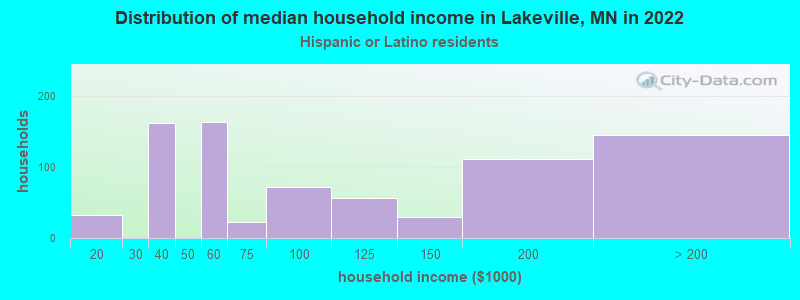
Income and house value in Lakeville Median household income in 2022 $130,701 White non-Hispanic householders$39,952 Black householders$127,753 Asian householders$166,539 Two or more races householders$155,077 Hispanic or Latino race householdersMedian 2022 house value $462,012 White Non-Hispanic householders$453,651 Black or African American householders$317,987 American Indian or Alaska Native householders $387,842 Asian householders$385,685 Some other race householders$420,207 Two or more races householders$379,751 Hispanic or Latino householders
Median age by race in Lakeville
40.0 Median age for White residents38.3 42.0 23.5 Median age for Black or African American residents38.0 19.0 34.6 Median age for American Indian / Alaska Native residents34.3 -666,666,666.0 36.7 Median age for Asian residents36.4 38.0 -666,666,666.0 Median age for Native Hawaiian / Pacific Islander residents-666,666,666.0 -666,666,666.0 30.0 Median age for Other race residents9.9 39.3 15.4 Median age for Two or more races residents15.6 14.9 40.2 Median age for White alone residents38.6 42.1 14.7 Median age for Hispanic or Latino residents12.3 33.3
Owner/renter occupied households by race in Lakeville
House owners and renters - White residents 19,717 87.0% Owner occupied2,958 13.0% Renter occupiedHouse owners and renters - Black or African American residents 500 33.0% Owner occupied1,013 67.0% Renter occupiedHouse owners and renters - American Indian / Alaska Native residents 47 87.4% Owner occupied7 12.6% Renter occupiedHouse owners and renters - Asian residents 829 61.6% Owner occupied516 38.4% Renter occupiedHouse owners and renters - Other race residents 187 57.7% Owner occupied137 42.3% Renter occupiedHouse owners and renters - Two or more races residents 876 89.0% Owner occupied108 11.0% Renter occupiedHouse owners and renters - White alone residents 19,594 86.9% Owner occupied2,958 13.1% Renter occupiedHouse owners and renters - Hispanic or Latino residents 459 56.2% Owner occupied358 43.8% Renter occupied
Language usage in Lakeville
English speakers - Total 88.4% of residents of Lakeville speak English at home.
3.6% of residents speak Spanish at home 883 36.5% Speak English very well1,536 63.5% Speak English less than very well8.1% of residents speak other language at home 4,079 76.2% Speak English very well1,276 23.8% Speak English less than very well
English speakers - Born in the United States 94.3% of residents of Lakeville speak English at home.
1.4% of residents speak Spanish at home 115 43.9% Speak English very well147 56.1% Speak English less than very well5.6% of residents speak other language at home 1,009 97.9% Speak English very well22 2.1% Speak English less than very well
English speakers - Native, born elsewhere 49.4% of residents of Lakeville speak English at home.
36.0% of residents speak Spanish at home 144 53.1% Speak English very well127 46.9% Speak English less than very well28.0% of residents speak other language at home 211 100.0% Speak English very well
English speakers - Foreign-born 29.2% of residents of Lakeville speak English at home.
20.1% of residents speak Spanish at home 189 14.8% Speak English very well1,086 85.2% Speak English less than very well50.2% of residents speak other language at home 2,005 63.0% Speak English very well1,178 37.0% Speak English less than very well
White (Caucasian) - Speak only English Native:
98.9% (53,782)Foreign-born:
84.5% (902)
White (Caucasian) - Speak another language Native:
1.1% (618)Foreign-born:
15.5% (165)
Black or African American - Speak only English Native:
64.7% (1,600)Foreign-born:
11.3% (169)
Black or African American - Speak another language Native:
35.3% (872)Foreign-born:
88.7% (1,325)
American Indian / Alaska Native - Speak only English Native:
98.7% (190)Foreign-born:
50.2% (49)
American Indian / Alaska Native - Speak another language Native:
1.6% (3)Foreign-born:
23.5% (23)
Asian - Speak only English Native:
39.4% (551)Foreign-born:
20.1% (495)
Asian - Speak another language Native:
60.6% (848)Foreign-born:
79.9% (1,966)
Other race - Speak only English Native:
33.9% (345)Foreign-born:
19.6% (134)
Other race - Speak another language Native:
66.1% (673)Foreign-born:
81.8% (558)
Two or more races - Speak only English Native:
88.3% (2,894)Foreign-born:
14.2% (98)
Two or more races - Speak another language Native:
10.8% (353)Foreign-born:
82.2% (569)
White alone - Speak only English Native:
99.3% (53,458)Foreign-born:
88.9% (902)
White alone - Speak another language Native:
0.7% (386)Foreign-born:
11.1% (113)
Hispanic or Latino - Speak only English Native:
32.6% (862)Foreign-born:
9.1% (104)
Hispanic or Latino - Speak another language Native:
67.4% (1,781)Foreign-born:
90.9% (1,035)
Foreign-born residents in Lakeville 6,241 residents are foreign born (3.4% Asia , 1.9% Africa , 1.8% Latin America ).
This city:
8.7%Minnesota:
8.5%
Marital status for residents in Lakeville Marital status - White (Caucasian) population 15 years and over
Males 22.3% Never married70.0% Now married0.2% Separated2.3% Widowed5.1% DivorcedFemales 22.3% Never married58.6% Now married1.1% Separated7.3% Widowed10.7% DivorcedWomen who gave birth in the past 12 months Now married:
78.9% (742)Unmarried:
21.1% (198)
Women who did not give birth in the past 12 months Now married:
57.2% (6,996)Unmarried:
42.8% (5,238)
Marital status - Black or African American population 15 years and over
Males 27.9% Never married68.3% Now married0.1% Separated0.4% Widowed3.3% DivorcedFemales 20.6% Never married61.2% Now married0.0% Separated4.2% Widowed14.0% DivorcedWomen who gave birth in the past 12 months Now married:
100.0% (21)Unmarried:
0.0% (0)
Women who did not give birth in the past 12 months Now married:
67.3% (513)Unmarried:
32.7% (249)
Marital status - American Indian / Alaska Native population 15 years and over
Males 74.3% Never married14.3% Now married0.0% Separated8.6% Widowed2.9% DivorcedFemales 67.8% Never married22.0% Now married0.0% Separated0.0% Widowed10.2% DivorcedWomen who did not give birth in the past 12 months Now married:
0.0% (0)Unmarried:
100.0% (28)
Marital status - Asian population 15 years and over
Males 33.2% Never married57.3% Now married0.0% Separated0.0% Widowed9.5% DivorcedFemales 28.1% Never married59.7% Now married0.0% Separated4.1% Widowed8.1% DivorcedWomen who gave birth in the past 12 months Now married:
70.7% (68)Unmarried:
29.3% (28)
Women who did not give birth in the past 12 months Now married:
56.7% (636)Unmarried:
43.3% (486)
Marital status - Other race population 15 years and over
Males 31.7% Never married32.5% Now married4.0% Separated0.0% Widowed31.7% DivorcedFemales 58.1% Never married29.4% Now married0.0% Separated0.0% Widowed12.5% DivorcedWomen who gave birth in the past 12 months Now married:
100.0% (29)Unmarried:
0.0% (0)
Women who did not give birth in the past 12 months Now married:
24.0% (142)Unmarried:
76.0% (450)
Marital status - Two or more races population 15 years and over
Males 49.0% Never married48.5% Now married0.0% Separated0.0% Widowed2.5% DivorcedFemales 27.1% Never married63.7% Now married0.1% Separated2.1% Widowed6.9% DivorcedWomen who did not give birth in the past 12 months Now married:
54.9% (372)Unmarried:
45.1% (305)
Marital status - White alone, not Hispanic / Latino population 15 years and over
Males 21.9% Never married70.3% Now married0.2% Separated2.4% Widowed5.2% DivorcedFemales 22.1% Never married58.7% Now married1.1% Separated7.4% Widowed10.7% DivorcedWomen who gave birth in the past 12 months Now married:
78.9% (742)Unmarried:
21.1% (198)
Women who did not give birth in the past 12 months Now married:
57.4% (6,996)Unmarried:
42.6% (5,186)
Marital status - Hispanic or Latino population 15 years and over
Males 40.2% Never married44.2% Now married1.1% Separated0.0% Widowed14.4% DivorcedFemales 54.2% Never married38.1% Now married0.0% Separated1.4% Widowed6.3% DivorcedWomen who gave birth in the past 12 months Now married:
77.2% (46)Unmarried:
22.8% (14)
Women who did not give birth in the past 12 months Now married:
22.5% (201)Unmarried:
77.5% (692)
Ancestries in Lakeville
6,120 21.6% German2,349 8.3% Norwegian2,252 7.9% American1,718 6.1% European1,653 5.8% English1,100 3.9% Irish838 3.0% Scandinavian777 2.7% Italian560 2.0% Swedish465 1.6% Polish319 1.1% Somali305 1.1% African284 1.0% Kenyan218 0.8% Dutch187 0.7% Czech182 0.6% Czechoslovakian171 0.6% Ethiopian156 0.6% Eastern European139 0.5% Slovak132 0.5% Danish115 0.4% Finnish115 0.4% Scotch-Irish113 0.4% Northern European113 0.4% Russian105 0.4% Afghan89 0.3% French Canadian83 0.3% Ukrainian80 0.3% French77 0.3% Guyanese77 0.3% Haitian60 0.2% West Indian49 0.2% British40 0.1% Belgian34 0.1% Nigerian33 0.1% Lebanese33 0.1% Slavic33 0.1% Swiss32 0.1% Canadian32 0.1% Romanian31 0.1% Egyptian25 0.09% Austrian25 0.09% Brazilian20 0.07% Hungarian20 0.07% Sierra Leonean15 0.05% Welsh12 0.04% Lithuanian10 0.04% Palestinian10 0.04% Scottish7 0.02% Croatian7 0.02% Icelander7 0.02% Greek4 0.01% Liberian3 0.01% Ghanaian
Geographical mobility in Lakeville Same house 1 year ago 53,912 92.9% White (Caucasian)2,587 69.9% Black or African American242 91.4% American Indian / Alaska Native3,244 77.8% Asian1,934 92.3% Other race3,578 87.3% Two or more races53,082 92.7% White alone, not Hispanic / Latino3,376 85.3% Hispanic or LatinoMoved within same county 3,000 5.2% White / Caucasian1,089 29.4% Black or African American438 10.5% Asian74 3.5% Other race307 7.5% Two or more races3,000 5.2% White alone, not Hispanic / Latino312 7.9% Hispanic or LatinoMoved within same state 825 1.4% White / Caucasian17 0.5% Black or African American29 11.1% American Indian / Alaska Native292 7.0% Asian17 0.8% Other race34 0.8% Two or more races825 1.4% White alone, not Hispanic / Latino109 2.8% Hispanic or LatinoMoved from different state 325 0.6% White / Caucasian174 4.7% Black or African American174 4.2% Asian17 0.8% Other race41 1.0% Two or more races325 0.6% White alone, not Hispanic / Latino24 0.6% Hispanic or LatinoMoved from abroad 9 0.2% Black or African American33 0.8% Two or more races
Children Nativity (place of birth) in Lakeville
Children under 6 years - Living with two parents Both parents native 4,711 100.0% NativeBoth parents foreign-born 439 100.0% NativeOne native, one foreign-born parent 671 100.0% NativeChildren under 6 years - Living with one parent Native parent 382 100.0% NativeChildren 6 to 17 years - Living with two parents Both parents native 9,843 99.6% Native36 0.4% Foreign-bornBoth parents foreign-born 862 85.3% Native148 14.7% Foreign-bornOne native, one foreign-born parent 1,213 95.4% Native59 4.6% Foreign-bornChildren 6 to 17 years - Living with one parent Native parent 1,968 100.0% NativeForeign-born parent 890 50.0% Native890 50.0% Foreign-born
Grandparents responsible for own grandchildren in Lakeville
Grandparents (30 to 59 years) White / Caucasian 206 72.6% Responsible for grandchildren77 27.4% Not responsible for grandchildrenBlack or African American 12 100.0% Not responsible for grandchildrenAmerican Indian / Alaska Native 14 100.0% Responsible for grandchildrenAsian 8 100.0% Not responsible for grandchildrenWhite alone, not Hispanic / Latino 202 78.5% Responsible for grandchildren55 21.5% Not responsible for grandchildrenHispanic or Latino 13 34.1% Responsible for grandchildren26 65.9% Not responsible for grandchildrenGrandparents (60 years and over) White / Caucasian 22 4.0% Responsible for grandchildren534 96.0% Not responsible for grandchildrenAsian 4 4.3% Responsible for grandchildren91 95.7% Not responsible for grandchildrenWhite alone, not Hispanic / Latino 22 3.9% Responsible for grandchildren550 96.1% Not responsible for grandchildrenHispanic or Latino 32 100.0% Not responsible for grandchildren