Races in Lansdowne, Virginia (VA) Detailed Stats
Data:
Races - White alone (%)
Races - White alone (% change since 2000)
Races - Black alone (%)
Races - Black alone (% change since 2000)
Races - American Indian alone (%)
Races - American Indian alone (% change since 2000)
Races - Asian alone (%)
Races - Asian alone (% change since 2000)
Races - Hispanic (%)
Races - Hispanic (% change since 2000)
Races - Native Hawaiian and Other Pacific Islander alone (%)
Races - Native Hawaiian and Other Pacific Islander alone (% change since 2000)
Races - Two or more races(%)
Races - Two or more races(% change since 2000)
Races - Other race alone (%)
Races - Other race alone (% change since 2000)
Racial diversity
Place of birth - Born in state of residence (%)
Place of birth - Born in state of residence (%) - White
Place of birth - Born in state of residence (%) - Black or African American
Place of birth - Born in state of residence (%) - Asian
Place of birth - Born in state of residence (%) - Hispanic or Latino
Place of birth - Born in state of residence (%) - American Indian and Alaska Native
Place of birth - Born in state of residence (%) - Multirace
Place of birth - Born in state of residence (%) - Other Race
Place of birth - Born in other state (%)
Place of birth - Born in other state (%) - White
Place of birth - Born in other state (%) - Black or African American
Place of birth - Born in other state (%) - Asian
Place of birth - Born in other state (%) - Hispanic or Latino
Place of birth - Born in other state (%) - American Indian and Alaska Native
Place of birth - Born in other state (%) - Multirace
Place of birth - Born in other state (%) - Other Race
Place of birth - Native, outside of US (%)
Place of birth - Native, outside of US (%) - White
Place of birth - Native, outside of US (%) - Black or African American
Place of birth - Native, outside of US (%) - Asian
Place of birth - Native, outside of US (%) - Hispanic or Latino
Place of birth - Native, outside of US (%) - American Indian and Alaska Native
Place of birth - Native, outside of US (%) - Multirace
Place of birth - Native, outside of US (%) - Other Race
Place of birth - Foreign born (%)
Place of birth - Foreign born (%) - White
Place of birth - Foreign born (%) - Black or African American
Place of birth - Foreign born (%) - Asian
Place of birth - Foreign born (%) - Hispanic or Latino
Place of birth - Foreign born (%) - American Indian and Alaska Native
Place of birth - Foreign born (%) - Multirace
Place of birth - Foreign born (%) - Other Race
Residents speaking English at home (%)
Residents speaking English at home - Born in the United States (%)
Residents speaking English at home - Native, born elsewhere (%)
Residents speaking English at home - Foreign born (%)
Residents speaking Spanish at home (%)
Residents speaking Spanish at home - Born in the United States (%)
Residents speaking Spanish at home - Native, born elsewhere (%)
Residents speaking Spanish at home - Foreign born (%)
Residents speaking other language at home (%)
Residents speaking other language at home - Born in the United States (%)
Residents speaking other language at home - Native, born elsewhere (%)
Residents speaking other language at home - Foreign born (%)
Marital status - Never married (%)
Marital status - Now married (%)
Marital status - Separated (%)
Marital status - Widowed (%)
Marital status - Divorced (%)
Ancestries Reported - Arab (%)
Ancestries Reported - Czech (%)
Ancestries Reported - Danish (%)
Ancestries Reported - Dutch (%)
Ancestries Reported - English (%)
Ancestries Reported - French (%)
Ancestries Reported - French Canadian (%)
Ancestries Reported - German (%)
Ancestries Reported - Greek (%)
Ancestries Reported - Hungarian (%)
Ancestries Reported - Irish (%)
Ancestries Reported - Italian (%)
Ancestries Reported - Lithuanian (%)
Ancestries Reported - Norwegian (%)
Ancestries Reported - Polish (%)
Ancestries Reported - Portuguese (%)
Ancestries Reported - Russian (%)
Ancestries Reported - Scotch-Irish (%)
Ancestries Reported - Scottish (%)
Ancestries Reported - Slovak (%)
Ancestries Reported - Subsaharan African (%)
Ancestries Reported - Swedish (%)
Ancestries Reported - Swiss (%)
Ancestries Reported - Ukrainian (%)
Ancestries Reported - United States (%)
Ancestries Reported - Welsh (%)
Ancestries Reported - West Indian (%)
Ancestries Reported - Other (%)
Geographical mobility - Same house 1 year ago (%)
Geographical mobility - Same house 1 year ago (%) - White
Geographical mobility - Same house 1 year ago (%) - Black or African American
Geographical mobility - Same house 1 year ago (%) - Asian
Geographical mobility - Same house 1 year ago (%) - Hispanic or Latino
Geographical mobility - Same house 1 year ago (%) - American Indian and Alaska Native
Geographical mobility - Same house 1 year ago (%) - Multirace
Geographical mobility - Same house 1 year ago (%) - Other Race
Geographical mobility - Moved within same county (%)
Geographical mobility - Moved within same county (%) - White
Geographical mobility - Moved within same county (%) - Black or African American
Geographical mobility - Moved within same county (%) - Asian
Geographical mobility - Moved within same county (%) - Hispanic or Latino
Geographical mobility - Moved within same county (%) - American Indian and Alaska Native
Geographical mobility - Moved within same county (%) - Multirace
Geographical mobility - Moved within same county (%) - Other Race
Geographical mobility - Moved from different county within same state (%)
Geographical mobility - Moved from different county within same state (%) - White
Geographical mobility - Moved from different county within same state (%) - Black or African American
Geographical mobility - Moved from different county within same state (%) - Asian
Geographical mobility - Moved from different county within same state (%) - Hispanic or Latino
Geographical mobility - Moved from different county within same state (%) - American Indian and Alaska Native
Geographical mobility - Moved from different county within same state (%) - Multirace
Geographical mobility - Moved from different county within same state (%) - Other Race
Geographical mobility - Moved from different state (%)
Geographical mobility - Moved from different state (%) - White
Geographical mobility - Moved from different state (%) - Black or African American
Geographical mobility - Moved from different state (%) - Asian
Geographical mobility - Moved from different state (%) - Hispanic or Latino
Geographical mobility - Moved from different state (%) - American Indian and Alaska Native
Geographical mobility - Moved from different state (%) - Multirace
Geographical mobility - Moved from different state (%) - Other Race
Geographical mobility - Moved from abroad (%)
Geographical mobility - Moved from abroad (%) - White
Geographical mobility - Moved from abroad (%) - Black or African American
Geographical mobility - Moved from abroad (%) - Asian
Geographical mobility - Moved from abroad (%) - Hispanic or Latino
Geographical mobility - Moved from abroad (%) - American Indian and Alaska Native
Geographical mobility - Moved from abroad (%) - Multirace
Geographical mobility - Moved from abroad (%) - Other Race
Place of birth for the foreign-born population - Ireland (%)
Place of birth for the foreign-born population - Denmark (%)
Place of birth for the foreign-born population - Norway (%)
Place of birth for the foreign-born population - Sweden (%)
Place of birth for the foreign-born population - United Kingdom (%)
Place of birth for the foreign-born population - England (%)
Place of birth for the foreign-born population - Scotland (%)
Place of birth for the foreign-born population - Other Northern Europe (%)
Place of birth for the foreign-born population - Austria (%)
Place of birth for the foreign-born population - Belgium (%)
Place of birth for the foreign-born population - France (%)
Place of birth for the foreign-born population - Germany (%)
Place of birth for the foreign-born population - Netherlands (%)
Place of birth for the foreign-born population - Switzerland (%)
Place of birth for the foreign-born population - Other Western Europe (%)
Place of birth for the foreign-born population - Greece (%)
Place of birth for the foreign-born population - Italy (%)
Place of birth for the foreign-born population - Portugal (%)
Place of birth for the foreign-born population - Spain (%)
Place of birth for the foreign-born population - Other Southern Europe (%)
Place of birth for the foreign-born population - Albania (%)
Place of birth for the foreign-born population - Belarus (%)
Place of birth for the foreign-born population - Bosnia and Herzegovina (%)
Place of birth for the foreign-born population - Bulgaria (%)
Place of birth for the foreign-born population - Croatia (%)
Place of birth for the foreign-born population - Czechoslovakia (%)
Place of birth for the foreign-born population - Hungary (%)
Place of birth for the foreign-born population - Latvia (%)
Place of birth for the foreign-born population - Lithuania (%)
Place of birth for the foreign-born population - North Macedonia (Macedonia) (%)
Place of birth for the foreign-born population - Moldova (%)
Place of birth for the foreign-born population - Poland (%)
Place of birth for the foreign-born population - Romania (%)
Place of birth for the foreign-born population - Russia (%)
Place of birth for the foreign-born population - Serbia (%)
Place of birth for the foreign-born population - Ukraine (%)
Place of birth for the foreign-born population - Other Eastern Europe (%)
Place of birth for the foreign-born population - China (%)
Place of birth for the foreign-born population - Hong Kong (%)
Place of birth for the foreign-born population - Taiwan (%)
Place of birth for the foreign-born population - Japan (%)
Place of birth for the foreign-born population - Korea (%)
Place of birth for the foreign-born population - Other Eastern Asia (%)
Place of birth for the foreign-born population - Afghanistan (%)
Place of birth for the foreign-born population - Bangladesh (%)
Place of birth for the foreign-born population - India (%)
Place of birth for the foreign-born population - Iran (%)
Place of birth for the foreign-born population - Kazakhstan (%)
Place of birth for the foreign-born population - Nepal (%)
Place of birth for the foreign-born population - Pakistan (%)
Place of birth for the foreign-born population - Sri Lanka (%)
Place of birth for the foreign-born population - Uzbekistan (%)
Place of birth for the foreign-born population - Other South Central Asia (%)
Place of birth for the foreign-born population - Burma (%)
Place of birth for the foreign-born population - Cambodia (%)
Place of birth for the foreign-born population - Indonesia (%)
Place of birth for the foreign-born population - Laos (%)
Place of birth for the foreign-born population - Malaysia (%)
Place of birth for the foreign-born population - Philippines (%)
Place of birth for the foreign-born population - Singapore (%)
Place of birth for the foreign-born population - Thailand (%)
Place of birth for the foreign-born population - Vietnam (%)
Place of birth for the foreign-born population - Other South Eastern Asia (%)
Place of birth for the foreign-born population - Armenia (%)
Place of birth for the foreign-born population - Iraq (%)
Place of birth for the foreign-born population - Israel (%)
Place of birth for the foreign-born population - Jordan (%)
Place of birth for the foreign-born population - Kuwait (%)
Place of birth for the foreign-born population - Lebanon (%)
Place of birth for the foreign-born population - Saudi Arabia (%)
Place of birth for the foreign-born population - Syria (%)
Place of birth for the foreign-born population - Turkey (%)
Place of birth for the foreign-born population - Yemen (%)
Place of birth for the foreign-born population - Other Western Asia (%)
Place of birth for the foreign-born population - Eritrea (%)
Place of birth for the foreign-born population - Ethiopia (%)
Place of birth for the foreign-born population - Kenya (%)
Place of birth for the foreign-born population - Somalia (%)
Place of birth for the foreign-born population - Uganda (%)
Place of birth for the foreign-born population - Zimbabwe (%)
Place of birth for the foreign-born population - Other Eastern Africa (%)
Place of birth for the foreign-born population - Cameroon (%)
Place of birth for the foreign-born population - Congo (%)
Place of birth for the foreign-born population - Democratic Republic of Congo (Zaire) (%)
Place of birth for the foreign-born population - Other Middle Africa (%)
Place of birth for the foreign-born population - Egypt (%)
Place of birth for the foreign-born population - Morocco (%)
Place of birth for the foreign-born population - Sudan (%)
Place of birth for the foreign-born population - Other Northern Africa (%)
Place of birth for the foreign-born population - South Africa (%)
Place of birth for the foreign-born population - Other Southern Africa (%)
Place of birth for the foreign-born population - Cabo Verde (%)
Place of birth for the foreign-born population - Ghana (%)
Place of birth for the foreign-born population - Liberia (%)
Place of birth for the foreign-born population - Nigeria (%)
Place of birth for the foreign-born population - Senegal (%)
Place of birth for the foreign-born population - Sierra Leone (%)
Place of birth for the foreign-born population - Other Western Africa (%)
Place of birth for the foreign-born population - Australia (%)
Place of birth for the foreign-born population - New Zealand (%)
Place of birth for the foreign-born population - Fiji (%)
Place of birth for the foreign-born population - Micronesia (%)
Place of birth for the foreign-born population - Bahamas (%)
Place of birth for the foreign-born population - Barbados (%)
Place of birth for the foreign-born population - Cuba (%)
Place of birth for the foreign-born population - Dominica (%)
Place of birth for the foreign-born population - Dominican Republic (%)
Place of birth for the foreign-born population - Grenada (%)
Place of birth for the foreign-born population - Haiti (%)
Place of birth for the foreign-born population - Jamaica (%)
Place of birth for the foreign-born population - St. Vincent and the Grenadines (%)
Place of birth for the foreign-born population - Trinidad and Tobago (%)
Place of birth for the foreign-born population - West Indies (%)
Place of birth for the foreign-born population - Other Caribbean (%)
Place of birth for the foreign-born population - Belize (%)
Place of birth for the foreign-born population - Costa Rica (%)
Place of birth for the foreign-born population - El Salvador (%)
Place of birth for the foreign-born population - Guatemala (%)
Place of birth for the foreign-born population - Honduras (%)
Place of birth for the foreign-born population - Mexico (%)
Place of birth for the foreign-born population - Nicaragua (%)
Place of birth for the foreign-born population - Panama (%)
Place of birth for the foreign-born population - Other Central America (%)
Place of birth for the foreign-born population - Argentina (%)
Place of birth for the foreign-born population - Bolivia (%)
Place of birth for the foreign-born population - Brazil (%)
Place of birth for the foreign-born population - Chile (%)
Place of birth for the foreign-born population - Colombia (%)
Place of birth for the foreign-born population - Ecuador (%)
Place of birth for the foreign-born population - Guyana (%)
Place of birth for the foreign-born population - Peru (%)
Place of birth for the foreign-born population - Uruguay (%)
Place of birth for the foreign-born population - Venezuela (%)
Place of birth for the foreign-born population - Other South America (%)
Place of birth for the foreign-born population - Canada (%)
Place of birth for the foreign-born population - Other Northern America (%)
Place of birth for the foreign-born population - Other (%)
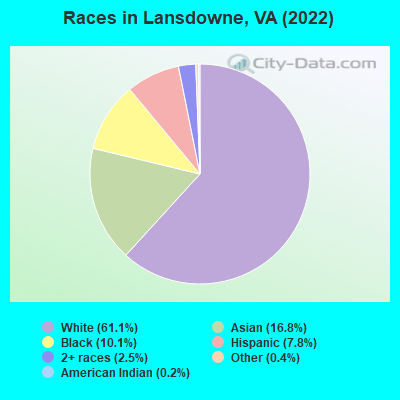
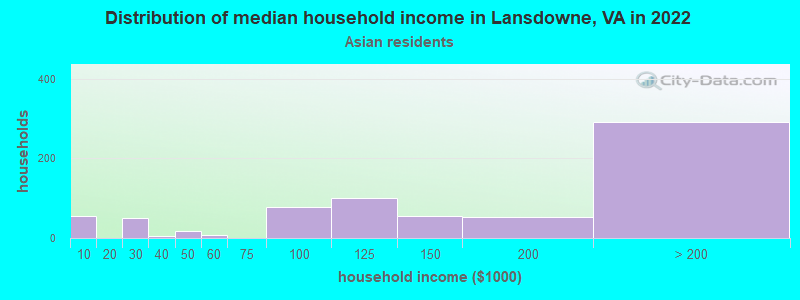
According to 2022 data, the most numerous races in Lansdowne, VA are White alone (8,050 residents), Black alone (1,326 residents), and Hispanic (1,034 residents). 72.5% of Lansdowne residents speak English at home.
Race distribution in Lansdowne 8,050 61.1% White alone 2,220 16.8% Asian alone 1,326 10.1% Black alone 1,034 7.8% Hispanic 336 2.5% Two or more races 56 0.4% Other race alone 27 0.2% American Indian alone 8 0.06% Native Hawaiian and Other
2000 2022
4,965,637 70.2% White alone 1,376,378 19.4% Black alone 329,540 4.7% Hispanic 259,277 3.7% Asian alone 114,022 1.6% Two or more races 18,596 0.3% American Indian alone 11,685 0.2% Other race alone 3,380 0.05% Native Hawaiian and Other
5,095,130 58.7% White alone 1,594,785 18.4% Black alone 905,750 10.4% Hispanic 602,881 6.9% Asian alone 406,047 4.7% Two or more races 60,419 0.7% Other race alone 11,738 0.1% American Indian alone 6,869 0.08% Native Hawaiian and Other
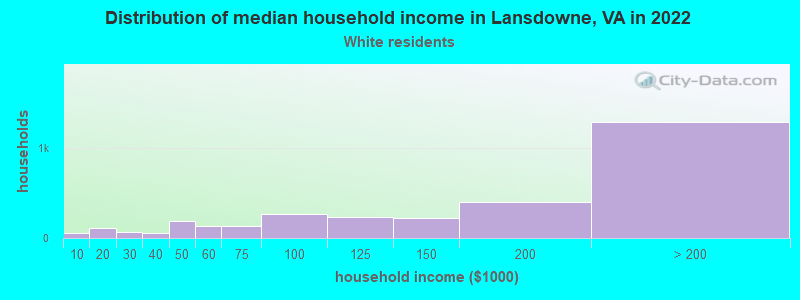
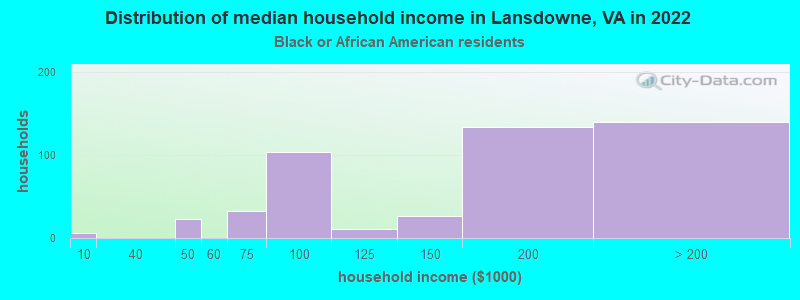
Income and house value in Lansdowne Median household income in 2022 $166,997 White non-Hispanic householders$175,579 Black householders$167,417 Asian householders$99,920 Two or more races householders$117,341 Hispanic or Latino race householders
Median age by race in Lansdowne
45.1 Median age for White residents41.9 48.4 49.5 Median age for Black or African American residents46.4 49.5 51.0 Median age for American Indian / Alaska Native residents87.5 43.0 41.5 Median age for Asian residents41.0 42.0 47.7 Median age for Native Hawaiian / Pacific Islander residents-541,531,822.5 -714,150,046.8 35.2 Median age for Other race residents41.4 30.2 38.3 Median age for Two or more races residents39.6 38.1 44.9 Median age for White alone residents41.7 48.5 38.1 Median age for Hispanic or Latino residents40.0 38.4
Owner/renter occupied households by race in Lansdowne
House owners and renters - White residents 2,378 74.9% Owner occupied796 25.1% Renter occupiedHouse owners and renters - Black or African American residents 295 65.4% Owner occupied156 34.6% Renter occupiedHouse owners and renters - American Indian / Alaska Native residents 13 33.9% Owner occupied26 66.1% Renter occupiedHouse owners and renters - Asian residents 547 79.7% Owner occupied139 20.3% Renter occupiedHouse owners and renters - Native Hawaiian / Pacific Islander residents 3 100.0% Renter occupiedHouse owners and renters - Other race residents 40 100.0% Owner occupiedHouse owners and renters - Two or more races residents 215 79.9% Owner occupied54 20.1% Renter occupiedHouse owners and renters - White alone residents 2,366 75.9% Owner occupied751 24.1% Renter occupiedHouse owners and renters - Hispanic or Latino residents 230 69.0% Owner occupied103 31.0% Renter occupied
Language usage in Lansdowne
English speakers - Total 72.5% of residents of Lansdowne speak English at home.
6.2% of residents speak Spanish at home 675 86.5% Speak English very well105 13.5% Speak English less than very well20.7% of residents speak other language at home 1,797 68.5% Speak English very well826 31.5% Speak English less than very well
English speakers - Born in the United States 92.7% of residents of Lansdowne speak English at home.
3.3% of residents speak Spanish at home 179 93.7% Speak English very well12 6.3% Speak English less than very well3.3% of residents speak other language at home 169 90.4% Speak English very well18 9.6% Speak English less than very well
English speakers - Native, born elsewhere 39.1% of residents of Lansdowne speak English at home.
38.6% of residents speak Spanish at home 161 98.8% Speak English very well2 1.2% Speak English less than very well28.9% of residents speak other language at home 107 87.7% Speak English very well15 12.3% Speak English less than very well
English speakers - Foreign-born 23.6% of residents of Lansdowne speak English at home.
9.6% of residents speak Spanish at home 198 73.3% Speak English very well72 26.7% Speak English less than very well67.5% of residents speak other language at home 1,204 63.2% Speak English very well700 36.8% Speak English less than very well
White (Caucasian) - Speak only English Native:
92.5% (6,116)Foreign-born:
32.5% (357)
White (Caucasian) - Speak another language Native:
7.5% (497)Foreign-born:
65.3% (717)
Black or African American - Speak only English Native:
98.4% (1,266)Foreign-born:
53.7% (26)
Asian - Speak only English Native:
68.0% (704)Foreign-born:
13.8% (167)
Asian - Speak another language Native:
28.4% (294)Foreign-born:
86.2% (1,040)
Other race - Speak only English Native:
34.3% (53)Foreign-born:
17.0% (18)
Other race - Speak another language Native:
65.8% (102)Foreign-born:
82.2% (87)
Two or more races - Speak only English Native:
56.0% (338)Foreign-born:
27.0% (57)
Two or more races - Speak another language Native:
47.2% (285)Foreign-born:
74.8% (157)
White alone - Speak only English Native:
92.9% (6,007)Foreign-born:
29.0% (356)
White alone - Speak another language Native:
7.5% (485)Foreign-born:
66.3% (813)
Hispanic or Latino - Speak only English Native:
36.1% (255)Foreign-born:
12.0% (33)
Hispanic or Latino - Speak another language Native:
63.6% (449)Foreign-born:
88.3% (241)
Foreign-born residents in Lansdowne
Marital status for residents in Lansdowne Marital status - White (Caucasian) population 15 years and over
Males 30.0% Never married59.6% Now married1.2% Separated1.1% Widowed8.1% DivorcedFemales 20.1% Never married55.4% Now married1.5% Separated9.2% Widowed13.8% DivorcedWomen who gave birth in the past 12 months Now married:
100.0% (114)Unmarried:
0.0% (0)
Women who did not give birth in the past 12 months Now married:
46.5% (704)Unmarried:
53.5% (812)
Marital status - Black or African American population 15 years and over
Males 42.8% Never married37.9% Now married5.9% Separated4.4% Widowed8.9% DivorcedFemales 40.1% Never married40.1% Now married0.0% Separated6.0% Widowed13.8% DivorcedWomen who gave birth in the past 12 months Now married:
0.0% (0)Unmarried:
100.0% (35)
Women who did not give birth in the past 12 months Now married:
30.3% (100)Unmarried:
69.7% (229)
Marital status - American Indian / Alaska Native population 15 years and over
Males 0.0% Never married100.0% Now married0.0% Separated0.0% Widowed0.0% DivorcedFemales 0.0% Never married100.0% Now married0.0% Separated0.0% Widowed0.0% DivorcedWomen who did not give birth in the past 12 months Now married:
100.0% (24)Unmarried:
0.0% (0)
Marital status - Asian population 15 years and over
Males 32.2% Never married64.5% Now married3.3% Separated0.0% Widowed0.0% DivorcedFemales 33.8% Never married51.7% Now married0.0% Separated8.6% Widowed5.9% DivorcedWomen who gave birth in the past 12 months Now married:
100.0% (15)Unmarried:
0.0% (0)
Women who did not give birth in the past 12 months Now married:
42.2% (303)Unmarried:
57.8% (414)
Marital status - Native Hawaiian / Pacific Islander population 15 years and over
Males 100.0% Never married0.0% Now married0.0% Separated0.0% Widowed0.0% DivorcedFemales 0.0% Never married0.0% Now married0.0% Separated0.0% Widowed100.0% DivorcedWomen who did not give birth in the past 12 months Now married:
0.0% (0)Unmarried:
100.0% (5)
Marital status - Other race population 15 years and over
Males 0.0% Never married100.0% Now married0.0% Separated0.0% Widowed0.0% DivorcedFemales 52.6% Never married33.8% Now married0.0% Separated13.5% Widowed0.0% DivorcedWomen who did not give birth in the past 12 months Now married:
39.1% (56)Unmarried:
60.9% (86)
Marital status - Two or more races population 15 years and over
Males 39.2% Never married43.2% Now married0.0% Separated0.0% Widowed17.6% DivorcedFemales 22.9% Never married64.8% Now married0.0% Separated6.2% Widowed6.2% DivorcedWomen who did not give birth in the past 12 months Now married:
69.8% (133)Unmarried:
30.2% (57)
Marital status - White alone, not Hispanic / Latino population 15 years and over
Males 30.7% Never married58.6% Now married1.2% Separated1.1% Widowed8.3% DivorcedFemales 21.1% Never married54.9% Now married1.4% Separated9.4% Widowed13.3% DivorcedWomen who gave birth in the past 12 months Now married:
100.0% (110)Unmarried:
0.0% (0)
Women who did not give birth in the past 12 months Now married:
45.3% (702)Unmarried:
54.7% (847)
Marital status - Hispanic or Latino population 15 years and over
Males 15.4% Never married71.0% Now married0.0% Separated0.0% Widowed13.7% DivorcedFemales 11.9% Never married64.3% Now married2.2% Separated10.8% Widowed10.8% DivorcedWomen who gave birth in the past 12 months Now married:
100.0% (10)Unmarried:
0.0% (0)
Women who did not give birth in the past 12 months Now married:
76.3% (151)Unmarried:
23.7% (47)
Ancestries in Lansdowne
480 6.8% Egyptian478 6.8% American413 5.9% European384 5.5% German369 5.3% Irish277 3.9% English248 3.5% Italian207 2.9% Lebanese159 2.3% Iranian85 1.2% Russian78 1.1% Scottish76 1.1% Greek73 1.0% Polish65 0.9% French51 0.7% British41 0.6% Austrian38 0.5% Finnish36 0.5% Iraqi29 0.4% Jamaican27 0.4% Brazilian25 0.4% Ukrainian21 0.3% Swedish20 0.3% Romanian14 0.2% Hungarian11 0.2% Yugoslavian11 0.2% Lithuanian11 0.2% Australian10 0.1% Norwegian10 0.1% Eastern European10 0.1% French Canadian9 0.1% Dutch9 0.1% Afghan8 0.1% Croatian8 0.1% Ethiopian8 0.1% Turkish7 0.10% Slovak6 0.09% Scotch-Irish5 0.07% Danish5 0.07% Welsh4 0.06% Canadian4 0.06% Albanian4 0.06% African
Children Nativity (place of birth) in Lansdowne
Children under 6 years - Living with two parents Both parents native 218 100.0% NativeBoth parents foreign-born 184 72.1% Native71 27.9% Foreign-bornOne native, one foreign-born parent 57 100.0% NativeChildren under 6 years - Living with one parent Native parent 52 100.0% NativeChildren 6 to 17 years - Living with two parents Both parents native 1,269 100.0% NativeBoth parents foreign-born 361 88.7% Native46 11.3% Foreign-bornOne native, one foreign-born parent 242 97.2% Native7 2.8% Foreign-bornChildren 6 to 17 years - Living with one parent Native parent 401 100.0% NativeForeign-born parent 62 48.3% Native66 51.7% Foreign-born
Grandparents responsible for own grandchildren in Lansdowne
Grandparents (30 to 59 years) White / Caucasian 11 100.0% Not responsible for grandchildrenWhite alone, not Hispanic / Latino 13 100.0% Not responsible for grandchildren
Grandparents (60 years and over) White / Caucasian 32 100.0% Not responsible for grandchildrenWhite alone, not Hispanic / Latino 34 100.0% Not responsible for grandchildren