Races in Madison Park, New Jersey (NJ) Detailed Stats
Data:
Races - White alone (%)
Races - White alone (% change since 2000)
Races - Black alone (%)
Races - Black alone (% change since 2000)
Races - American Indian alone (%)
Races - American Indian alone (% change since 2000)
Races - Asian alone (%)
Races - Asian alone (% change since 2000)
Races - Hispanic (%)
Races - Hispanic (% change since 2000)
Races - Native Hawaiian and Other Pacific Islander alone (%)
Races - Native Hawaiian and Other Pacific Islander alone (% change since 2000)
Races - Two or more races(%)
Races - Two or more races(% change since 2000)
Races - Other race alone (%)
Races - Other race alone (% change since 2000)
Racial diversity
Place of birth - Born in state of residence (%)
Place of birth - Born in state of residence (%) - White
Place of birth - Born in state of residence (%) - Black or African American
Place of birth - Born in state of residence (%) - Asian
Place of birth - Born in state of residence (%) - Hispanic or Latino
Place of birth - Born in state of residence (%) - American Indian and Alaska Native
Place of birth - Born in state of residence (%) - Multirace
Place of birth - Born in state of residence (%) - Other Race
Place of birth - Born in other state (%)
Place of birth - Born in other state (%) - White
Place of birth - Born in other state (%) - Black or African American
Place of birth - Born in other state (%) - Asian
Place of birth - Born in other state (%) - Hispanic or Latino
Place of birth - Born in other state (%) - American Indian and Alaska Native
Place of birth - Born in other state (%) - Multirace
Place of birth - Born in other state (%) - Other Race
Place of birth - Native, outside of US (%)
Place of birth - Native, outside of US (%) - White
Place of birth - Native, outside of US (%) - Black or African American
Place of birth - Native, outside of US (%) - Asian
Place of birth - Native, outside of US (%) - Hispanic or Latino
Place of birth - Native, outside of US (%) - American Indian and Alaska Native
Place of birth - Native, outside of US (%) - Multirace
Place of birth - Native, outside of US (%) - Other Race
Place of birth - Foreign born (%)
Place of birth - Foreign born (%) - White
Place of birth - Foreign born (%) - Black or African American
Place of birth - Foreign born (%) - Asian
Place of birth - Foreign born (%) - Hispanic or Latino
Place of birth - Foreign born (%) - American Indian and Alaska Native
Place of birth - Foreign born (%) - Multirace
Place of birth - Foreign born (%) - Other Race
Residents speaking English at home (%)
Residents speaking English at home - Born in the United States (%)
Residents speaking English at home - Native, born elsewhere (%)
Residents speaking English at home - Foreign born (%)
Residents speaking Spanish at home (%)
Residents speaking Spanish at home - Born in the United States (%)
Residents speaking Spanish at home - Native, born elsewhere (%)
Residents speaking Spanish at home - Foreign born (%)
Residents speaking other language at home (%)
Residents speaking other language at home - Born in the United States (%)
Residents speaking other language at home - Native, born elsewhere (%)
Residents speaking other language at home - Foreign born (%)
Marital status - Never married (%)
Marital status - Now married (%)
Marital status - Separated (%)
Marital status - Widowed (%)
Marital status - Divorced (%)
Ancestries Reported - Arab (%)
Ancestries Reported - Czech (%)
Ancestries Reported - Danish (%)
Ancestries Reported - Dutch (%)
Ancestries Reported - English (%)
Ancestries Reported - French (%)
Ancestries Reported - French Canadian (%)
Ancestries Reported - German (%)
Ancestries Reported - Greek (%)
Ancestries Reported - Hungarian (%)
Ancestries Reported - Irish (%)
Ancestries Reported - Italian (%)
Ancestries Reported - Lithuanian (%)
Ancestries Reported - Norwegian (%)
Ancestries Reported - Polish (%)
Ancestries Reported - Portuguese (%)
Ancestries Reported - Russian (%)
Ancestries Reported - Scotch-Irish (%)
Ancestries Reported - Scottish (%)
Ancestries Reported - Slovak (%)
Ancestries Reported - Subsaharan African (%)
Ancestries Reported - Swedish (%)
Ancestries Reported - Swiss (%)
Ancestries Reported - Ukrainian (%)
Ancestries Reported - United States (%)
Ancestries Reported - Welsh (%)
Ancestries Reported - West Indian (%)
Ancestries Reported - Other (%)
Geographical mobility - Same house 1 year ago (%)
Geographical mobility - Same house 1 year ago (%) - White
Geographical mobility - Same house 1 year ago (%) - Black or African American
Geographical mobility - Same house 1 year ago (%) - Asian
Geographical mobility - Same house 1 year ago (%) - Hispanic or Latino
Geographical mobility - Same house 1 year ago (%) - American Indian and Alaska Native
Geographical mobility - Same house 1 year ago (%) - Multirace
Geographical mobility - Same house 1 year ago (%) - Other Race
Geographical mobility - Moved within same county (%)
Geographical mobility - Moved within same county (%) - White
Geographical mobility - Moved within same county (%) - Black or African American
Geographical mobility - Moved within same county (%) - Asian
Geographical mobility - Moved within same county (%) - Hispanic or Latino
Geographical mobility - Moved within same county (%) - American Indian and Alaska Native
Geographical mobility - Moved within same county (%) - Multirace
Geographical mobility - Moved within same county (%) - Other Race
Geographical mobility - Moved from different county within same state (%)
Geographical mobility - Moved from different county within same state (%) - White
Geographical mobility - Moved from different county within same state (%) - Black or African American
Geographical mobility - Moved from different county within same state (%) - Asian
Geographical mobility - Moved from different county within same state (%) - Hispanic or Latino
Geographical mobility - Moved from different county within same state (%) - American Indian and Alaska Native
Geographical mobility - Moved from different county within same state (%) - Multirace
Geographical mobility - Moved from different county within same state (%) - Other Race
Geographical mobility - Moved from different state (%)
Geographical mobility - Moved from different state (%) - White
Geographical mobility - Moved from different state (%) - Black or African American
Geographical mobility - Moved from different state (%) - Asian
Geographical mobility - Moved from different state (%) - Hispanic or Latino
Geographical mobility - Moved from different state (%) - American Indian and Alaska Native
Geographical mobility - Moved from different state (%) - Multirace
Geographical mobility - Moved from different state (%) - Other Race
Geographical mobility - Moved from abroad (%)
Geographical mobility - Moved from abroad (%) - White
Geographical mobility - Moved from abroad (%) - Black or African American
Geographical mobility - Moved from abroad (%) - Asian
Geographical mobility - Moved from abroad (%) - Hispanic or Latino
Geographical mobility - Moved from abroad (%) - American Indian and Alaska Native
Geographical mobility - Moved from abroad (%) - Multirace
Geographical mobility - Moved from abroad (%) - Other Race
Place of birth for the foreign-born population - Ireland (%)
Place of birth for the foreign-born population - Denmark (%)
Place of birth for the foreign-born population - Norway (%)
Place of birth for the foreign-born population - Sweden (%)
Place of birth for the foreign-born population - United Kingdom (%)
Place of birth for the foreign-born population - England (%)
Place of birth for the foreign-born population - Scotland (%)
Place of birth for the foreign-born population - Other Northern Europe (%)
Place of birth for the foreign-born population - Austria (%)
Place of birth for the foreign-born population - Belgium (%)
Place of birth for the foreign-born population - France (%)
Place of birth for the foreign-born population - Germany (%)
Place of birth for the foreign-born population - Netherlands (%)
Place of birth for the foreign-born population - Switzerland (%)
Place of birth for the foreign-born population - Other Western Europe (%)
Place of birth for the foreign-born population - Greece (%)
Place of birth for the foreign-born population - Italy (%)
Place of birth for the foreign-born population - Portugal (%)
Place of birth for the foreign-born population - Spain (%)
Place of birth for the foreign-born population - Other Southern Europe (%)
Place of birth for the foreign-born population - Albania (%)
Place of birth for the foreign-born population - Belarus (%)
Place of birth for the foreign-born population - Bosnia and Herzegovina (%)
Place of birth for the foreign-born population - Bulgaria (%)
Place of birth for the foreign-born population - Croatia (%)
Place of birth for the foreign-born population - Czechoslovakia (%)
Place of birth for the foreign-born population - Hungary (%)
Place of birth for the foreign-born population - Latvia (%)
Place of birth for the foreign-born population - Lithuania (%)
Place of birth for the foreign-born population - North Macedonia (Macedonia) (%)
Place of birth for the foreign-born population - Moldova (%)
Place of birth for the foreign-born population - Poland (%)
Place of birth for the foreign-born population - Romania (%)
Place of birth for the foreign-born population - Russia (%)
Place of birth for the foreign-born population - Serbia (%)
Place of birth for the foreign-born population - Ukraine (%)
Place of birth for the foreign-born population - Other Eastern Europe (%)
Place of birth for the foreign-born population - China (%)
Place of birth for the foreign-born population - Hong Kong (%)
Place of birth for the foreign-born population - Taiwan (%)
Place of birth for the foreign-born population - Japan (%)
Place of birth for the foreign-born population - Korea (%)
Place of birth for the foreign-born population - Other Eastern Asia (%)
Place of birth for the foreign-born population - Afghanistan (%)
Place of birth for the foreign-born population - Bangladesh (%)
Place of birth for the foreign-born population - India (%)
Place of birth for the foreign-born population - Iran (%)
Place of birth for the foreign-born population - Kazakhstan (%)
Place of birth for the foreign-born population - Nepal (%)
Place of birth for the foreign-born population - Pakistan (%)
Place of birth for the foreign-born population - Sri Lanka (%)
Place of birth for the foreign-born population - Uzbekistan (%)
Place of birth for the foreign-born population - Other South Central Asia (%)
Place of birth for the foreign-born population - Burma (%)
Place of birth for the foreign-born population - Cambodia (%)
Place of birth for the foreign-born population - Indonesia (%)
Place of birth for the foreign-born population - Laos (%)
Place of birth for the foreign-born population - Malaysia (%)
Place of birth for the foreign-born population - Philippines (%)
Place of birth for the foreign-born population - Singapore (%)
Place of birth for the foreign-born population - Thailand (%)
Place of birth for the foreign-born population - Vietnam (%)
Place of birth for the foreign-born population - Other South Eastern Asia (%)
Place of birth for the foreign-born population - Armenia (%)
Place of birth for the foreign-born population - Iraq (%)
Place of birth for the foreign-born population - Israel (%)
Place of birth for the foreign-born population - Jordan (%)
Place of birth for the foreign-born population - Kuwait (%)
Place of birth for the foreign-born population - Lebanon (%)
Place of birth for the foreign-born population - Saudi Arabia (%)
Place of birth for the foreign-born population - Syria (%)
Place of birth for the foreign-born population - Turkey (%)
Place of birth for the foreign-born population - Yemen (%)
Place of birth for the foreign-born population - Other Western Asia (%)
Place of birth for the foreign-born population - Eritrea (%)
Place of birth for the foreign-born population - Ethiopia (%)
Place of birth for the foreign-born population - Kenya (%)
Place of birth for the foreign-born population - Somalia (%)
Place of birth for the foreign-born population - Uganda (%)
Place of birth for the foreign-born population - Zimbabwe (%)
Place of birth for the foreign-born population - Other Eastern Africa (%)
Place of birth for the foreign-born population - Cameroon (%)
Place of birth for the foreign-born population - Congo (%)
Place of birth for the foreign-born population - Democratic Republic of Congo (Zaire) (%)
Place of birth for the foreign-born population - Other Middle Africa (%)
Place of birth for the foreign-born population - Egypt (%)
Place of birth for the foreign-born population - Morocco (%)
Place of birth for the foreign-born population - Sudan (%)
Place of birth for the foreign-born population - Other Northern Africa (%)
Place of birth for the foreign-born population - South Africa (%)
Place of birth for the foreign-born population - Other Southern Africa (%)
Place of birth for the foreign-born population - Cabo Verde (%)
Place of birth for the foreign-born population - Ghana (%)
Place of birth for the foreign-born population - Liberia (%)
Place of birth for the foreign-born population - Nigeria (%)
Place of birth for the foreign-born population - Senegal (%)
Place of birth for the foreign-born population - Sierra Leone (%)
Place of birth for the foreign-born population - Other Western Africa (%)
Place of birth for the foreign-born population - Australia (%)
Place of birth for the foreign-born population - New Zealand (%)
Place of birth for the foreign-born population - Fiji (%)
Place of birth for the foreign-born population - Micronesia (%)
Place of birth for the foreign-born population - Bahamas (%)
Place of birth for the foreign-born population - Barbados (%)
Place of birth for the foreign-born population - Cuba (%)
Place of birth for the foreign-born population - Dominica (%)
Place of birth for the foreign-born population - Dominican Republic (%)
Place of birth for the foreign-born population - Grenada (%)
Place of birth for the foreign-born population - Haiti (%)
Place of birth for the foreign-born population - Jamaica (%)
Place of birth for the foreign-born population - St. Vincent and the Grenadines (%)
Place of birth for the foreign-born population - Trinidad and Tobago (%)
Place of birth for the foreign-born population - West Indies (%)
Place of birth for the foreign-born population - Other Caribbean (%)
Place of birth for the foreign-born population - Belize (%)
Place of birth for the foreign-born population - Costa Rica (%)
Place of birth for the foreign-born population - El Salvador (%)
Place of birth for the foreign-born population - Guatemala (%)
Place of birth for the foreign-born population - Honduras (%)
Place of birth for the foreign-born population - Mexico (%)
Place of birth for the foreign-born population - Nicaragua (%)
Place of birth for the foreign-born population - Panama (%)
Place of birth for the foreign-born population - Other Central America (%)
Place of birth for the foreign-born population - Argentina (%)
Place of birth for the foreign-born population - Bolivia (%)
Place of birth for the foreign-born population - Brazil (%)
Place of birth for the foreign-born population - Chile (%)
Place of birth for the foreign-born population - Colombia (%)
Place of birth for the foreign-born population - Ecuador (%)
Place of birth for the foreign-born population - Guyana (%)
Place of birth for the foreign-born population - Peru (%)
Place of birth for the foreign-born population - Uruguay (%)
Place of birth for the foreign-born population - Venezuela (%)
Place of birth for the foreign-born population - Other South America (%)
Place of birth for the foreign-born population - Canada (%)
Place of birth for the foreign-born population - Other Northern America (%)
Place of birth for the foreign-born population - Other (%)
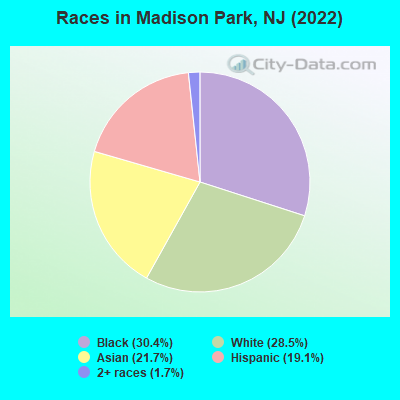
According to 2022 data, the most numerous races in Madison Park, NJ are White alone (2,364 residents), Hispanic (1,584 residents), and Black alone (2,526 residents). 52.3% of Madison Park residents speak English at home. 32.8% of Madison Park, NJ residents are foreign-born (13.4% born in Asia, 7.8% born in Latin America, 7.5% born in Africa, 3.6% born in Europe), which is 29.9% greater than the foreign-born rate of 23.0% across the entire state of New Jersey.
Race distribution in Madison Park
2000 2022
5,557,209 66.0% White alone 1,117,191 13.3% Hispanic 1,096,171 13.0% Black alone 477,012 5.7% Asian alone 133,689 1.6% Two or more races 19,565 0.2% Other race alone 11,338 0.1% American Indian alone 2,175 0.03% Native Hawaiian and Other
4,766,476 51.5% White alone 2,028,470 21.9% Hispanic 1,111,632 12.0% Black alone 923,546 10.0% Asian alone 332,237 3.6% Two or more races 89,847 1.0% Other race alone 8,557 0.09% American Indian alone 934 0.01% Native Hawaiian and Other
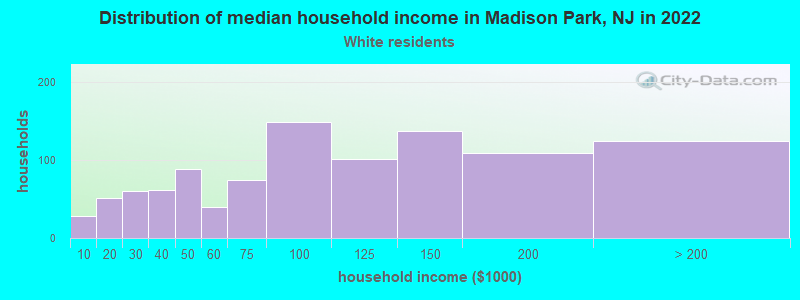
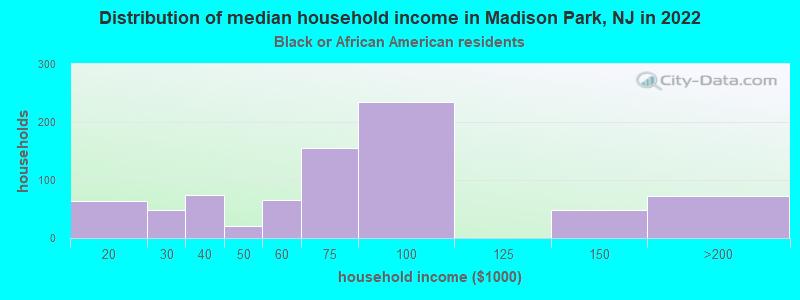
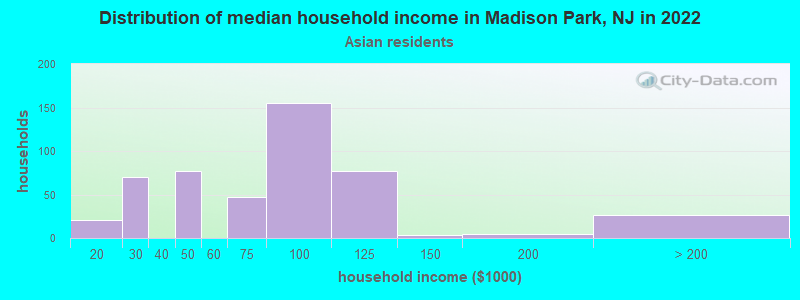
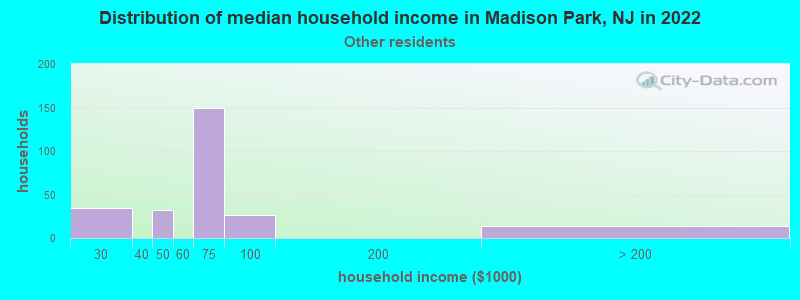
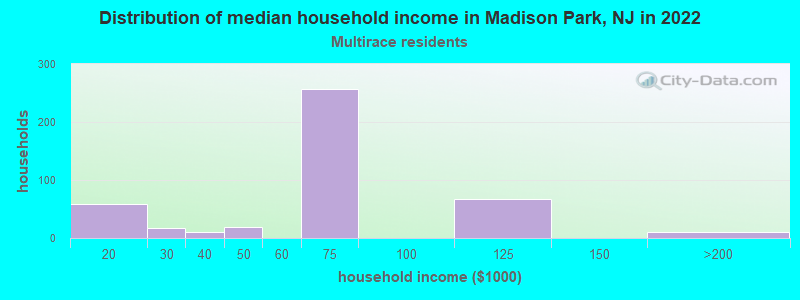
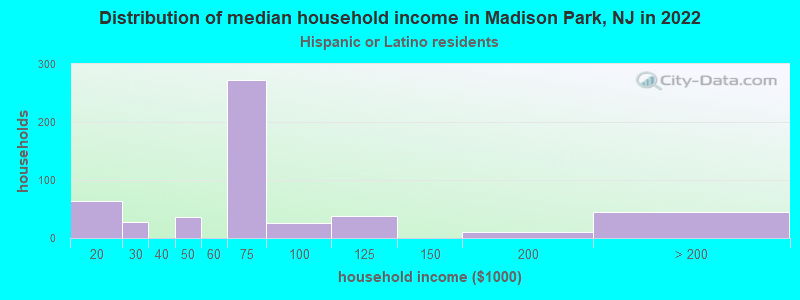
Income and house value in Madison Park Median household income in 2022 $91,963 White non-Hispanic householders$64,500 Black householders$77,798 Asian householders$60,439 Some other race householders$60,298 Two or more races householders$64,678 Hispanic or Latino race householdersMedian 2022 house value $374,183 White Non-Hispanic householders$419,750 Black or African American householders $412,245 Asian householders$368,554 Native Hawaiian and other Pacific Islander householders$379,812 Some other race householders$368,554 Two or more races householders$379,812 Hispanic or Latino householders
Median age by race in Madison Park
48.6 Median age for White residents49.8 48.3 24.4 Median age for Black or African American residents24.8 25.9 -673,036,092.7 Median age for American Indian / Alaska Native residents-624,624,624.0 -739,999,999.3 34.3 Median age for Asian residents32.9 35.3 -939,393,938.5 Median age for Native Hawaiian / Pacific Islander residents-860,335,194.7 -713,070,378.3 26.7 Median age for Other race residents25.8 26.8 33.6 Median age for Two or more races residents42.2 31.5 47.2 Median age for White alone residents48.9 46.7 30.2 Median age for Hispanic or Latino residents26.0 30.8
Owner/renter occupied households by race in Madison Park
House owners and renters - White residents 556 56.6% Owner occupied426 43.4% Renter occupiedHouse owners and renters - Black or African American residents 111 12.8% Owner occupied755 87.2% Renter occupiedHouse owners and renters - Asian residents 64 14.5% Owner occupied377 85.5% Renter occupiedHouse owners and renters - Other race residents 40 16.6% Owner occupied204 83.4% Renter occupiedHouse owners and renters - Two or more races residents 123 36.2% Owner occupied216 63.8% Renter occupiedHouse owners and renters - White alone residents 537 51.4% Owner occupied509 48.6% Renter occupiedHouse owners and renters - Hispanic or Latino residents 133 29.1% Owner occupied326 70.9% Renter occupied
Language usage in Madison Park
English speakers - Total 52.3% of residents of Madison Park speak English at home.
11.1% of residents speak Spanish at home 408 47.0% Speak English very well461 53.0% Speak English less than very well37.2% of residents speak other language at home 1,575 54.2% Speak English very well1,332 45.8% Speak English less than very well
English speakers - Born in the United States 81.3% of residents of Madison Park speak English at home.
6.3% of residents speak Spanish at home 80 95.2% Speak English very well4 4.8% Speak English less than very well12.4% of residents speak other language at home 166 100.0% Speak English very well
English speakers - Native, born elsewhere 0.0% of residents of Madison Park speak English at home.
46.2% of residents speak Spanish at home 32 35.2% Speak English very well59 64.8% Speak English less than very well50.8% of residents speak other language at home 60 60.0% Speak English very well40 40.0% Speak English less than very well
English speakers - Foreign-born 15.7% of residents of Madison Park speak English at home.
9.8% of residents speak Spanish at home 87 31.6% Speak English very well188 68.4% Speak English less than very well74.5% of residents speak other language at home 848 40.5% Speak English very well1,246 59.5% Speak English less than very well
White (Caucasian) - Speak only English Native:
91.9% (1,690)Foreign-born:
30.6% (117)
White (Caucasian) - Speak another language Native:
8.1% (149)Foreign-born:
72.7% (278)
Black or African American - Speak only English Native:
86.5% (1,315)Foreign-born:
22.3% (210)
Black or African American - Speak another language Native:
12.8% (195)Foreign-born:
85.4% (804)
Asian - Speak only English Native:
32.1% (209)Foreign-born:
3.2% (35)
Asian - Speak another language Native:
68.4% (445)Foreign-born:
96.3% (1,071)
Other race - Speak only English Native:
64.1% (253)Foreign-born:
27.9% (56)
Other race - Speak another language Native:
44.2% (174)Foreign-born:
79.0% (158)
Two or more races - Speak only English Native:
39.2% (309)Foreign-born:
6.9% (13)
Two or more races - Speak another language Native:
61.7% (485)Foreign-born:
93.4% (173)
White alone - Speak only English Native:
92.3% (1,680)Foreign-born:
21.1% (98)
White alone - Speak another language Native:
7.1% (129)Foreign-born:
78.7% (364)
Hispanic or Latino - Speak only English Native:
44.6% (447)Foreign-born:
36.6% (138)
Hispanic or Latino - Speak another language Native:
56.1% (562)Foreign-born:
73.6% (277)
Foreign-born residents in Madison Park 2,726 residents are foreign born (13.4% Asia , 7.8% Latin America , 7.5% Africa , 3.6% Europe ).
This city:
32.8%New Jersey:
23.2%
Marital status for residents in Madison Park Marital status - White (Caucasian) population 15 years and over
Males 25.2% Never married59.6% Now married0.0% Separated1.5% Widowed13.7% DivorcedFemales 29.1% Never married52.0% Now married1.5% Separated5.4% Widowed12.0% DivorcedWomen who gave birth in the past 12 months Now married:
100.0% (8)Unmarried:
0.0% (0)
Women who did not give birth in the past 12 months Now married:
45.0% (282)Unmarried:
55.0% (345)
Marital status - Black or African American population 15 years and over
Males 35.2% Never married51.0% Now married7.3% Separated2.6% Widowed4.0% DivorcedFemales 55.4% Never married25.4% Now married7.7% Separated4.6% Widowed6.8% DivorcedWomen who gave birth in the past 12 months Now married:
0.0% (0)Unmarried:
100.0% (46)
Women who did not give birth in the past 12 months Now married:
33.8% (190)Unmarried:
66.2% (373)
Marital status - Asian population 15 years and over
Males 29.9% Never married64.0% Now married0.0% Separated0.0% Widowed6.1% DivorcedFemales 12.9% Never married79.8% Now married0.0% Separated5.4% Widowed2.0% DivorcedWomen who gave birth in the past 12 months Now married:
100.0% (44)Unmarried:
0.0% (0)
Women who did not give birth in the past 12 months Now married:
76.7% (299)Unmarried:
23.3% (91)
Marital status - Other race population 15 years and over
Males 53.6% Never married46.4% Now married0.0% Separated0.0% Widowed0.0% DivorcedFemales 43.1% Never married25.1% Now married0.0% Separated0.0% Widowed31.8% DivorcedWomen who gave birth in the past 12 months Now married:
0.0% (0)Unmarried:
100.0% (114)
Women who did not give birth in the past 12 months Now married:
46.6% (48)Unmarried:
53.4% (55)
Marital status - Two or more races population 15 years and over
Males 29.7% Never married58.6% Now married3.2% Separated0.0% Widowed8.6% DivorcedFemales 64.5% Never married23.9% Now married0.0% Separated3.0% Widowed8.7% DivorcedWomen who did not give birth in the past 12 months Now married:
12.5% (57)Unmarried:
87.5% (398)
Marital status - White alone, not Hispanic / Latino population 15 years and over
Males 24.8% Never married59.1% Now married0.0% Separated1.6% Widowed14.6% DivorcedFemales 25.4% Never married53.7% Now married1.7% Separated6.0% Widowed13.2% DivorcedWomen who gave birth in the past 12 months Now married:
100.0% (10)Unmarried:
0.0% (0)
Women who did not give birth in the past 12 months Now married:
49.1% (316)Unmarried:
50.9% (328)
Marital status - Hispanic or Latino population 15 years and over
Males 46.5% Never married48.6% Now married0.0% Separated0.0% Widowed4.9% DivorcedFemales 60.0% Never married25.9% Now married0.0% Separated1.8% Widowed12.3% DivorcedWomen who gave birth in the past 12 months Now married:
0.0% (0)Unmarried:
100.0% (85)
Women who did not give birth in the past 12 months Now married:
16.9% (87)Unmarried:
83.1% (428)
Ancestries in Madison Park
357 6.6% Egyptian199 3.7% Polish158 2.9% Irish157 2.9% African153 2.8% Italian127 2.4% Haitian96 1.8% American95 1.8% Ghanaian95 1.8% Jamaican73 1.4% German67 1.2% Slavic53 1.0% Slovak40 0.7% Ukrainian39 0.7% Nigerian19 0.4% Albanian18 0.3% Sierra Leonean13 0.2% British West Indian7 0.1% European7 0.1% Hungarian6 0.1% Scotch-Irish5 0.09% Estonian5 0.09% Russian4 0.07% Eastern European
Geographical mobility in Madison Park Same house 1 year ago 2,234 97.2% White (Caucasian)2,265 87.2% Black or African American1,746 96.0% Asian506 74.3% Other race1,006 100.0% Two or more races2,265 96.3% White alone, not Hispanic / Latino1,381 92.6% Hispanic or LatinoMoved within same county 56 2.4% White / Caucasian123 4.7% Black or African American67 3.7% Asian35 5.1% Other race68 2.9% White alone, not Hispanic / Latino30 2.0% Hispanic or LatinoMoved within same state 16 0.7% White / Caucasian53 2.0% Black or African American6 0.3% Asian107 15.7% Other race18 0.8% White alone, not Hispanic / Latino71 4.8% Hispanic or LatinoMoved from different state 6 0.3% White / Caucasian28 1.5% Asian7 0.3% White alone, not Hispanic / LatinoMoved from abroad 162 6.2% Black or African American
Children Nativity (place of birth) in Madison Park
Children under 6 years - Living with two parents Both parents native 139 100.0% NativeBoth parents foreign-born 96 100.0% NativeOne native, one foreign-born parent 44 100.0% NativeChildren under 6 years - Living with one parent Native parent 230 100.0% NativeForeign-born parent 69 100.0% NativeChildren 6 to 17 years - Living with two parents Both parents native 119 100.0% NativeBoth parents foreign-born 885 96.1% Native35 3.9% Foreign-bornOne native, one foreign-born parent 22 100.0% NativeChildren 6 to 17 years - Living with one parent Native parent 208 100.0% NativeForeign-born parent 359 54.8% Native297 45.2% Foreign-born
Grandparents responsible for own grandchildren in Madison Park
Grandparents (30 to 59 years) Black or African American 34 40.2% Responsible for grandchildren51 59.8% Not responsible for grandchildren
Grandparents (60 years and over)