Races in Mankato, Minnesota (MN) Detailed Stats
Data:
Races - White alone (%)
Races - White alone (% change since 2000)
Races - Black alone (%)
Races - Black alone (% change since 2000)
Races - American Indian alone (%)
Races - American Indian alone (% change since 2000)
Races - Asian alone (%)
Races - Asian alone (% change since 2000)
Races - Hispanic (%)
Races - Hispanic (% change since 2000)
Races - Native Hawaiian and Other Pacific Islander alone (%)
Races - Native Hawaiian and Other Pacific Islander alone (% change since 2000)
Races - Two or more races(%)
Races - Two or more races(% change since 2000)
Races - Other race alone (%)
Races - Other race alone (% change since 2000)
Racial diversity
Place of birth - Born in state of residence (%)
Place of birth - Born in state of residence (%) - White
Place of birth - Born in state of residence (%) - Black or African American
Place of birth - Born in state of residence (%) - Asian
Place of birth - Born in state of residence (%) - Hispanic or Latino
Place of birth - Born in state of residence (%) - American Indian and Alaska Native
Place of birth - Born in state of residence (%) - Multirace
Place of birth - Born in state of residence (%) - Other Race
Place of birth - Born in other state (%)
Place of birth - Born in other state (%) - White
Place of birth - Born in other state (%) - Black or African American
Place of birth - Born in other state (%) - Asian
Place of birth - Born in other state (%) - Hispanic or Latino
Place of birth - Born in other state (%) - American Indian and Alaska Native
Place of birth - Born in other state (%) - Multirace
Place of birth - Born in other state (%) - Other Race
Place of birth - Native, outside of US (%)
Place of birth - Native, outside of US (%) - White
Place of birth - Native, outside of US (%) - Black or African American
Place of birth - Native, outside of US (%) - Asian
Place of birth - Native, outside of US (%) - Hispanic or Latino
Place of birth - Native, outside of US (%) - American Indian and Alaska Native
Place of birth - Native, outside of US (%) - Multirace
Place of birth - Native, outside of US (%) - Other Race
Place of birth - Foreign born (%)
Place of birth - Foreign born (%) - White
Place of birth - Foreign born (%) - Black or African American
Place of birth - Foreign born (%) - Asian
Place of birth - Foreign born (%) - Hispanic or Latino
Place of birth - Foreign born (%) - American Indian and Alaska Native
Place of birth - Foreign born (%) - Multirace
Place of birth - Foreign born (%) - Other Race
Residents speaking English at home (%)
Residents speaking English at home - Born in the United States (%)
Residents speaking English at home - Native, born elsewhere (%)
Residents speaking English at home - Foreign born (%)
Residents speaking Spanish at home (%)
Residents speaking Spanish at home - Born in the United States (%)
Residents speaking Spanish at home - Native, born elsewhere (%)
Residents speaking Spanish at home - Foreign born (%)
Residents speaking other language at home (%)
Residents speaking other language at home - Born in the United States (%)
Residents speaking other language at home - Native, born elsewhere (%)
Residents speaking other language at home - Foreign born (%)
Marital status - Never married (%)
Marital status - Now married (%)
Marital status - Separated (%)
Marital status - Widowed (%)
Marital status - Divorced (%)
Ancestries Reported - Arab (%)
Ancestries Reported - Czech (%)
Ancestries Reported - Danish (%)
Ancestries Reported - Dutch (%)
Ancestries Reported - English (%)
Ancestries Reported - French (%)
Ancestries Reported - French Canadian (%)
Ancestries Reported - German (%)
Ancestries Reported - Greek (%)
Ancestries Reported - Hungarian (%)
Ancestries Reported - Irish (%)
Ancestries Reported - Italian (%)
Ancestries Reported - Lithuanian (%)
Ancestries Reported - Norwegian (%)
Ancestries Reported - Polish (%)
Ancestries Reported - Portuguese (%)
Ancestries Reported - Russian (%)
Ancestries Reported - Scotch-Irish (%)
Ancestries Reported - Scottish (%)
Ancestries Reported - Slovak (%)
Ancestries Reported - Subsaharan African (%)
Ancestries Reported - Swedish (%)
Ancestries Reported - Swiss (%)
Ancestries Reported - Ukrainian (%)
Ancestries Reported - United States (%)
Ancestries Reported - Welsh (%)
Ancestries Reported - West Indian (%)
Ancestries Reported - Other (%)
Geographical mobility - Same house 1 year ago (%)
Geographical mobility - Same house 1 year ago (%) - White
Geographical mobility - Same house 1 year ago (%) - Black or African American
Geographical mobility - Same house 1 year ago (%) - Asian
Geographical mobility - Same house 1 year ago (%) - Hispanic or Latino
Geographical mobility - Same house 1 year ago (%) - American Indian and Alaska Native
Geographical mobility - Same house 1 year ago (%) - Multirace
Geographical mobility - Same house 1 year ago (%) - Other Race
Geographical mobility - Moved within same county (%)
Geographical mobility - Moved within same county (%) - White
Geographical mobility - Moved within same county (%) - Black or African American
Geographical mobility - Moved within same county (%) - Asian
Geographical mobility - Moved within same county (%) - Hispanic or Latino
Geographical mobility - Moved within same county (%) - American Indian and Alaska Native
Geographical mobility - Moved within same county (%) - Multirace
Geographical mobility - Moved within same county (%) - Other Race
Geographical mobility - Moved from different county within same state (%)
Geographical mobility - Moved from different county within same state (%) - White
Geographical mobility - Moved from different county within same state (%) - Black or African American
Geographical mobility - Moved from different county within same state (%) - Asian
Geographical mobility - Moved from different county within same state (%) - Hispanic or Latino
Geographical mobility - Moved from different county within same state (%) - American Indian and Alaska Native
Geographical mobility - Moved from different county within same state (%) - Multirace
Geographical mobility - Moved from different county within same state (%) - Other Race
Geographical mobility - Moved from different state (%)
Geographical mobility - Moved from different state (%) - White
Geographical mobility - Moved from different state (%) - Black or African American
Geographical mobility - Moved from different state (%) - Asian
Geographical mobility - Moved from different state (%) - Hispanic or Latino
Geographical mobility - Moved from different state (%) - American Indian and Alaska Native
Geographical mobility - Moved from different state (%) - Multirace
Geographical mobility - Moved from different state (%) - Other Race
Geographical mobility - Moved from abroad (%)
Geographical mobility - Moved from abroad (%) - White
Geographical mobility - Moved from abroad (%) - Black or African American
Geographical mobility - Moved from abroad (%) - Asian
Geographical mobility - Moved from abroad (%) - Hispanic or Latino
Geographical mobility - Moved from abroad (%) - American Indian and Alaska Native
Geographical mobility - Moved from abroad (%) - Multirace
Geographical mobility - Moved from abroad (%) - Other Race
Place of birth for the foreign-born population - Ireland (%)
Place of birth for the foreign-born population - Denmark (%)
Place of birth for the foreign-born population - Norway (%)
Place of birth for the foreign-born population - Sweden (%)
Place of birth for the foreign-born population - United Kingdom (%)
Place of birth for the foreign-born population - England (%)
Place of birth for the foreign-born population - Scotland (%)
Place of birth for the foreign-born population - Other Northern Europe (%)
Place of birth for the foreign-born population - Austria (%)
Place of birth for the foreign-born population - Belgium (%)
Place of birth for the foreign-born population - France (%)
Place of birth for the foreign-born population - Germany (%)
Place of birth for the foreign-born population - Netherlands (%)
Place of birth for the foreign-born population - Switzerland (%)
Place of birth for the foreign-born population - Other Western Europe (%)
Place of birth for the foreign-born population - Greece (%)
Place of birth for the foreign-born population - Italy (%)
Place of birth for the foreign-born population - Portugal (%)
Place of birth for the foreign-born population - Spain (%)
Place of birth for the foreign-born population - Other Southern Europe (%)
Place of birth for the foreign-born population - Albania (%)
Place of birth for the foreign-born population - Belarus (%)
Place of birth for the foreign-born population - Bosnia and Herzegovina (%)
Place of birth for the foreign-born population - Bulgaria (%)
Place of birth for the foreign-born population - Croatia (%)
Place of birth for the foreign-born population - Czechoslovakia (%)
Place of birth for the foreign-born population - Hungary (%)
Place of birth for the foreign-born population - Latvia (%)
Place of birth for the foreign-born population - Lithuania (%)
Place of birth for the foreign-born population - North Macedonia (Macedonia) (%)
Place of birth for the foreign-born population - Moldova (%)
Place of birth for the foreign-born population - Poland (%)
Place of birth for the foreign-born population - Romania (%)
Place of birth for the foreign-born population - Russia (%)
Place of birth for the foreign-born population - Serbia (%)
Place of birth for the foreign-born population - Ukraine (%)
Place of birth for the foreign-born population - Other Eastern Europe (%)
Place of birth for the foreign-born population - China (%)
Place of birth for the foreign-born population - Hong Kong (%)
Place of birth for the foreign-born population - Taiwan (%)
Place of birth for the foreign-born population - Japan (%)
Place of birth for the foreign-born population - Korea (%)
Place of birth for the foreign-born population - Other Eastern Asia (%)
Place of birth for the foreign-born population - Afghanistan (%)
Place of birth for the foreign-born population - Bangladesh (%)
Place of birth for the foreign-born population - India (%)
Place of birth for the foreign-born population - Iran (%)
Place of birth for the foreign-born population - Kazakhstan (%)
Place of birth for the foreign-born population - Nepal (%)
Place of birth for the foreign-born population - Pakistan (%)
Place of birth for the foreign-born population - Sri Lanka (%)
Place of birth for the foreign-born population - Uzbekistan (%)
Place of birth for the foreign-born population - Other South Central Asia (%)
Place of birth for the foreign-born population - Burma (%)
Place of birth for the foreign-born population - Cambodia (%)
Place of birth for the foreign-born population - Indonesia (%)
Place of birth for the foreign-born population - Laos (%)
Place of birth for the foreign-born population - Malaysia (%)
Place of birth for the foreign-born population - Philippines (%)
Place of birth for the foreign-born population - Singapore (%)
Place of birth for the foreign-born population - Thailand (%)
Place of birth for the foreign-born population - Vietnam (%)
Place of birth for the foreign-born population - Other South Eastern Asia (%)
Place of birth for the foreign-born population - Armenia (%)
Place of birth for the foreign-born population - Iraq (%)
Place of birth for the foreign-born population - Israel (%)
Place of birth for the foreign-born population - Jordan (%)
Place of birth for the foreign-born population - Kuwait (%)
Place of birth for the foreign-born population - Lebanon (%)
Place of birth for the foreign-born population - Saudi Arabia (%)
Place of birth for the foreign-born population - Syria (%)
Place of birth for the foreign-born population - Turkey (%)
Place of birth for the foreign-born population - Yemen (%)
Place of birth for the foreign-born population - Other Western Asia (%)
Place of birth for the foreign-born population - Eritrea (%)
Place of birth for the foreign-born population - Ethiopia (%)
Place of birth for the foreign-born population - Kenya (%)
Place of birth for the foreign-born population - Somalia (%)
Place of birth for the foreign-born population - Uganda (%)
Place of birth for the foreign-born population - Zimbabwe (%)
Place of birth for the foreign-born population - Other Eastern Africa (%)
Place of birth for the foreign-born population - Cameroon (%)
Place of birth for the foreign-born population - Congo (%)
Place of birth for the foreign-born population - Democratic Republic of Congo (Zaire) (%)
Place of birth for the foreign-born population - Other Middle Africa (%)
Place of birth for the foreign-born population - Egypt (%)
Place of birth for the foreign-born population - Morocco (%)
Place of birth for the foreign-born population - Sudan (%)
Place of birth for the foreign-born population - Other Northern Africa (%)
Place of birth for the foreign-born population - South Africa (%)
Place of birth for the foreign-born population - Other Southern Africa (%)
Place of birth for the foreign-born population - Cabo Verde (%)
Place of birth for the foreign-born population - Ghana (%)
Place of birth for the foreign-born population - Liberia (%)
Place of birth for the foreign-born population - Nigeria (%)
Place of birth for the foreign-born population - Senegal (%)
Place of birth for the foreign-born population - Sierra Leone (%)
Place of birth for the foreign-born population - Other Western Africa (%)
Place of birth for the foreign-born population - Australia (%)
Place of birth for the foreign-born population - New Zealand (%)
Place of birth for the foreign-born population - Fiji (%)
Place of birth for the foreign-born population - Micronesia (%)
Place of birth for the foreign-born population - Bahamas (%)
Place of birth for the foreign-born population - Barbados (%)
Place of birth for the foreign-born population - Cuba (%)
Place of birth for the foreign-born population - Dominica (%)
Place of birth for the foreign-born population - Dominican Republic (%)
Place of birth for the foreign-born population - Grenada (%)
Place of birth for the foreign-born population - Haiti (%)
Place of birth for the foreign-born population - Jamaica (%)
Place of birth for the foreign-born population - St. Vincent and the Grenadines (%)
Place of birth for the foreign-born population - Trinidad and Tobago (%)
Place of birth for the foreign-born population - West Indies (%)
Place of birth for the foreign-born population - Other Caribbean (%)
Place of birth for the foreign-born population - Belize (%)
Place of birth for the foreign-born population - Costa Rica (%)
Place of birth for the foreign-born population - El Salvador (%)
Place of birth for the foreign-born population - Guatemala (%)
Place of birth for the foreign-born population - Honduras (%)
Place of birth for the foreign-born population - Mexico (%)
Place of birth for the foreign-born population - Nicaragua (%)
Place of birth for the foreign-born population - Panama (%)
Place of birth for the foreign-born population - Other Central America (%)
Place of birth for the foreign-born population - Argentina (%)
Place of birth for the foreign-born population - Bolivia (%)
Place of birth for the foreign-born population - Brazil (%)
Place of birth for the foreign-born population - Chile (%)
Place of birth for the foreign-born population - Colombia (%)
Place of birth for the foreign-born population - Ecuador (%)
Place of birth for the foreign-born population - Guyana (%)
Place of birth for the foreign-born population - Peru (%)
Place of birth for the foreign-born population - Uruguay (%)
Place of birth for the foreign-born population - Venezuela (%)
Place of birth for the foreign-born population - Other South America (%)
Place of birth for the foreign-born population - Canada (%)
Place of birth for the foreign-born population - Other Northern America (%)
Place of birth for the foreign-born population - Other (%)
Latest news about races in Mankato, MN collected exclusively by city-data.com from local newspapers, TV, and radio stations
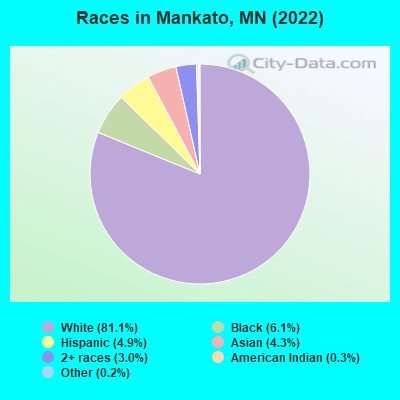
According to 2022 data, the most numerous races in Mankato, MN are White alone (36,380 residents), Black alone (2,725 residents), and Hispanic (2,208 residents). 89.3% of Mankato residents speak English at home. 8.8% of Mankato, MN residents are foreign-born (3.4% born in Africa, 3.4% born in Asia, 0.9% born in Latin America), which is 9.0% greater than the foreign-born rate of 8.0% across the entire state of Minnesota.
Race distribution in Mankato
2000 2022
4,337,143 88.2% White alone 168,813 3.4% Black alone 143,382 2.9% Hispanic 141,083 2.9% Asian alone 70,304 1.4% Two or more races 52,009 1.1% American Indian alone 5,031 0.1% Other race alone 1,714 0.03% Native Hawaiian and Other
4,356,347 76.2% White alone 395,179 6.9% Black alone 333,830 5.8% Hispanic 294,800 5.2% Asian alone 259,649 4.5% Two or more races 42,125 0.7% American Indian alone 32,976 0.6% Other race alone 2,278 0.04% Native Hawaiian and Other
Income and house value in Mankato Median household income in 2022 $62,863 White non-Hispanic householders$32,015 Black householders$66,284 Asian householders$83,932 Two or more races householders$46,526 Hispanic or Latino race householdersMedian 2022 house value $268,170 White Non-Hispanic householders$89,390 Black or African American householders$135,598 American Indian or Alaska Native householders $381,215 Asian householders$335,282 Some other race householders$210,960 Two or more races householders$265,970 Hispanic or Latino householders
Median age by race in Mankato
28.3 Median age for White residents28.3 28.5 21.7 Median age for Black or African American residents22.0 21.5 20.2 Median age for American Indian / Alaska Native residents19.3 20.8 40.6 Median age for Asian residents42.0 33.5 -666,666,666.0 Median age for Native Hawaiian / Pacific Islander residents-666,666,666.0 -666,666,666.0 25.4 Median age for Other race residents25.2 25.6 20.0 Median age for Two or more races residents18.7 19.8 28.8 Median age for White alone residents28.9 28.8 25.0 Median age for Hispanic or Latino residents25.9 22.9
Owner/renter occupied households by race in Mankato
House owners and renters - White residents 8,035 51.6% Owner occupied7,540 48.4% Renter occupiedHouse owners and renters - Black or African American residents 159 10.1% Owner occupied1,414 89.9% Renter occupiedHouse owners and renters - American Indian / Alaska Native residents 1 2.3% Owner occupied45 97.7% Renter occupiedHouse owners and renters - Asian residents 418 66.0% Owner occupied215 34.0% Renter occupiedHouse owners and renters - Other race residents 225 49.4% Owner occupied230 50.6% Renter occupiedHouse owners and renters - Two or more races residents 194 62.2% Owner occupied118 37.8% Renter occupiedHouse owners and renters - White alone residents 8,039 52.8% Owner occupied7,187 47.2% Renter occupiedHouse owners and renters - Hispanic or Latino residents 168 15.9% Owner occupied892 84.1% Renter occupied
Language usage in Mankato
English speakers - Total 89.3% of residents of Mankato speak English at home.
2.6% of residents speak Spanish at home 830 75.6% Speak English very well268 24.4% Speak English less than very well8.0% of residents speak other language at home 2,028 59.4% Speak English very well1,385 40.6% Speak English less than very well
English speakers - Born in the United States 94.0% of residents of Mankato speak English at home.
3.5% of residents speak Spanish at home 299 92.3% Speak English very well25 7.7% Speak English less than very well2.3% of residents speak other language at home 151 70.2% Speak English very well64 29.8% Speak English less than very well
English speakers - Native, born elsewhere 76.8% of residents of Mankato speak English at home.
22.8% of residents speak Spanish at home 9 17.6% Speak English very well42 82.4% Speak English less than very well1.8% of residents speak other language at home 4 100.0% Speak English less than very well
English speakers - Foreign-born 18.5% of residents of Mankato speak English at home.
9.3% of residents speak Spanish at home 178 48.8% Speak English very well187 51.2% Speak English less than very well72.4% of residents speak other language at home 1,562 54.9% Speak English very well1,281 45.1% Speak English less than very well
White (Caucasian) - Speak only English Native:
98.5% (34,119)Foreign-born:
25.9% (218)
White (Caucasian) - Speak another language Native:
1.5% (518)Foreign-born:
73.4% (615)
Black or African American - Speak only English Native:
80.0% (1,014)Foreign-born:
16.4% (282)
Black or African American - Speak another language Native:
20.8% (263)Foreign-born:
83.9% (1,442)
Asian - Speak only English Native:
38.5% (226)Foreign-born:
27.7% (381)
Asian - Speak another language Native:
62.3% (365)Foreign-born:
71.8% (990)
Other race - Speak only English Native:
50.9% (375)Foreign-born:
1.3% (1)
Other race - Speak another language Native:
49.1% (362)Foreign-born:
96.5% (109)
Two or more races - Speak another language Native:
6.9% (96)Foreign-born:
100.0% (230)
White alone - Speak only English Native:
98.9% (33,745)Foreign-born:
29.4% (230)
White alone - Speak another language Native:
1.1% (381)Foreign-born:
70.5% (552)
Hispanic or Latino - Speak only English Native:
61.8% (975)Foreign-born:
3.0% (12)
Hispanic or Latino - Speak another language Native:
38.5% (608)Foreign-born:
94.6% (375)
Foreign-born residents in Mankato 3,941 residents are foreign born (3.4% Africa , 3.4% Asia , 0.9% Latin America ).
This city:
8.8%Minnesota:
8.5%
Marital status for residents in Mankato Marital status - White (Caucasian) population 15 years and over
Males 57.3% Never married34.8% Now married0.4% Separated1.3% Widowed6.1% DivorcedFemales 51.3% Never married32.6% Now married0.4% Separated6.3% Widowed9.4% DivorcedWomen who gave birth in the past 12 months Now married:
74.6% (441)Unmarried:
25.4% (150)
Women who did not give birth in the past 12 months Now married:
22.5% (2,444)Unmarried:
77.5% (8,398)
Marital status - Black or African American population 15 years and over
Males 67.9% Never married29.5% Now married0.0% Separated1.4% Widowed1.3% DivorcedFemales 46.3% Never married38.8% Now married0.0% Separated0.7% Widowed14.2% DivorcedWomen who gave birth in the past 12 months Now married:
90.6% (229)Unmarried:
9.4% (24)
Women who did not give birth in the past 12 months Now married:
16.8% (98)Unmarried:
83.2% (485)
Marital status - American Indian / Alaska Native population 15 years and over
Males 73.2% Never married7.3% Now married7.3% Separated0.0% Widowed12.2% DivorcedFemales 72.2% Never married25.9% Now married0.0% Separated0.0% Widowed1.9% DivorcedWomen who did not give birth in the past 12 months Now married:
0.0% (0)Unmarried:
100.0% (35)
Marital status - Asian population 15 years and over
Males 80.3% Never married19.6% Now married0.1% Separated0.0% Widowed0.0% DivorcedFemales 59.9% Never married27.8% Now married3.4% Separated0.5% Widowed8.5% DivorcedWomen who gave birth in the past 12 months Now married:
100.0% (14)Unmarried:
0.0% (0)
Women who did not give birth in the past 12 months Now married:
12.6% (64)Unmarried:
87.4% (443)
Marital status - Other race population 15 years and over
Males 64.2% Never married16.8% Now married10.8% Separated0.0% Widowed8.2% DivorcedFemales 53.4% Never married19.9% Now married21.9% Separated4.1% Widowed0.7% DivorcedWomen who gave birth in the past 12 months Now married:
0.0% (0)Unmarried:
100.0% (55)
Women who did not give birth in the past 12 months Now married:
38.1% (84)Unmarried:
61.9% (136)
Marital status - Two or more races population 15 years and over
Males 69.1% Never married23.9% Now married1.9% Separated0.0% Widowed5.2% DivorcedFemales 69.3% Never married21.0% Now married0.0% Separated4.4% Widowed5.4% DivorcedWomen who gave birth in the past 12 months Now married:
0.0% (0)Unmarried:
100.0% (34)
Women who did not give birth in the past 12 months Now married:
14.7% (57)Unmarried:
85.3% (333)
Marital status - White alone, not Hispanic / Latino population 15 years and over
Males 57.1% Never married35.1% Now married0.4% Separated1.3% Widowed6.1% DivorcedFemales 50.9% Never married32.7% Now married0.4% Separated6.4% Widowed9.6% DivorcedWomen who gave birth in the past 12 months Now married:
74.6% (442)Unmarried:
25.4% (150)
Women who did not give birth in the past 12 months Now married:
22.5% (2,376)Unmarried:
77.5% (8,207)
Marital status - Hispanic or Latino population 15 years and over
Males 64.4% Never married25.4% Now married3.8% Separated0.7% Widowed5.7% DivorcedFemales 61.7% Never married25.5% Now married9.3% Separated2.5% Widowed1.0% DivorcedWomen who gave birth in the past 12 months Now married:
0.0% (0)Unmarried:
100.0% (45)
Women who did not give birth in the past 12 months Now married:
26.1% (144)Unmarried:
73.9% (407)
Ancestries in Mankato
7,099 32.2% German1,768 8.0% Norwegian1,469 6.7% American976 4.4% Irish820 3.7% English641 2.9% Sudanese467 2.1% Swedish427 1.9% European361 1.6% Somali351 1.6% French316 1.4% African230 1.0% Danish230 1.0% Nigerian208 0.9% Polish170 0.8% Scandinavian119 0.5% Belgian108 0.5% Dutch106 0.5% Czech94 0.4% Italian85 0.4% Ethiopian74 0.3% Scottish73 0.3% Ghanaian67 0.3% Scotch-Irish58 0.3% Russian51 0.2% Northern European47 0.2% Lebanese44 0.2% Liberian43 0.2% Finnish42 0.2% Welsh38 0.2% French Canadian37 0.2% Hungarian37 0.2% Turkish33 0.1% Croatian27 0.1% Eastern European25 0.1% Portuguese24 0.1% Czechoslovakian20 0.09% Syrian19 0.09% Luxembourger18 0.08% Slovene16 0.07% Serbian16 0.07% West Indian15 0.07% Lithuanian13 0.06% Romanian12 0.05% Palestinian10 0.05% Albanian8 0.04% Moroccan8 0.04% Yugoslavian7 0.03% Senegalese7 0.03% Ukrainian
Geographical mobility in Mankato Same house 1 year ago 27,785 76.0% White (Caucasian)1,811 66.5% Black or African American61 59.3% American Indian / Alaska Native994 60.2% Asian35 100.0% Native Hawaiian / Pacific Islander626 71.7% Other race1,073 58.9% Two or more races27,444 76.3% White alone, not Hispanic / Latino1,193 54.2% Hispanic or LatinoMoved within same county 4,694 12.8% White / Caucasian462 17.0% Black or African American263 15.9% Asian71 8.1% Other race216 11.8% Two or more races4,493 12.5% White alone, not Hispanic / Latino218 9.9% Hispanic or LatinoMoved within same state 3,008 8.2% White / Caucasian353 13.0% Black or African American21 20.7% American Indian / Alaska Native161 9.8% Asian143 16.3% Other race217 11.9% Two or more races2,910 8.1% White alone, not Hispanic / Latino334 15.2% Hispanic or LatinoMoved from different state 535 1.5% White / Caucasian90 3.3% Black or African American20 19.1% American Indian / Alaska Native62 3.8% Asian23 2.7% Other race108 5.9% Two or more races535 1.5% White alone, not Hispanic / Latino86 3.9% Hispanic or LatinoMoved from abroad 154 0.4% White383 14.1% Black or African American152 9.2% Asian136 0.4% White alone, not Hispanic / Latino130 5.9% Hispanic or Latino
Children Nativity (place of birth) in Mankato
Children under 6 years - Living with two parents Both parents native 1,458 99.9% Native1 0.1% Foreign-bornBoth parents foreign-born 251 93.4% Native18 6.6% Foreign-bornOne native, one foreign-born parent 124 100.0% NativeChildren under 6 years - Living with one parent Native parent 577 100.0% NativeForeign-born parent 66 100.0% NativeChildren 6 to 17 years - Living with two parents Both parents native 2,218 100.0% NativeBoth parents foreign-born 164 34.4% Native312 65.6% Foreign-bornOne native, one foreign-born parent 142 82.7% Native30 17.3% Foreign-bornChildren 6 to 17 years - Living with one parent Native parent 1,239 100.0% NativeForeign-born parent 305 53.5% Native265 46.5% Foreign-born
Grandparents responsible for own grandchildren in Mankato
Grandparents (30 to 59 years) White / Caucasian 9 100.0% Responsible for grandchildrenBlack or African American 56 87.1% Responsible for grandchildren8 12.9% Not responsible for grandchildrenWhite alone, not Hispanic / Latino 9 100.0% Responsible for grandchildrenGrandparents (60 years and over) White / Caucasian 21 39.4% Responsible for grandchildren32 60.6% Not responsible for grandchildrenBlack or African American 19 100.0% Not responsible for grandchildrenWhite alone, not Hispanic / Latino 21 39.7% Responsible for grandchildren32 60.3% Not responsible for grandchildren