Races in Meadowbrook, Virginia (VA) Detailed Stats
Data:
Races - White alone (%)
Races - White alone (% change since 2000)
Races - Black alone (%)
Races - Black alone (% change since 2000)
Races - American Indian alone (%)
Races - American Indian alone (% change since 2000)
Races - Asian alone (%)
Races - Asian alone (% change since 2000)
Races - Hispanic (%)
Races - Hispanic (% change since 2000)
Races - Native Hawaiian and Other Pacific Islander alone (%)
Races - Native Hawaiian and Other Pacific Islander alone (% change since 2000)
Races - Two or more races(%)
Races - Two or more races(% change since 2000)
Races - Other race alone (%)
Races - Other race alone (% change since 2000)
Racial diversity
Place of birth - Born in state of residence (%)
Place of birth - Born in state of residence (%) - White
Place of birth - Born in state of residence (%) - Black or African American
Place of birth - Born in state of residence (%) - Asian
Place of birth - Born in state of residence (%) - Hispanic or Latino
Place of birth - Born in state of residence (%) - American Indian and Alaska Native
Place of birth - Born in state of residence (%) - Multirace
Place of birth - Born in state of residence (%) - Other Race
Place of birth - Born in other state (%)
Place of birth - Born in other state (%) - White
Place of birth - Born in other state (%) - Black or African American
Place of birth - Born in other state (%) - Asian
Place of birth - Born in other state (%) - Hispanic or Latino
Place of birth - Born in other state (%) - American Indian and Alaska Native
Place of birth - Born in other state (%) - Multirace
Place of birth - Born in other state (%) - Other Race
Place of birth - Native, outside of US (%)
Place of birth - Native, outside of US (%) - White
Place of birth - Native, outside of US (%) - Black or African American
Place of birth - Native, outside of US (%) - Asian
Place of birth - Native, outside of US (%) - Hispanic or Latino
Place of birth - Native, outside of US (%) - American Indian and Alaska Native
Place of birth - Native, outside of US (%) - Multirace
Place of birth - Native, outside of US (%) - Other Race
Place of birth - Foreign born (%)
Place of birth - Foreign born (%) - White
Place of birth - Foreign born (%) - Black or African American
Place of birth - Foreign born (%) - Asian
Place of birth - Foreign born (%) - Hispanic or Latino
Place of birth - Foreign born (%) - American Indian and Alaska Native
Place of birth - Foreign born (%) - Multirace
Place of birth - Foreign born (%) - Other Race
Residents speaking English at home (%)
Residents speaking English at home - Born in the United States (%)
Residents speaking English at home - Native, born elsewhere (%)
Residents speaking English at home - Foreign born (%)
Residents speaking Spanish at home (%)
Residents speaking Spanish at home - Born in the United States (%)
Residents speaking Spanish at home - Native, born elsewhere (%)
Residents speaking Spanish at home - Foreign born (%)
Residents speaking other language at home (%)
Residents speaking other language at home - Born in the United States (%)
Residents speaking other language at home - Native, born elsewhere (%)
Residents speaking other language at home - Foreign born (%)
Marital status - Never married (%)
Marital status - Now married (%)
Marital status - Separated (%)
Marital status - Widowed (%)
Marital status - Divorced (%)
Ancestries Reported - Arab (%)
Ancestries Reported - Czech (%)
Ancestries Reported - Danish (%)
Ancestries Reported - Dutch (%)
Ancestries Reported - English (%)
Ancestries Reported - French (%)
Ancestries Reported - French Canadian (%)
Ancestries Reported - German (%)
Ancestries Reported - Greek (%)
Ancestries Reported - Hungarian (%)
Ancestries Reported - Irish (%)
Ancestries Reported - Italian (%)
Ancestries Reported - Lithuanian (%)
Ancestries Reported - Norwegian (%)
Ancestries Reported - Polish (%)
Ancestries Reported - Portuguese (%)
Ancestries Reported - Russian (%)
Ancestries Reported - Scotch-Irish (%)
Ancestries Reported - Scottish (%)
Ancestries Reported - Slovak (%)
Ancestries Reported - Subsaharan African (%)
Ancestries Reported - Swedish (%)
Ancestries Reported - Swiss (%)
Ancestries Reported - Ukrainian (%)
Ancestries Reported - United States (%)
Ancestries Reported - Welsh (%)
Ancestries Reported - West Indian (%)
Ancestries Reported - Other (%)
Geographical mobility - Same house 1 year ago (%)
Geographical mobility - Same house 1 year ago (%) - White
Geographical mobility - Same house 1 year ago (%) - Black or African American
Geographical mobility - Same house 1 year ago (%) - Asian
Geographical mobility - Same house 1 year ago (%) - Hispanic or Latino
Geographical mobility - Same house 1 year ago (%) - American Indian and Alaska Native
Geographical mobility - Same house 1 year ago (%) - Multirace
Geographical mobility - Same house 1 year ago (%) - Other Race
Geographical mobility - Moved within same county (%)
Geographical mobility - Moved within same county (%) - White
Geographical mobility - Moved within same county (%) - Black or African American
Geographical mobility - Moved within same county (%) - Asian
Geographical mobility - Moved within same county (%) - Hispanic or Latino
Geographical mobility - Moved within same county (%) - American Indian and Alaska Native
Geographical mobility - Moved within same county (%) - Multirace
Geographical mobility - Moved within same county (%) - Other Race
Geographical mobility - Moved from different county within same state (%)
Geographical mobility - Moved from different county within same state (%) - White
Geographical mobility - Moved from different county within same state (%) - Black or African American
Geographical mobility - Moved from different county within same state (%) - Asian
Geographical mobility - Moved from different county within same state (%) - Hispanic or Latino
Geographical mobility - Moved from different county within same state (%) - American Indian and Alaska Native
Geographical mobility - Moved from different county within same state (%) - Multirace
Geographical mobility - Moved from different county within same state (%) - Other Race
Geographical mobility - Moved from different state (%)
Geographical mobility - Moved from different state (%) - White
Geographical mobility - Moved from different state (%) - Black or African American
Geographical mobility - Moved from different state (%) - Asian
Geographical mobility - Moved from different state (%) - Hispanic or Latino
Geographical mobility - Moved from different state (%) - American Indian and Alaska Native
Geographical mobility - Moved from different state (%) - Multirace
Geographical mobility - Moved from different state (%) - Other Race
Geographical mobility - Moved from abroad (%)
Geographical mobility - Moved from abroad (%) - White
Geographical mobility - Moved from abroad (%) - Black or African American
Geographical mobility - Moved from abroad (%) - Asian
Geographical mobility - Moved from abroad (%) - Hispanic or Latino
Geographical mobility - Moved from abroad (%) - American Indian and Alaska Native
Geographical mobility - Moved from abroad (%) - Multirace
Geographical mobility - Moved from abroad (%) - Other Race
Place of birth for the foreign-born population - Ireland (%)
Place of birth for the foreign-born population - Denmark (%)
Place of birth for the foreign-born population - Norway (%)
Place of birth for the foreign-born population - Sweden (%)
Place of birth for the foreign-born population - United Kingdom (%)
Place of birth for the foreign-born population - England (%)
Place of birth for the foreign-born population - Scotland (%)
Place of birth for the foreign-born population - Other Northern Europe (%)
Place of birth for the foreign-born population - Austria (%)
Place of birth for the foreign-born population - Belgium (%)
Place of birth for the foreign-born population - France (%)
Place of birth for the foreign-born population - Germany (%)
Place of birth for the foreign-born population - Netherlands (%)
Place of birth for the foreign-born population - Switzerland (%)
Place of birth for the foreign-born population - Other Western Europe (%)
Place of birth for the foreign-born population - Greece (%)
Place of birth for the foreign-born population - Italy (%)
Place of birth for the foreign-born population - Portugal (%)
Place of birth for the foreign-born population - Spain (%)
Place of birth for the foreign-born population - Other Southern Europe (%)
Place of birth for the foreign-born population - Albania (%)
Place of birth for the foreign-born population - Belarus (%)
Place of birth for the foreign-born population - Bosnia and Herzegovina (%)
Place of birth for the foreign-born population - Bulgaria (%)
Place of birth for the foreign-born population - Croatia (%)
Place of birth for the foreign-born population - Czechoslovakia (%)
Place of birth for the foreign-born population - Hungary (%)
Place of birth for the foreign-born population - Latvia (%)
Place of birth for the foreign-born population - Lithuania (%)
Place of birth for the foreign-born population - North Macedonia (Macedonia) (%)
Place of birth for the foreign-born population - Moldova (%)
Place of birth for the foreign-born population - Poland (%)
Place of birth for the foreign-born population - Romania (%)
Place of birth for the foreign-born population - Russia (%)
Place of birth for the foreign-born population - Serbia (%)
Place of birth for the foreign-born population - Ukraine (%)
Place of birth for the foreign-born population - Other Eastern Europe (%)
Place of birth for the foreign-born population - China (%)
Place of birth for the foreign-born population - Hong Kong (%)
Place of birth for the foreign-born population - Taiwan (%)
Place of birth for the foreign-born population - Japan (%)
Place of birth for the foreign-born population - Korea (%)
Place of birth for the foreign-born population - Other Eastern Asia (%)
Place of birth for the foreign-born population - Afghanistan (%)
Place of birth for the foreign-born population - Bangladesh (%)
Place of birth for the foreign-born population - India (%)
Place of birth for the foreign-born population - Iran (%)
Place of birth for the foreign-born population - Kazakhstan (%)
Place of birth for the foreign-born population - Nepal (%)
Place of birth for the foreign-born population - Pakistan (%)
Place of birth for the foreign-born population - Sri Lanka (%)
Place of birth for the foreign-born population - Uzbekistan (%)
Place of birth for the foreign-born population - Other South Central Asia (%)
Place of birth for the foreign-born population - Burma (%)
Place of birth for the foreign-born population - Cambodia (%)
Place of birth for the foreign-born population - Indonesia (%)
Place of birth for the foreign-born population - Laos (%)
Place of birth for the foreign-born population - Malaysia (%)
Place of birth for the foreign-born population - Philippines (%)
Place of birth for the foreign-born population - Singapore (%)
Place of birth for the foreign-born population - Thailand (%)
Place of birth for the foreign-born population - Vietnam (%)
Place of birth for the foreign-born population - Other South Eastern Asia (%)
Place of birth for the foreign-born population - Armenia (%)
Place of birth for the foreign-born population - Iraq (%)
Place of birth for the foreign-born population - Israel (%)
Place of birth for the foreign-born population - Jordan (%)
Place of birth for the foreign-born population - Kuwait (%)
Place of birth for the foreign-born population - Lebanon (%)
Place of birth for the foreign-born population - Saudi Arabia (%)
Place of birth for the foreign-born population - Syria (%)
Place of birth for the foreign-born population - Turkey (%)
Place of birth for the foreign-born population - Yemen (%)
Place of birth for the foreign-born population - Other Western Asia (%)
Place of birth for the foreign-born population - Eritrea (%)
Place of birth for the foreign-born population - Ethiopia (%)
Place of birth for the foreign-born population - Kenya (%)
Place of birth for the foreign-born population - Somalia (%)
Place of birth for the foreign-born population - Uganda (%)
Place of birth for the foreign-born population - Zimbabwe (%)
Place of birth for the foreign-born population - Other Eastern Africa (%)
Place of birth for the foreign-born population - Cameroon (%)
Place of birth for the foreign-born population - Congo (%)
Place of birth for the foreign-born population - Democratic Republic of Congo (Zaire) (%)
Place of birth for the foreign-born population - Other Middle Africa (%)
Place of birth for the foreign-born population - Egypt (%)
Place of birth for the foreign-born population - Morocco (%)
Place of birth for the foreign-born population - Sudan (%)
Place of birth for the foreign-born population - Other Northern Africa (%)
Place of birth for the foreign-born population - South Africa (%)
Place of birth for the foreign-born population - Other Southern Africa (%)
Place of birth for the foreign-born population - Cabo Verde (%)
Place of birth for the foreign-born population - Ghana (%)
Place of birth for the foreign-born population - Liberia (%)
Place of birth for the foreign-born population - Nigeria (%)
Place of birth for the foreign-born population - Senegal (%)
Place of birth for the foreign-born population - Sierra Leone (%)
Place of birth for the foreign-born population - Other Western Africa (%)
Place of birth for the foreign-born population - Australia (%)
Place of birth for the foreign-born population - New Zealand (%)
Place of birth for the foreign-born population - Fiji (%)
Place of birth for the foreign-born population - Micronesia (%)
Place of birth for the foreign-born population - Bahamas (%)
Place of birth for the foreign-born population - Barbados (%)
Place of birth for the foreign-born population - Cuba (%)
Place of birth for the foreign-born population - Dominica (%)
Place of birth for the foreign-born population - Dominican Republic (%)
Place of birth for the foreign-born population - Grenada (%)
Place of birth for the foreign-born population - Haiti (%)
Place of birth for the foreign-born population - Jamaica (%)
Place of birth for the foreign-born population - St. Vincent and the Grenadines (%)
Place of birth for the foreign-born population - Trinidad and Tobago (%)
Place of birth for the foreign-born population - West Indies (%)
Place of birth for the foreign-born population - Other Caribbean (%)
Place of birth for the foreign-born population - Belize (%)
Place of birth for the foreign-born population - Costa Rica (%)
Place of birth for the foreign-born population - El Salvador (%)
Place of birth for the foreign-born population - Guatemala (%)
Place of birth for the foreign-born population - Honduras (%)
Place of birth for the foreign-born population - Mexico (%)
Place of birth for the foreign-born population - Nicaragua (%)
Place of birth for the foreign-born population - Panama (%)
Place of birth for the foreign-born population - Other Central America (%)
Place of birth for the foreign-born population - Argentina (%)
Place of birth for the foreign-born population - Bolivia (%)
Place of birth for the foreign-born population - Brazil (%)
Place of birth for the foreign-born population - Chile (%)
Place of birth for the foreign-born population - Colombia (%)
Place of birth for the foreign-born population - Ecuador (%)
Place of birth for the foreign-born population - Guyana (%)
Place of birth for the foreign-born population - Peru (%)
Place of birth for the foreign-born population - Uruguay (%)
Place of birth for the foreign-born population - Venezuela (%)
Place of birth for the foreign-born population - Other South America (%)
Place of birth for the foreign-born population - Canada (%)
Place of birth for the foreign-born population - Other Northern America (%)
Place of birth for the foreign-born population - Other (%)
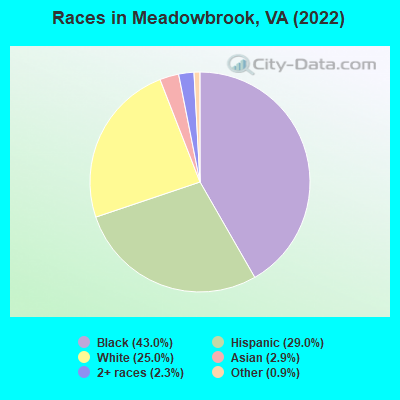
According to 2022 data, the most numerous races in Meadowbrook, VA are White alone (5,176 residents), Black alone (8,915 residents), and Hispanic (6,019 residents). 72.9% of Meadowbrook residents speak English at home.
Race distribution in Meadowbrook 8,915 43.0% Black alone 6,019 29.0% Hispanic 5,176 25.0% White alone 595 2.9% Asian alone 483 2.3% Two or more races 191 0.9% Other race alone 12 0.06% American Indian alone
2000 2022
4,965,637 70.2% White alone 1,376,378 19.4% Black alone 329,540 4.7% Hispanic 259,277 3.7% Asian alone 114,022 1.6% Two or more races 18,596 0.3% American Indian alone 11,685 0.2% Other race alone 3,380 0.05% Native Hawaiian and Other
5,095,130 58.7% White alone 1,594,785 18.4% Black alone 905,750 10.4% Hispanic 602,881 6.9% Asian alone 406,047 4.7% Two or more races 60,419 0.7% Other race alone 11,738 0.1% American Indian alone 6,869 0.08% Native Hawaiian and Other
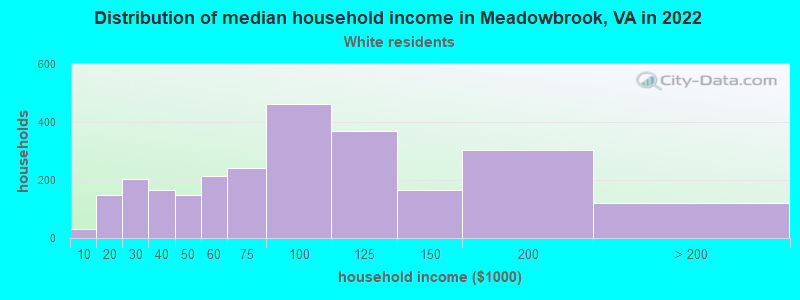
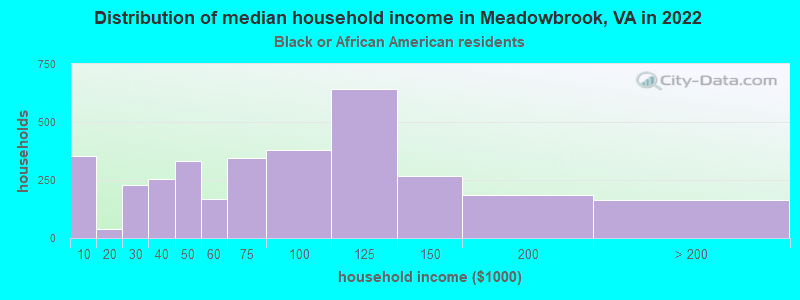
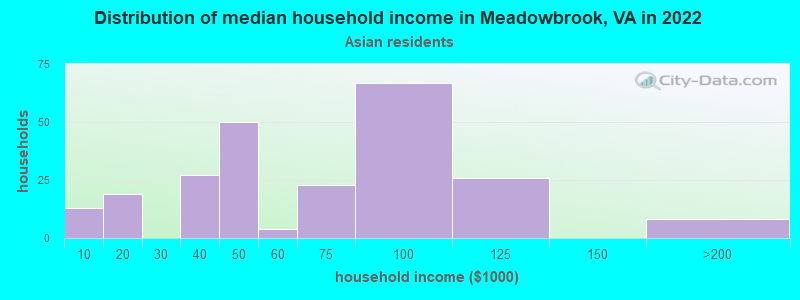
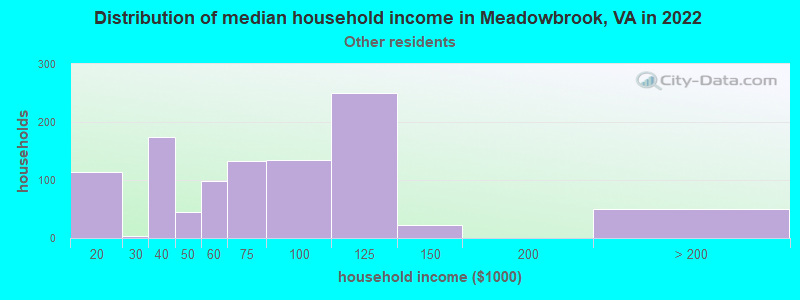
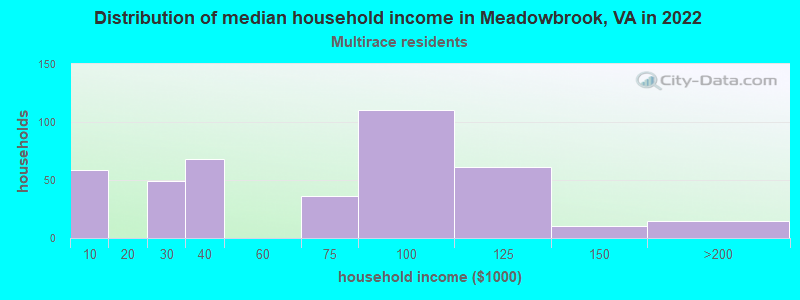
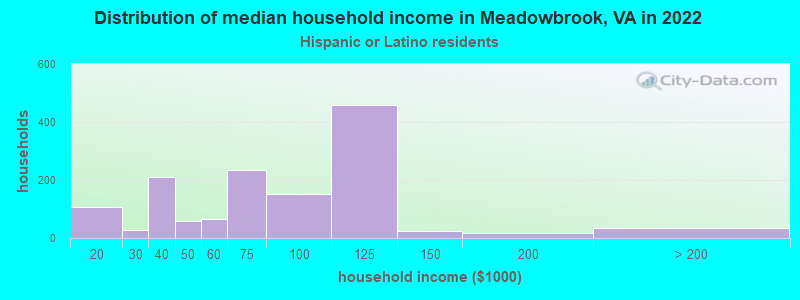
Income and house value in Meadowbrook Median household income in 2022 $84,273 White non-Hispanic householders$75,167 Black householders$61,329 Asian householders$63,185 Some other race householders$65,108 Two or more races householders$75,272 Hispanic or Latino race householders
Median age by race in Meadowbrook
52.8 Median age for White residents50.1 55.2 38.7 Median age for Black or African American residents40.4 38.4 -682,215,742.8 Median age for American Indian / Alaska Native residents-682,352,940.5 -687,861,271.0 33.3 Median age for Asian residents35.5 29.0 -611,955,419.9 Median age for Native Hawaiian / Pacific Islander residents-541,531,822.5 -714,150,046.8 23.0 Median age for Other race residents20.7 26.4 32.0 Median age for Two or more races residents33.7 29.4 57.4 Median age for White alone residents54.5 58.6 25.1 Median age for Hispanic or Latino residents25.6 25.8
Owner/renter occupied households by race in Meadowbrook
House owners and renters - White residents 2,313 86.9% Owner occupied349 13.1% Renter occupiedHouse owners and renters - Black or African American residents 2,527 74.9% Owner occupied848 25.1% Renter occupiedHouse owners and renters - Asian residents 161 76.0% Owner occupied51 24.0% Renter occupiedHouse owners and renters - Other race residents 404 44.1% Owner occupied512 55.9% Renter occupiedHouse owners and renters - Two or more races residents 299 67.2% Owner occupied146 32.8% Renter occupiedHouse owners and renters - White alone residents 2,256 90.4% Owner occupied239 9.6% Renter occupiedHouse owners and renters - Hispanic or Latino residents 551 45.9% Owner occupied650 54.1% Renter occupied
Language usage in Meadowbrook
English speakers - Total 72.9% of residents of Meadowbrook speak English at home.
19.5% of residents speak Spanish at home 1,715 45.5% Speak English very well2,051 54.5% Speak English less than very well6.3% of residents speak other language at home 578 47.3% Speak English very well644 52.7% Speak English less than very well
English speakers - Born in the United States 86.7% of residents of Meadowbrook speak English at home.
10.9% of residents speak Spanish at home 426 81.0% Speak English very well100 19.0% Speak English less than very well3.1% of residents speak other language at home 112 73.7% Speak English very well40 26.3% Speak English less than very well
English speakers - Native, born elsewhere 49.2% of residents of Meadowbrook speak English at home.
42.7% of residents speak Spanish at home 121 66.1% Speak English very well62 33.9% Speak English less than very well
English speakers - Foreign-born 11.2% of residents of Meadowbrook speak English at home.
57.1% of residents speak Spanish at home 685 31.0% Speak English very well1,526 69.0% Speak English less than very well23.5% of residents speak other language at home 404 44.4% Speak English very well506 55.6% Speak English less than very well
White (Caucasian) - Speak only English Native:
91.3% (4,616)Foreign-born:
13.6% (69)
White (Caucasian) - Speak another language Native:
7.0% (353)Foreign-born:
75.9% (387)
Black or African American - Speak only English Native:
97.4% (8,088)Foreign-born:
23.4% (90)
Black or African American - Speak another language Native:
2.3% (191)Foreign-born:
77.1% (296)
American Indian / Alaska Native - Speak only English Native:
100.0% (12)Foreign-born:
34.5% (2)
Asian - Speak only English Native:
62.4% (77)Foreign-born:
10.5% (49)
Asian - Speak another language Native:
37.8% (47)Foreign-born:
89.9% (417)
Other race - Speak only English Native:
26.9% (386)Foreign-born:
17.8% (367)
Other race - Speak another language Native:
70.1% (1,005)Foreign-born:
85.4% (1,767)
Two or more races - Speak another language Native:
26.1% (268)Foreign-born:
98.5% (290)
White alone - Speak only English Native:
96.1% (4,577)Foreign-born:
18.2% (51)
White alone - Speak another language Native:
4.0% (189)Foreign-born:
76.0% (213)
Hispanic or Latino - Speak only English Native:
42.9% (1,039)Foreign-born:
7.6% (189)
Hispanic or Latino - Speak another language Native:
50.3% (1,217)Foreign-born:
93.1% (2,296)
Foreign-born residents in Meadowbrook
Marital status for residents in Meadowbrook Marital status - White (Caucasian) population 15 years and over
Males 21.8% Never married60.1% Now married1.8% Separated5.9% Widowed10.4% DivorcedFemales 18.3% Never married52.2% Now married1.6% Separated13.8% Widowed14.0% DivorcedWomen who gave birth in the past 12 months Now married:
100.0% (49)Unmarried:
0.0% (0)
Women who did not give birth in the past 12 months Now married:
38.7% (419)Unmarried:
61.3% (664)
Marital status - Black or African American population 15 years and over
Males 37.5% Never married45.9% Now married4.4% Separated2.7% Widowed9.5% DivorcedFemales 34.6% Never married40.2% Now married1.1% Separated8.1% Widowed16.0% DivorcedWomen who gave birth in the past 12 months Now married:
72.0% (19)Unmarried:
28.0% (7)
Women who did not give birth in the past 12 months Now married:
36.4% (821)Unmarried:
63.6% (1,437)
Marital status - Asian population 15 years and over
Males 32.9% Never married57.6% Now married5.3% Separated4.2% Widowed0.0% DivorcedFemales 15.6% Never married61.3% Now married0.0% Separated10.6% Widowed12.6% DivorcedWomen who did not give birth in the past 12 months Now married:
75.8% (98)Unmarried:
24.2% (31)
Marital status - Other race population 15 years and over
Males 44.9% Never married49.5% Now married0.0% Separated0.0% Widowed5.6% DivorcedFemales 44.9% Never married45.9% Now married1.3% Separated0.0% Widowed7.9% DivorcedWomen who gave birth in the past 12 months Now married:
100.0% (151)Unmarried:
0.0% (0)
Women who did not give birth in the past 12 months Now married:
33.9% (354)Unmarried:
66.1% (692)
Marital status - Two or more races population 15 years and over
Males 57.6% Never married22.2% Now married0.0% Separated14.8% Widowed5.4% DivorcedFemales 43.7% Never married30.3% Now married4.3% Separated18.0% Widowed3.7% DivorcedWomen who gave birth in the past 12 months Now married:
100.0% (45)Unmarried:
0.0% (0)
Women who did not give birth in the past 12 months Now married:
33.1% (123)Unmarried:
66.9% (249)
Marital status - White alone, not Hispanic / Latino population 15 years and over
Males 19.9% Never married60.4% Now married2.0% Separated6.1% Widowed11.6% DivorcedFemales 14.9% Never married53.0% Now married1.8% Separated15.3% Widowed15.0% DivorcedWomen who gave birth in the past 12 months Now married:
100.0% (50)Unmarried:
0.0% (0)
Women who did not give birth in the past 12 months Now married:
39.7% (337)Unmarried:
60.3% (511)
Marital status - Hispanic or Latino population 15 years and over
Males 43.2% Never married47.8% Now married0.0% Separated4.3% Widowed4.6% DivorcedFemales 42.9% Never married46.3% Now married0.9% Separated1.1% Widowed8.9% DivorcedWomen who gave birth in the past 12 months Now married:
100.0% (204)Unmarried:
0.0% (0)
Women who did not give birth in the past 12 months Now married:
38.0% (650)Unmarried:
62.0% (1,059)
Ancestries in Meadowbrook
815 6.2% American411 3.1% English366 2.8% Irish218 1.7% African203 1.5% Sierra Leonean170 1.3% European160 1.2% German157 1.2% Arab83 0.6% Italian70 0.5% Scottish32 0.2% Romanian30 0.2% Jamaican28 0.2% Yugoslavian27 0.2% West Indian26 0.2% Belgian23 0.2% Nigerian21 0.2% Scotch-Irish17 0.1% Scandinavian17 0.1% Slovak16 0.1% Eastern European13 0.10% Dutch12 0.09% Polish11 0.08% Estonian10 0.08% Liberian9 0.07% Finnish8 0.06% French8 0.06% Russian5 0.04% Latvian5 0.04% Welsh3 0.02% Croatian
Geographical mobility in Meadowbrook Same house 1 year ago 5,555 94.7% White (Caucasian)8,181 89.4% Black or African American16 96.1% American Indian / Alaska Native547 98.4% Asian4,344 89.2% Other race1,203 83.7% Two or more races4,862 94.7% White alone, not Hispanic / Latino5,188 89.7% Hispanic or LatinoMoved within same county 67 1.1% White / Caucasian516 5.6% Black or African American2 0.4% Asian95 1.9% Other race139 9.6% Two or more races68 1.3% White alone, not Hispanic / Latino139 2.4% Hispanic or LatinoMoved within same state 183 3.1% White / Caucasian318 3.5% Black or African American183 3.8% Other race44 3.1% Two or more races168 3.3% White alone, not Hispanic / Latino240 4.1% Hispanic or LatinoMoved from different state 37 0.6% White / Caucasian25 0.3% Black or African American78 1.6% Other race40 0.8% White alone, not Hispanic / Latino31 0.5% Hispanic or LatinoMoved from abroad 25 0.4% White94 1.0% Black or African American217 4.5% Other race10 0.2% White alone, not Hispanic / Latino323 5.6% Hispanic or Latino
Children Nativity (place of birth) in Meadowbrook
Children under 6 years - Living with two parents Both parents native 226 100.0% NativeBoth parents foreign-born 493 100.0% NativeOne native, one foreign-born parent 9 100.0% NativeChildren under 6 years - Living with one parent Native parent 331 100.0% NativeForeign-born parent 628 95.9% Native27 4.1% Foreign-bornChildren 6 to 17 years - Living with two parents Both parents native 799 100.0% NativeBoth parents foreign-born 578 77.1% Native172 22.9% Foreign-bornOne native, one foreign-born parent 213 78.0% Native60 22.0% Foreign-bornChildren 6 to 17 years - Living with one parent Native parent 843 100.0% NativeForeign-born parent 337 55.6% Native269 44.4% Foreign-born
Grandparents responsible for own grandchildren in Meadowbrook
Grandparents (30 to 59 years) White / Caucasian 17 43.1% Responsible for grandchildren22 56.9% Not responsible for grandchildrenBlack or African American 14 25.8% Responsible for grandchildren41 74.2% Not responsible for grandchildrenOther race 143 100.0% Not responsible for grandchildrenTwo or more races 51 100.0% Not responsible for grandchildrenWhite alone, not Hispanic / Latino 17 41.3% Responsible for grandchildren24 58.7% Not responsible for grandchildrenHispanic or Latino 102 100.0% Not responsible for grandchildrenGrandparents (60 years and over) White / Caucasian 12 61.3% Responsible for grandchildren8 38.7% Not responsible for grandchildrenBlack or African American 50 24.7% Responsible for grandchildren151 75.3% Not responsible for grandchildrenOther race 44 100.0% Not responsible for grandchildrenWhite alone, not Hispanic / Latino 9 52.3% Responsible for grandchildren8 47.7% Not responsible for grandchildrenHispanic or Latino 32 100.0% Not responsible for grandchildren