Races in Mililani Town, Hawaii (HI) Detailed Stats
Data:
Races - White alone (%)
Races - White alone (% change since 2000)
Races - Black alone (%)
Races - Black alone (% change since 2000)
Races - American Indian alone (%)
Races - American Indian alone (% change since 2000)
Races - Asian alone (%)
Races - Asian alone (% change since 2000)
Races - Hispanic (%)
Races - Hispanic (% change since 2000)
Races - Native Hawaiian and Other Pacific Islander alone (%)
Races - Native Hawaiian and Other Pacific Islander alone (% change since 2000)
Races - Two or more races(%)
Races - Two or more races(% change since 2000)
Races - Other race alone (%)
Races - Other race alone (% change since 2000)
Racial diversity
Place of birth - Born in state of residence (%)
Place of birth - Born in state of residence (%) - White
Place of birth - Born in state of residence (%) - Black or African American
Place of birth - Born in state of residence (%) - Asian
Place of birth - Born in state of residence (%) - Hispanic or Latino
Place of birth - Born in state of residence (%) - American Indian and Alaska Native
Place of birth - Born in state of residence (%) - Multirace
Place of birth - Born in state of residence (%) - Other Race
Place of birth - Born in other state (%)
Place of birth - Born in other state (%) - White
Place of birth - Born in other state (%) - Black or African American
Place of birth - Born in other state (%) - Asian
Place of birth - Born in other state (%) - Hispanic or Latino
Place of birth - Born in other state (%) - American Indian and Alaska Native
Place of birth - Born in other state (%) - Multirace
Place of birth - Born in other state (%) - Other Race
Place of birth - Native, outside of US (%)
Place of birth - Native, outside of US (%) - White
Place of birth - Native, outside of US (%) - Black or African American
Place of birth - Native, outside of US (%) - Asian
Place of birth - Native, outside of US (%) - Hispanic or Latino
Place of birth - Native, outside of US (%) - American Indian and Alaska Native
Place of birth - Native, outside of US (%) - Multirace
Place of birth - Native, outside of US (%) - Other Race
Place of birth - Foreign born (%)
Place of birth - Foreign born (%) - White
Place of birth - Foreign born (%) - Black or African American
Place of birth - Foreign born (%) - Asian
Place of birth - Foreign born (%) - Hispanic or Latino
Place of birth - Foreign born (%) - American Indian and Alaska Native
Place of birth - Foreign born (%) - Multirace
Place of birth - Foreign born (%) - Other Race
Residents speaking English at home (%)
Residents speaking English at home - Born in the United States (%)
Residents speaking English at home - Native, born elsewhere (%)
Residents speaking English at home - Foreign born (%)
Residents speaking Spanish at home (%)
Residents speaking Spanish at home - Born in the United States (%)
Residents speaking Spanish at home - Native, born elsewhere (%)
Residents speaking Spanish at home - Foreign born (%)
Residents speaking other language at home (%)
Residents speaking other language at home - Born in the United States (%)
Residents speaking other language at home - Native, born elsewhere (%)
Residents speaking other language at home - Foreign born (%)
Marital status - Never married (%)
Marital status - Now married (%)
Marital status - Separated (%)
Marital status - Widowed (%)
Marital status - Divorced (%)
Ancestries Reported - Arab (%)
Ancestries Reported - Czech (%)
Ancestries Reported - Danish (%)
Ancestries Reported - Dutch (%)
Ancestries Reported - English (%)
Ancestries Reported - French (%)
Ancestries Reported - French Canadian (%)
Ancestries Reported - German (%)
Ancestries Reported - Greek (%)
Ancestries Reported - Hungarian (%)
Ancestries Reported - Irish (%)
Ancestries Reported - Italian (%)
Ancestries Reported - Lithuanian (%)
Ancestries Reported - Norwegian (%)
Ancestries Reported - Polish (%)
Ancestries Reported - Portuguese (%)
Ancestries Reported - Russian (%)
Ancestries Reported - Scotch-Irish (%)
Ancestries Reported - Scottish (%)
Ancestries Reported - Slovak (%)
Ancestries Reported - Subsaharan African (%)
Ancestries Reported - Swedish (%)
Ancestries Reported - Swiss (%)
Ancestries Reported - Ukrainian (%)
Ancestries Reported - United States (%)
Ancestries Reported - Welsh (%)
Ancestries Reported - West Indian (%)
Ancestries Reported - Other (%)
Geographical mobility - Same house 1 year ago (%)
Geographical mobility - Same house 1 year ago (%) - White
Geographical mobility - Same house 1 year ago (%) - Black or African American
Geographical mobility - Same house 1 year ago (%) - Asian
Geographical mobility - Same house 1 year ago (%) - Hispanic or Latino
Geographical mobility - Same house 1 year ago (%) - American Indian and Alaska Native
Geographical mobility - Same house 1 year ago (%) - Multirace
Geographical mobility - Same house 1 year ago (%) - Other Race
Geographical mobility - Moved within same county (%)
Geographical mobility - Moved within same county (%) - White
Geographical mobility - Moved within same county (%) - Black or African American
Geographical mobility - Moved within same county (%) - Asian
Geographical mobility - Moved within same county (%) - Hispanic or Latino
Geographical mobility - Moved within same county (%) - American Indian and Alaska Native
Geographical mobility - Moved within same county (%) - Multirace
Geographical mobility - Moved within same county (%) - Other Race
Geographical mobility - Moved from different county within same state (%)
Geographical mobility - Moved from different county within same state (%) - White
Geographical mobility - Moved from different county within same state (%) - Black or African American
Geographical mobility - Moved from different county within same state (%) - Asian
Geographical mobility - Moved from different county within same state (%) - Hispanic or Latino
Geographical mobility - Moved from different county within same state (%) - American Indian and Alaska Native
Geographical mobility - Moved from different county within same state (%) - Multirace
Geographical mobility - Moved from different county within same state (%) - Other Race
Geographical mobility - Moved from different state (%)
Geographical mobility - Moved from different state (%) - White
Geographical mobility - Moved from different state (%) - Black or African American
Geographical mobility - Moved from different state (%) - Asian
Geographical mobility - Moved from different state (%) - Hispanic or Latino
Geographical mobility - Moved from different state (%) - American Indian and Alaska Native
Geographical mobility - Moved from different state (%) - Multirace
Geographical mobility - Moved from different state (%) - Other Race
Geographical mobility - Moved from abroad (%)
Geographical mobility - Moved from abroad (%) - White
Geographical mobility - Moved from abroad (%) - Black or African American
Geographical mobility - Moved from abroad (%) - Asian
Geographical mobility - Moved from abroad (%) - Hispanic or Latino
Geographical mobility - Moved from abroad (%) - American Indian and Alaska Native
Geographical mobility - Moved from abroad (%) - Multirace
Geographical mobility - Moved from abroad (%) - Other Race
Place of birth for the foreign-born population - Ireland (%)
Place of birth for the foreign-born population - Denmark (%)
Place of birth for the foreign-born population - Norway (%)
Place of birth for the foreign-born population - Sweden (%)
Place of birth for the foreign-born population - United Kingdom (%)
Place of birth for the foreign-born population - England (%)
Place of birth for the foreign-born population - Scotland (%)
Place of birth for the foreign-born population - Other Northern Europe (%)
Place of birth for the foreign-born population - Austria (%)
Place of birth for the foreign-born population - Belgium (%)
Place of birth for the foreign-born population - France (%)
Place of birth for the foreign-born population - Germany (%)
Place of birth for the foreign-born population - Netherlands (%)
Place of birth for the foreign-born population - Switzerland (%)
Place of birth for the foreign-born population - Other Western Europe (%)
Place of birth for the foreign-born population - Greece (%)
Place of birth for the foreign-born population - Italy (%)
Place of birth for the foreign-born population - Portugal (%)
Place of birth for the foreign-born population - Spain (%)
Place of birth for the foreign-born population - Other Southern Europe (%)
Place of birth for the foreign-born population - Albania (%)
Place of birth for the foreign-born population - Belarus (%)
Place of birth for the foreign-born population - Bosnia and Herzegovina (%)
Place of birth for the foreign-born population - Bulgaria (%)
Place of birth for the foreign-born population - Croatia (%)
Place of birth for the foreign-born population - Czechoslovakia (%)
Place of birth for the foreign-born population - Hungary (%)
Place of birth for the foreign-born population - Latvia (%)
Place of birth for the foreign-born population - Lithuania (%)
Place of birth for the foreign-born population - North Macedonia (Macedonia) (%)
Place of birth for the foreign-born population - Moldova (%)
Place of birth for the foreign-born population - Poland (%)
Place of birth for the foreign-born population - Romania (%)
Place of birth for the foreign-born population - Russia (%)
Place of birth for the foreign-born population - Serbia (%)
Place of birth for the foreign-born population - Ukraine (%)
Place of birth for the foreign-born population - Other Eastern Europe (%)
Place of birth for the foreign-born population - China (%)
Place of birth for the foreign-born population - Hong Kong (%)
Place of birth for the foreign-born population - Taiwan (%)
Place of birth for the foreign-born population - Japan (%)
Place of birth for the foreign-born population - Korea (%)
Place of birth for the foreign-born population - Other Eastern Asia (%)
Place of birth for the foreign-born population - Afghanistan (%)
Place of birth for the foreign-born population - Bangladesh (%)
Place of birth for the foreign-born population - India (%)
Place of birth for the foreign-born population - Iran (%)
Place of birth for the foreign-born population - Kazakhstan (%)
Place of birth for the foreign-born population - Nepal (%)
Place of birth for the foreign-born population - Pakistan (%)
Place of birth for the foreign-born population - Sri Lanka (%)
Place of birth for the foreign-born population - Uzbekistan (%)
Place of birth for the foreign-born population - Other South Central Asia (%)
Place of birth for the foreign-born population - Burma (%)
Place of birth for the foreign-born population - Cambodia (%)
Place of birth for the foreign-born population - Indonesia (%)
Place of birth for the foreign-born population - Laos (%)
Place of birth for the foreign-born population - Malaysia (%)
Place of birth for the foreign-born population - Philippines (%)
Place of birth for the foreign-born population - Singapore (%)
Place of birth for the foreign-born population - Thailand (%)
Place of birth for the foreign-born population - Vietnam (%)
Place of birth for the foreign-born population - Other South Eastern Asia (%)
Place of birth for the foreign-born population - Armenia (%)
Place of birth for the foreign-born population - Iraq (%)
Place of birth for the foreign-born population - Israel (%)
Place of birth for the foreign-born population - Jordan (%)
Place of birth for the foreign-born population - Kuwait (%)
Place of birth for the foreign-born population - Lebanon (%)
Place of birth for the foreign-born population - Saudi Arabia (%)
Place of birth for the foreign-born population - Syria (%)
Place of birth for the foreign-born population - Turkey (%)
Place of birth for the foreign-born population - Yemen (%)
Place of birth for the foreign-born population - Other Western Asia (%)
Place of birth for the foreign-born population - Eritrea (%)
Place of birth for the foreign-born population - Ethiopia (%)
Place of birth for the foreign-born population - Kenya (%)
Place of birth for the foreign-born population - Somalia (%)
Place of birth for the foreign-born population - Uganda (%)
Place of birth for the foreign-born population - Zimbabwe (%)
Place of birth for the foreign-born population - Other Eastern Africa (%)
Place of birth for the foreign-born population - Cameroon (%)
Place of birth for the foreign-born population - Congo (%)
Place of birth for the foreign-born population - Democratic Republic of Congo (Zaire) (%)
Place of birth for the foreign-born population - Other Middle Africa (%)
Place of birth for the foreign-born population - Egypt (%)
Place of birth for the foreign-born population - Morocco (%)
Place of birth for the foreign-born population - Sudan (%)
Place of birth for the foreign-born population - Other Northern Africa (%)
Place of birth for the foreign-born population - South Africa (%)
Place of birth for the foreign-born population - Other Southern Africa (%)
Place of birth for the foreign-born population - Cabo Verde (%)
Place of birth for the foreign-born population - Ghana (%)
Place of birth for the foreign-born population - Liberia (%)
Place of birth for the foreign-born population - Nigeria (%)
Place of birth for the foreign-born population - Senegal (%)
Place of birth for the foreign-born population - Sierra Leone (%)
Place of birth for the foreign-born population - Other Western Africa (%)
Place of birth for the foreign-born population - Australia (%)
Place of birth for the foreign-born population - New Zealand (%)
Place of birth for the foreign-born population - Fiji (%)
Place of birth for the foreign-born population - Micronesia (%)
Place of birth for the foreign-born population - Bahamas (%)
Place of birth for the foreign-born population - Barbados (%)
Place of birth for the foreign-born population - Cuba (%)
Place of birth for the foreign-born population - Dominica (%)
Place of birth for the foreign-born population - Dominican Republic (%)
Place of birth for the foreign-born population - Grenada (%)
Place of birth for the foreign-born population - Haiti (%)
Place of birth for the foreign-born population - Jamaica (%)
Place of birth for the foreign-born population - St. Vincent and the Grenadines (%)
Place of birth for the foreign-born population - Trinidad and Tobago (%)
Place of birth for the foreign-born population - West Indies (%)
Place of birth for the foreign-born population - Other Caribbean (%)
Place of birth for the foreign-born population - Belize (%)
Place of birth for the foreign-born population - Costa Rica (%)
Place of birth for the foreign-born population - El Salvador (%)
Place of birth for the foreign-born population - Guatemala (%)
Place of birth for the foreign-born population - Honduras (%)
Place of birth for the foreign-born population - Mexico (%)
Place of birth for the foreign-born population - Nicaragua (%)
Place of birth for the foreign-born population - Panama (%)
Place of birth for the foreign-born population - Other Central America (%)
Place of birth for the foreign-born population - Argentina (%)
Place of birth for the foreign-born population - Bolivia (%)
Place of birth for the foreign-born population - Brazil (%)
Place of birth for the foreign-born population - Chile (%)
Place of birth for the foreign-born population - Colombia (%)
Place of birth for the foreign-born population - Ecuador (%)
Place of birth for the foreign-born population - Guyana (%)
Place of birth for the foreign-born population - Peru (%)
Place of birth for the foreign-born population - Uruguay (%)
Place of birth for the foreign-born population - Venezuela (%)
Place of birth for the foreign-born population - Other South America (%)
Place of birth for the foreign-born population - Canada (%)
Place of birth for the foreign-born population - Other Northern America (%)
Place of birth for the foreign-born population - Other (%)
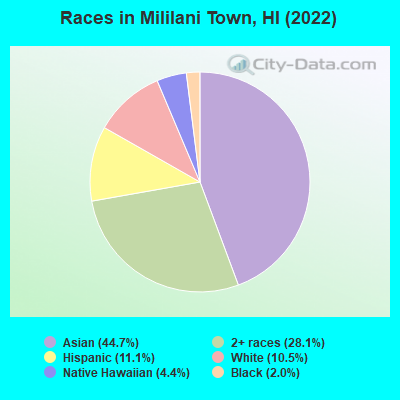
According to 2022 data, the most numerous races in Mililani Town, HI are Asian alone (12,094 residents), Two or more races (7,602 residents), and White alone (2,849 residents). 88.6% of Mililani Town residents speak English at home. 10.8% of Mililani Town, HI residents are foreign-born (8.2% born in Asia), which is 66.0% less than the foreign-born rate of 18.0% across the entire state of Hawaii.
Race distribution in Mililani Town
2000 2022
13,149 46.0% Asian alone 5,588 19.5% Two or more races 5,483 19.2% White alone 2,222 7.8% Hispanic 1,241 4.3% Native Hawaiian and Other 832 2.9% Black alone 63 0.2% Other race alone 30 0.1% American Indian alone
12,094 44.7% Asian alone 7,602 28.1% Two or more races 3,004 11.1% Hispanic 2,849 10.5% White alone 1,197 4.4% Native Hawaiian and Other 540 2.0% Black alone 12 0.04% Other race alone
2000 2022
494,149 40.8% Asian alone 277,091 22.9% White alone 218,700 18.1% Two or more races 108,441 9.0% Native Hawaiian and Other 87,699 7.2% Hispanic 20,829 1.7% Black alone 2,089 0.2% Other race alone 2,539 0.2% American Indian alone
498,125 34.6% Asian alone 318,574 22.1% Two or more races 297,937 20.7% White alone 160,103 11.1% Hispanic 134,567 9.3% Native Hawaiian and Other 23,682 1.6% Black alone 5,378 0.4% Other race alone 1,830 0.1% American Indian alone
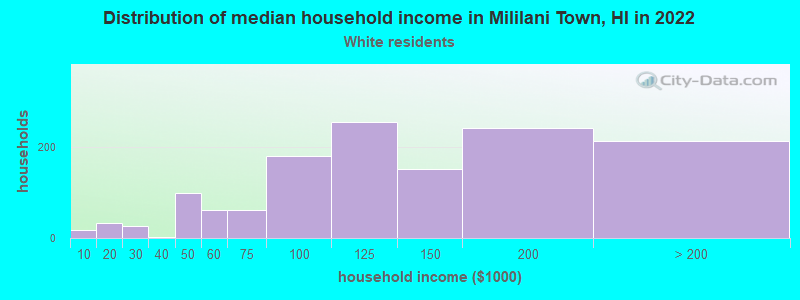
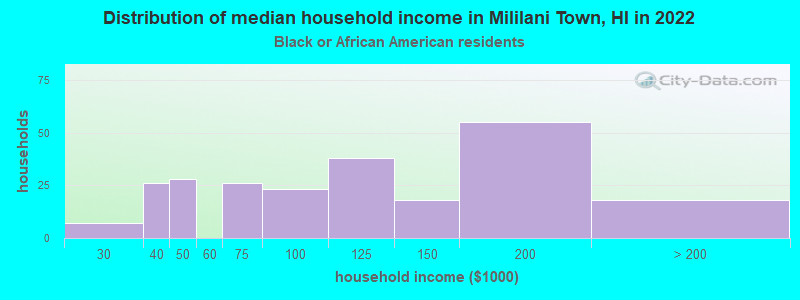
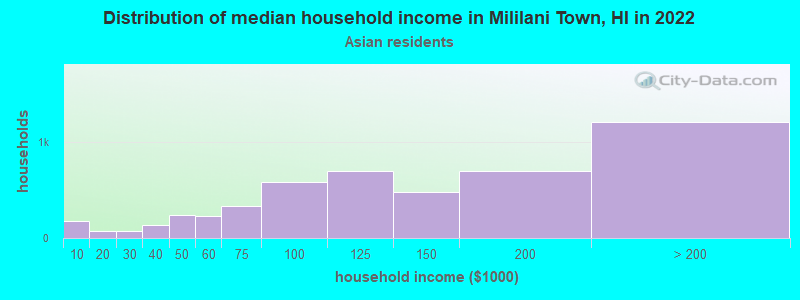
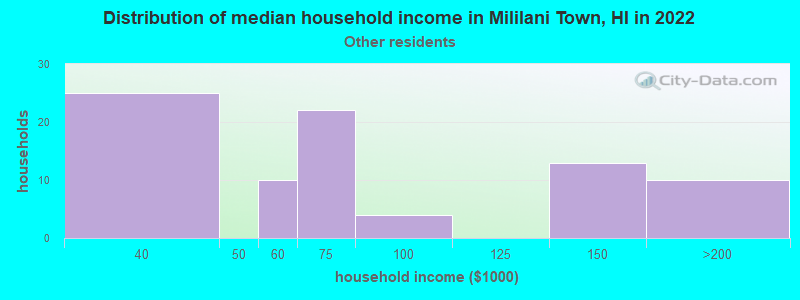
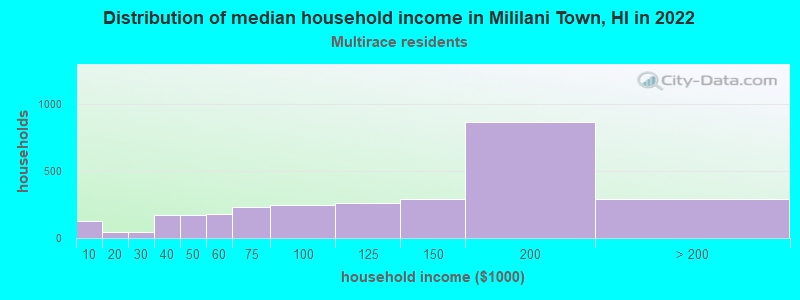
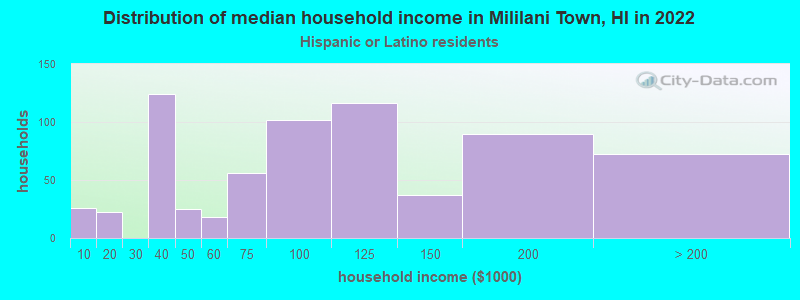
Income and house value in Mililani Town Median household income in 2022 $122,222 White non-Hispanic householders$87,611 Black householders$121,821 Asian householders$84,220 Native Hawaiian and other Pacific Islander householders$120,365 Two or more races householders$84,013 Hispanic or Latino race householdersMedian 2022 house value $915,657 White Non-Hispanic householders$856,088 Black or African American householders $951,738 Asian householders$936,080 Native Hawaiian and other Pacific Islander householdersover $1,000,000 Some other race householders$944,930 Two or more races householders$928,592 Hispanic or Latino householders
Median age by race in Mililani Town
53.8 Median age for White residents53.9 53.4 44.6 Median age for Black or African American residents44.2 45.3 -693,430,656.2 Median age for American Indian / Alaska Native residents-715,953,306.7 -629,508,196.1 56.8 Median age for Asian residents52.9 59.8 41.1 Median age for Native Hawaiian / Pacific Islander residents27.2 46.5 33.4 Median age for Other race residents33.8 40.9 32.0 Median age for Two or more races residents33.4 31.7 55.2 Median age for White alone residents55.3 55.2 26.7 Median age for Hispanic or Latino residents26.5 28.4
Owner/renter occupied households by race in Mililani Town
House owners and renters - White residents 1,115 82.0% Owner occupied245 18.0% Renter occupiedHouse owners and renters - Black or African American residents 142 54.4% Owner occupied119 45.6% Renter occupiedHouse owners and renters - American Indian / Alaska Native residents 10 100.0% Owner occupiedHouse owners and renters - Asian residents 4,508 90.6% Owner occupied469 9.4% Renter occupiedHouse owners and renters - Native Hawaiian / Pacific Islander residents 222 55.4% Owner occupied178 44.6% Renter occupiedHouse owners and renters - Other race residents 47 44.0% Owner occupied59 56.0% Renter occupiedHouse owners and renters - Two or more races residents 2,133 73.1% Owner occupied784 26.9% Renter occupiedHouse owners and renters - White alone residents 1,056 81.6% Owner occupied238 18.4% Renter occupiedHouse owners and renters - Hispanic or Latino residents 448 65.8% Owner occupied233 34.2% Renter occupied
Language usage in Mililani Town
English speakers - Total 88.6% of residents of Mililani Town speak English at home.
0.9% of residents speak Spanish at home 200 82.6% Speak English very well42 17.4% Speak English less than very well11.3% of residents speak other language at home 2,034 69.9% Speak English very well874 30.1% Speak English less than very well
English speakers - Born in the United States 93.6% of residents of Mililani Town speak English at home.
2.1% of residents speak Spanish at home 96 100.0% Speak English very well4.4% of residents speak other language at home 199 96.6% Speak English very well7 3.4% Speak English less than very well
English speakers - Native, born elsewhere 75.3% of residents of Mililani Town speak English at home.
1.6% of residents speak Spanish at home 11 100.0% Speak English very well24.1% of residents speak other language at home 154 90.6% Speak English very well16 9.4% Speak English less than very well
English speakers - Foreign-born 30.3% of residents of Mililani Town speak English at home.
3.8% of residents speak Spanish at home 61 58.7% Speak English very well43 41.3% Speak English less than very well65.9% of residents speak other language at home 1,034 57.3% Speak English very well769 42.7% Speak English less than very well
White (Caucasian) - Speak only English Native:
97.4% (2,758)Foreign-born:
44.8% (90)
White (Caucasian) - Speak another language Native:
3.2% (91)Foreign-born:
53.8% (108)
Black or African American - Speak only English Native:
100.0% (502)Foreign-born:
25.2% (8)
Asian - Speak only English Native:
94.8% (9,270)Foreign-born:
29.1% (621)
Asian - Speak another language Native:
5.8% (565)Foreign-born:
70.8% (1,512)
Native Hawaiian / Pacific Islander - Speak only English Native:
90.9% (1,050)Foreign-born:
22.2% (39)
Native Hawaiian / Pacific Islander - Speak another language Native:
10.3% (119)Foreign-born:
77.2% (136)
Other race - Speak only English Native:
71.8% (176)Foreign-born:
53.3% (28)
Other race - Speak another language Native:
28.6% (70)Foreign-born:
52.3% (28)
Two or more races - Speak only English Native:
95.1% (8,510)Foreign-born:
26.0% (28)
Two or more races - Speak another language Native:
4.8% (426)Foreign-born:
73.9% (80)
White alone - Speak only English Native:
97.0% (2,581)Foreign-born:
55.3% (91)
White alone - Speak another language Native:
3.2% (84)Foreign-born:
44.7% (73)
Hispanic or Latino - Speak only English Native:
86.6% (2,327)Foreign-born:
30.0% (43)
Hispanic or Latino - Speak another language Native:
13.6% (366)Foreign-born:
72.0% (103)
Foreign-born residents in Mililani Town 2,931 residents are foreign born (8.2% Asia ).
This city:
10.8%Hawaii:
18.0%
Marital status for residents in Mililani Town Marital status - White (Caucasian) population 15 years and over
Males 26.8% Never married66.0% Now married0.5% Separated3.6% Widowed3.1% DivorcedFemales 14.6% Never married65.4% Now married0.7% Separated8.3% Widowed10.9% DivorcedWomen who gave birth in the past 12 months Now married:
100.0% (51)Unmarried:
0.0% (0)
Women who did not give birth in the past 12 months Now married:
63.1% (272)Unmarried:
36.9% (159)
Marital status - Black or African American population 15 years and over
Males 27.7% Never married59.0% Now married0.0% Separated0.0% Widowed13.3% DivorcedFemales 21.4% Never married50.5% Now married0.0% Separated7.3% Widowed20.9% DivorcedWomen who gave birth in the past 12 months Now married:
100.0% (14)Unmarried:
0.0% (0)
Women who did not give birth in the past 12 months Now married:
36.7% (45)Unmarried:
63.3% (78)
Marital status - Asian population 15 years and over
Males 31.1% Never married58.4% Now married1.2% Separated2.8% Widowed6.4% DivorcedFemales 19.2% Never married58.3% Now married0.9% Separated13.7% Widowed7.9% DivorcedWomen who gave birth in the past 12 months Now married:
88.3% (79)Unmarried:
11.7% (10)
Women who did not give birth in the past 12 months Now married:
41.6% (746)Unmarried:
58.4% (1,048)
Marital status - Native Hawaiian / Pacific Islander population 15 years and over
Males 46.2% Never married41.9% Now married0.0% Separated0.0% Widowed11.9% DivorcedFemales 23.9% Never married45.5% Now married5.0% Separated17.5% Widowed8.1% DivorcedWomen who did not give birth in the past 12 months Now married:
49.2% (160)Unmarried:
50.8% (165)
Marital status - Other race population 15 years and over
Males 41.7% Never married27.3% Now married20.1% Separated3.6% Widowed7.2% DivorcedFemales 8.7% Never married73.8% Now married0.0% Separated0.0% Widowed17.5% DivorcedWomen who did not give birth in the past 12 months Now married:
87.6% (97)Unmarried:
12.4% (14)
Marital status - Two or more races population 15 years and over
Males 41.0% Never married41.5% Now married0.3% Separated3.4% Widowed13.7% DivorcedFemales 41.7% Never married45.8% Now married1.3% Separated2.9% Widowed8.2% DivorcedWomen who gave birth in the past 12 months Now married:
61.3% (98)Unmarried:
38.7% (62)
Women who did not give birth in the past 12 months Now married:
35.2% (779)Unmarried:
64.8% (1,436)
Marital status - White alone, not Hispanic / Latino population 15 years and over
Males 27.6% Never married64.6% Now married0.6% Separated3.9% Widowed3.3% DivorcedFemales 14.8% Never married64.3% Now married0.0% Separated9.0% Widowed11.9% DivorcedWomen who gave birth in the past 12 months Now married:
100.0% (52)Unmarried:
0.0% (0)
Women who did not give birth in the past 12 months Now married:
59.1% (219)Unmarried:
40.9% (151)
Marital status - Hispanic or Latino population 15 years and over
Males 44.5% Never married47.4% Now married2.7% Separated1.4% Widowed4.0% DivorcedFemales 41.6% Never married43.2% Now married4.8% Separated1.9% Widowed8.5% DivorcedWomen who gave birth in the past 12 months Now married:
100.0% (12)Unmarried:
0.0% (0)
Women who did not give birth in the past 12 months Now married:
42.8% (351)Unmarried:
57.2% (468)
Ancestries in Mililani Town
263 2.0% English219 1.7% American177 1.3% German110 0.8% European90 0.7% Portuguese87 0.7% Italian81 0.6% Irish60 0.5% Lebanese40 0.3% Polish27 0.2% Norwegian24 0.2% Jamaican23 0.2% Australian23 0.2% British21 0.2% African17 0.1% Ghanaian10 0.08% Swedish9 0.07% Dutch9 0.07% French9 0.07% French Canadian7 0.05% Greek7 0.05% Hungarian7 0.05% Scotch-Irish7 0.05% Scottish7 0.05% Welsh6 0.05% Northern European5 0.04% Scandinavian
Children Nativity (place of birth) in Mililani Town
Children under 6 years - Living with two parents Both parents native 661 100.0% NativeBoth parents foreign-born 26 100.0% NativeOne native, one foreign-born parent 79 100.0% NativeChildren under 6 years - Living with one parent Native parent 546 100.0% NativeForeign-born parent 7 100.0% NativeChildren 6 to 17 years - Living with two parents Both parents native 1,729 99.5% Native9 0.5% Foreign-bornBoth parents foreign-born 142 70.6% Native59 29.4% Foreign-bornOne native, one foreign-born parent 163 94.5% Native9 5.5% Foreign-bornChildren 6 to 17 years - Living with one parent Native parent 1,124 100.0% NativeForeign-born parent 46 45.6% Native55 54.4% Foreign-born
Grandparents responsible for own grandchildren in Mililani Town
Grandparents (30 to 59 years) White / Caucasian 10 100.0% Not responsible for grandchildrenAsian 13 22.7% Responsible for grandchildren46 77.3% Not responsible for grandchildrenTwo or more races 13 21.4% Responsible for grandchildren48 78.6% Not responsible for grandchildrenWhite alone, not Hispanic / Latino 11 100.0% Not responsible for grandchildrenHispanic or Latino 47 85.8% Responsible for grandchildren8 14.2% Not responsible for grandchildrenGrandparents (60 years and over) White / Caucasian 2 1.9% Responsible for grandchildren104 98.1% Not responsible for grandchildrenAsian 28 5.7% Responsible for grandchildren454 94.3% Not responsible for grandchildrenTwo or more races 33 15.7% Responsible for grandchildren175 84.3% Not responsible for grandchildrenWhite alone, not Hispanic / Latino 2 2.4% Responsible for grandchildren98 97.6% Not responsible for grandchildrenHispanic or Latino 4 10.1% Responsible for grandchildren34 89.9% Not responsible for grandchildren