Races in Montclair, New Jersey (NJ) Detailed Stats
Ancestries, Foreign-born residents, place of birth

Recent posts about races in Montclair, New Jersey on our local forum with over 2,400,000 registered users:
 | How to find a rental a house in Montclair NJ area? (6 replies) |
| Considering move to Montclair- help with specifics (4 replies) |
| Town suggestions for buying a house (9 replies) |
| Commute from Mount Olive NJ to Montclair (5 replies) |
| Buying house in good for family NJ suburb (15 replies) |
| Montclair vs. Maplewood vs. Summit? (17 replies) |
Latest news about races in Montclair, NJ collected exclusively by city-data.com from local newspapers, TV, and radio stations
14.6% of Montclair, NJ residents are foreign-born (6.6% born in Latin America, 3.7% born in Europe, 2.3% born in Asia), which is 57.9% less than the foreign-born rate of 23.0% across the entire state of New Jersey.
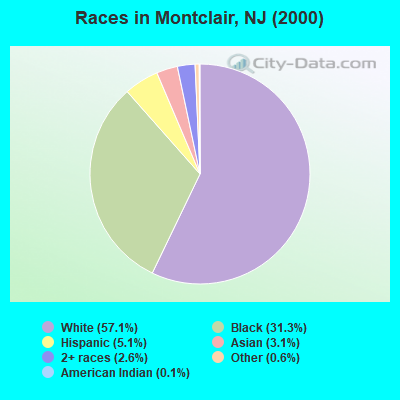
Race distribution in Montclair

- 22,26857.1%White alone
- 12,19431.3%Black alone
- 1,9955.1%Hispanic
- 1,2143.1%Asian alone
- 1,0172.6%Two or more races
- 2200.6%Other race alone
- 570.1%American Indian alone
- 120.03%Native Hawaiian and Other
Pacific Islander alone
2000
2022
-
- 5,557,20966.0%White alone
- 1,117,19113.3%Hispanic
- 1,096,17113.0%Black alone
- 477,0125.7%Asian alone
- 133,6891.6%Two or more races
- 19,5650.2%Other race alone
- 11,3380.1%American Indian alone
- 2,1750.03%Native Hawaiian and Other
Pacific Islander alone

-
- 4,766,47651.5%White alone
- 2,028,47021.9%Hispanic
- 1,111,63212.0%Black alone
- 923,54610.0%Asian alone
- 332,2373.6%Two or more races
- 89,8471.0%Other race alone
- 8,5570.09%American Indian alone
- 9340.01%Native Hawaiian and Other
Pacific Islander alone

Income and house value in Montclair
- Median household income in 2022
- $173,156White non-Hispanic householders
- $79,636Black householders
- $76,608American Indian and Alaska Native householders
- $134,052Asian householders
- $120,889Some other race householders
- $135,005Two or more races householders
- $117,477Hispanic or Latino race householders
- Median 2022 house value
- $931,289White Non-Hispanic householders
- $540,257Black or African American householders
- $319,696American Indian or Alaska Native householders
- $779,964Asian householders
- $360,609Native Hawaiian and other Pacific Islander householders
- $726,201Some other race householders
- $515,080Two or more races householders
- $850,775Hispanic or Latino householders
Household income for White non-Hispanic householders

Household income for Black householders

Household income for American Indian and Alaska Native householders

Household income for Asian householders

Household income for Native Hawaiian and other Pacific Islander householders

Household income for Two or more races householders

Household income for Hispanic or Latino race householders

Foreign-born residents in Montclair
5,679 residents are foreign born (6.6% Latin America, 3.7% Europe, 2.3% Asia).
| This city: | 14.6% |
| New Jersey: | 17.5% |
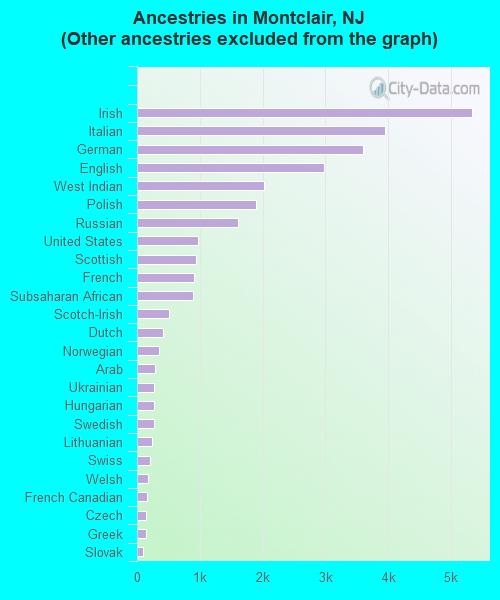
Ancestries in Montclair

- 15,20334.6%Other
- 5,33912.1%Irish
- 3,9489.0%Italian
- 3,6048.2%German
- 2,9756.8%English
- 2,0154.6%West Indian
- 1,9004.3%Polish
- 1,6043.6%Russian
- 9672.2%United States
- 9372.1%Scottish
- 9082.1%French
- 8992.0%Subsaharan African
- 5041.1%Scotch-Irish
- 4130.9%Dutch
- 3430.8%Norwegian
- 2830.6%Arab
- 2780.6%Ukrainian
- 2750.6%Hungarian
- 2710.6%Swedish
- 2370.5%Lithuanian
- 2060.5%Swiss
- 1800.4%Welsh
- 1650.4%French Canadian
- 1390.3%Czech
- 1370.3%Greek
- 930.2%Slovak
- 880.2%Danish
- 520.1%Portuguese
Zip codes: 07042.