Races in Moorhead, Minnesota (MN) Detailed Stats
Data:
Races - White alone (%)
Races - White alone (% change since 2000)
Races - Black alone (%)
Races - Black alone (% change since 2000)
Races - American Indian alone (%)
Races - American Indian alone (% change since 2000)
Races - Asian alone (%)
Races - Asian alone (% change since 2000)
Races - Hispanic (%)
Races - Hispanic (% change since 2000)
Races - Native Hawaiian and Other Pacific Islander alone (%)
Races - Native Hawaiian and Other Pacific Islander alone (% change since 2000)
Races - Two or more races(%)
Races - Two or more races(% change since 2000)
Races - Other race alone (%)
Races - Other race alone (% change since 2000)
Racial diversity
Place of birth - Born in state of residence (%)
Place of birth - Born in state of residence (%) - White
Place of birth - Born in state of residence (%) - Black or African American
Place of birth - Born in state of residence (%) - Asian
Place of birth - Born in state of residence (%) - Hispanic or Latino
Place of birth - Born in state of residence (%) - American Indian and Alaska Native
Place of birth - Born in state of residence (%) - Multirace
Place of birth - Born in state of residence (%) - Other Race
Place of birth - Born in other state (%)
Place of birth - Born in other state (%) - White
Place of birth - Born in other state (%) - Black or African American
Place of birth - Born in other state (%) - Asian
Place of birth - Born in other state (%) - Hispanic or Latino
Place of birth - Born in other state (%) - American Indian and Alaska Native
Place of birth - Born in other state (%) - Multirace
Place of birth - Born in other state (%) - Other Race
Place of birth - Native, outside of US (%)
Place of birth - Native, outside of US (%) - White
Place of birth - Native, outside of US (%) - Black or African American
Place of birth - Native, outside of US (%) - Asian
Place of birth - Native, outside of US (%) - Hispanic or Latino
Place of birth - Native, outside of US (%) - American Indian and Alaska Native
Place of birth - Native, outside of US (%) - Multirace
Place of birth - Native, outside of US (%) - Other Race
Place of birth - Foreign born (%)
Place of birth - Foreign born (%) - White
Place of birth - Foreign born (%) - Black or African American
Place of birth - Foreign born (%) - Asian
Place of birth - Foreign born (%) - Hispanic or Latino
Place of birth - Foreign born (%) - American Indian and Alaska Native
Place of birth - Foreign born (%) - Multirace
Place of birth - Foreign born (%) - Other Race
Residents speaking English at home (%)
Residents speaking English at home - Born in the United States (%)
Residents speaking English at home - Native, born elsewhere (%)
Residents speaking English at home - Foreign born (%)
Residents speaking Spanish at home (%)
Residents speaking Spanish at home - Born in the United States (%)
Residents speaking Spanish at home - Native, born elsewhere (%)
Residents speaking Spanish at home - Foreign born (%)
Residents speaking other language at home (%)
Residents speaking other language at home - Born in the United States (%)
Residents speaking other language at home - Native, born elsewhere (%)
Residents speaking other language at home - Foreign born (%)
Marital status - Never married (%)
Marital status - Now married (%)
Marital status - Separated (%)
Marital status - Widowed (%)
Marital status - Divorced (%)
Ancestries Reported - Arab (%)
Ancestries Reported - Czech (%)
Ancestries Reported - Danish (%)
Ancestries Reported - Dutch (%)
Ancestries Reported - English (%)
Ancestries Reported - French (%)
Ancestries Reported - French Canadian (%)
Ancestries Reported - German (%)
Ancestries Reported - Greek (%)
Ancestries Reported - Hungarian (%)
Ancestries Reported - Irish (%)
Ancestries Reported - Italian (%)
Ancestries Reported - Lithuanian (%)
Ancestries Reported - Norwegian (%)
Ancestries Reported - Polish (%)
Ancestries Reported - Portuguese (%)
Ancestries Reported - Russian (%)
Ancestries Reported - Scotch-Irish (%)
Ancestries Reported - Scottish (%)
Ancestries Reported - Slovak (%)
Ancestries Reported - Subsaharan African (%)
Ancestries Reported - Swedish (%)
Ancestries Reported - Swiss (%)
Ancestries Reported - Ukrainian (%)
Ancestries Reported - United States (%)
Ancestries Reported - Welsh (%)
Ancestries Reported - West Indian (%)
Ancestries Reported - Other (%)
Geographical mobility - Same house 1 year ago (%)
Geographical mobility - Same house 1 year ago (%) - White
Geographical mobility - Same house 1 year ago (%) - Black or African American
Geographical mobility - Same house 1 year ago (%) - Asian
Geographical mobility - Same house 1 year ago (%) - Hispanic or Latino
Geographical mobility - Same house 1 year ago (%) - American Indian and Alaska Native
Geographical mobility - Same house 1 year ago (%) - Multirace
Geographical mobility - Same house 1 year ago (%) - Other Race
Geographical mobility - Moved within same county (%)
Geographical mobility - Moved within same county (%) - White
Geographical mobility - Moved within same county (%) - Black or African American
Geographical mobility - Moved within same county (%) - Asian
Geographical mobility - Moved within same county (%) - Hispanic or Latino
Geographical mobility - Moved within same county (%) - American Indian and Alaska Native
Geographical mobility - Moved within same county (%) - Multirace
Geographical mobility - Moved within same county (%) - Other Race
Geographical mobility - Moved from different county within same state (%)
Geographical mobility - Moved from different county within same state (%) - White
Geographical mobility - Moved from different county within same state (%) - Black or African American
Geographical mobility - Moved from different county within same state (%) - Asian
Geographical mobility - Moved from different county within same state (%) - Hispanic or Latino
Geographical mobility - Moved from different county within same state (%) - American Indian and Alaska Native
Geographical mobility - Moved from different county within same state (%) - Multirace
Geographical mobility - Moved from different county within same state (%) - Other Race
Geographical mobility - Moved from different state (%)
Geographical mobility - Moved from different state (%) - White
Geographical mobility - Moved from different state (%) - Black or African American
Geographical mobility - Moved from different state (%) - Asian
Geographical mobility - Moved from different state (%) - Hispanic or Latino
Geographical mobility - Moved from different state (%) - American Indian and Alaska Native
Geographical mobility - Moved from different state (%) - Multirace
Geographical mobility - Moved from different state (%) - Other Race
Geographical mobility - Moved from abroad (%)
Geographical mobility - Moved from abroad (%) - White
Geographical mobility - Moved from abroad (%) - Black or African American
Geographical mobility - Moved from abroad (%) - Asian
Geographical mobility - Moved from abroad (%) - Hispanic or Latino
Geographical mobility - Moved from abroad (%) - American Indian and Alaska Native
Geographical mobility - Moved from abroad (%) - Multirace
Geographical mobility - Moved from abroad (%) - Other Race
Place of birth for the foreign-born population - Ireland (%)
Place of birth for the foreign-born population - Denmark (%)
Place of birth for the foreign-born population - Norway (%)
Place of birth for the foreign-born population - Sweden (%)
Place of birth for the foreign-born population - United Kingdom (%)
Place of birth for the foreign-born population - England (%)
Place of birth for the foreign-born population - Scotland (%)
Place of birth for the foreign-born population - Other Northern Europe (%)
Place of birth for the foreign-born population - Austria (%)
Place of birth for the foreign-born population - Belgium (%)
Place of birth for the foreign-born population - France (%)
Place of birth for the foreign-born population - Germany (%)
Place of birth for the foreign-born population - Netherlands (%)
Place of birth for the foreign-born population - Switzerland (%)
Place of birth for the foreign-born population - Other Western Europe (%)
Place of birth for the foreign-born population - Greece (%)
Place of birth for the foreign-born population - Italy (%)
Place of birth for the foreign-born population - Portugal (%)
Place of birth for the foreign-born population - Spain (%)
Place of birth for the foreign-born population - Other Southern Europe (%)
Place of birth for the foreign-born population - Albania (%)
Place of birth for the foreign-born population - Belarus (%)
Place of birth for the foreign-born population - Bosnia and Herzegovina (%)
Place of birth for the foreign-born population - Bulgaria (%)
Place of birth for the foreign-born population - Croatia (%)
Place of birth for the foreign-born population - Czechoslovakia (%)
Place of birth for the foreign-born population - Hungary (%)
Place of birth for the foreign-born population - Latvia (%)
Place of birth for the foreign-born population - Lithuania (%)
Place of birth for the foreign-born population - North Macedonia (Macedonia) (%)
Place of birth for the foreign-born population - Moldova (%)
Place of birth for the foreign-born population - Poland (%)
Place of birth for the foreign-born population - Romania (%)
Place of birth for the foreign-born population - Russia (%)
Place of birth for the foreign-born population - Serbia (%)
Place of birth for the foreign-born population - Ukraine (%)
Place of birth for the foreign-born population - Other Eastern Europe (%)
Place of birth for the foreign-born population - China (%)
Place of birth for the foreign-born population - Hong Kong (%)
Place of birth for the foreign-born population - Taiwan (%)
Place of birth for the foreign-born population - Japan (%)
Place of birth for the foreign-born population - Korea (%)
Place of birth for the foreign-born population - Other Eastern Asia (%)
Place of birth for the foreign-born population - Afghanistan (%)
Place of birth for the foreign-born population - Bangladesh (%)
Place of birth for the foreign-born population - India (%)
Place of birth for the foreign-born population - Iran (%)
Place of birth for the foreign-born population - Kazakhstan (%)
Place of birth for the foreign-born population - Nepal (%)
Place of birth for the foreign-born population - Pakistan (%)
Place of birth for the foreign-born population - Sri Lanka (%)
Place of birth for the foreign-born population - Uzbekistan (%)
Place of birth for the foreign-born population - Other South Central Asia (%)
Place of birth for the foreign-born population - Burma (%)
Place of birth for the foreign-born population - Cambodia (%)
Place of birth for the foreign-born population - Indonesia (%)
Place of birth for the foreign-born population - Laos (%)
Place of birth for the foreign-born population - Malaysia (%)
Place of birth for the foreign-born population - Philippines (%)
Place of birth for the foreign-born population - Singapore (%)
Place of birth for the foreign-born population - Thailand (%)
Place of birth for the foreign-born population - Vietnam (%)
Place of birth for the foreign-born population - Other South Eastern Asia (%)
Place of birth for the foreign-born population - Armenia (%)
Place of birth for the foreign-born population - Iraq (%)
Place of birth for the foreign-born population - Israel (%)
Place of birth for the foreign-born population - Jordan (%)
Place of birth for the foreign-born population - Kuwait (%)
Place of birth for the foreign-born population - Lebanon (%)
Place of birth for the foreign-born population - Saudi Arabia (%)
Place of birth for the foreign-born population - Syria (%)
Place of birth for the foreign-born population - Turkey (%)
Place of birth for the foreign-born population - Yemen (%)
Place of birth for the foreign-born population - Other Western Asia (%)
Place of birth for the foreign-born population - Eritrea (%)
Place of birth for the foreign-born population - Ethiopia (%)
Place of birth for the foreign-born population - Kenya (%)
Place of birth for the foreign-born population - Somalia (%)
Place of birth for the foreign-born population - Uganda (%)
Place of birth for the foreign-born population - Zimbabwe (%)
Place of birth for the foreign-born population - Other Eastern Africa (%)
Place of birth for the foreign-born population - Cameroon (%)
Place of birth for the foreign-born population - Congo (%)
Place of birth for the foreign-born population - Democratic Republic of Congo (Zaire) (%)
Place of birth for the foreign-born population - Other Middle Africa (%)
Place of birth for the foreign-born population - Egypt (%)
Place of birth for the foreign-born population - Morocco (%)
Place of birth for the foreign-born population - Sudan (%)
Place of birth for the foreign-born population - Other Northern Africa (%)
Place of birth for the foreign-born population - South Africa (%)
Place of birth for the foreign-born population - Other Southern Africa (%)
Place of birth for the foreign-born population - Cabo Verde (%)
Place of birth for the foreign-born population - Ghana (%)
Place of birth for the foreign-born population - Liberia (%)
Place of birth for the foreign-born population - Nigeria (%)
Place of birth for the foreign-born population - Senegal (%)
Place of birth for the foreign-born population - Sierra Leone (%)
Place of birth for the foreign-born population - Other Western Africa (%)
Place of birth for the foreign-born population - Australia (%)
Place of birth for the foreign-born population - New Zealand (%)
Place of birth for the foreign-born population - Fiji (%)
Place of birth for the foreign-born population - Micronesia (%)
Place of birth for the foreign-born population - Bahamas (%)
Place of birth for the foreign-born population - Barbados (%)
Place of birth for the foreign-born population - Cuba (%)
Place of birth for the foreign-born population - Dominica (%)
Place of birth for the foreign-born population - Dominican Republic (%)
Place of birth for the foreign-born population - Grenada (%)
Place of birth for the foreign-born population - Haiti (%)
Place of birth for the foreign-born population - Jamaica (%)
Place of birth for the foreign-born population - St. Vincent and the Grenadines (%)
Place of birth for the foreign-born population - Trinidad and Tobago (%)
Place of birth for the foreign-born population - West Indies (%)
Place of birth for the foreign-born population - Other Caribbean (%)
Place of birth for the foreign-born population - Belize (%)
Place of birth for the foreign-born population - Costa Rica (%)
Place of birth for the foreign-born population - El Salvador (%)
Place of birth for the foreign-born population - Guatemala (%)
Place of birth for the foreign-born population - Honduras (%)
Place of birth for the foreign-born population - Mexico (%)
Place of birth for the foreign-born population - Nicaragua (%)
Place of birth for the foreign-born population - Panama (%)
Place of birth for the foreign-born population - Other Central America (%)
Place of birth for the foreign-born population - Argentina (%)
Place of birth for the foreign-born population - Bolivia (%)
Place of birth for the foreign-born population - Brazil (%)
Place of birth for the foreign-born population - Chile (%)
Place of birth for the foreign-born population - Colombia (%)
Place of birth for the foreign-born population - Ecuador (%)
Place of birth for the foreign-born population - Guyana (%)
Place of birth for the foreign-born population - Peru (%)
Place of birth for the foreign-born population - Uruguay (%)
Place of birth for the foreign-born population - Venezuela (%)
Place of birth for the foreign-born population - Other South America (%)
Place of birth for the foreign-born population - Canada (%)
Place of birth for the foreign-born population - Other Northern America (%)
Place of birth for the foreign-born population - Other (%)
Latest news about races in Moorhead, MN collected exclusively by city-data.com from local newspapers, TV, and radio stations
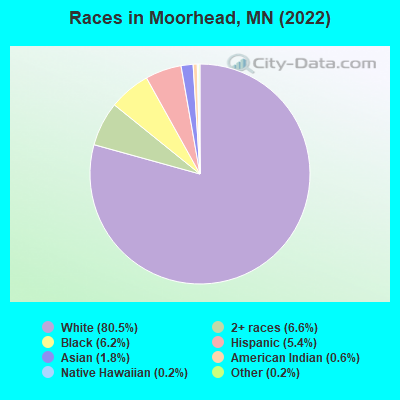
According to 2022 data, the most numerous races in Moorhead, MN are White alone (36,135 residents), Black alone (2,788 residents), and Hispanic (2,411 residents). 89.8% of Moorhead residents speak English at home. 6.9% of Moorhead, MN residents are foreign-born (3.2% born in Asia, 2.2% born in Africa, 0.8% born in Europe), which is 16.5% less than the foreign-born rate of 8.0% across the entire state of Minnesota.
Race distribution in Moorhead
2000 2022
4,337,143 88.2% White alone 168,813 3.4% Black alone 143,382 2.9% Hispanic 141,083 2.9% Asian alone 70,304 1.4% Two or more races 52,009 1.1% American Indian alone 5,031 0.1% Other race alone 1,714 0.03% Native Hawaiian and Other
4,356,347 76.2% White alone 395,179 6.9% Black alone 333,830 5.8% Hispanic 294,800 5.2% Asian alone 259,649 4.5% Two or more races 42,125 0.7% American Indian alone 32,976 0.6% Other race alone 2,278 0.04% Native Hawaiian and Other
Income and house value in Moorhead Median household income in 2022 $73,296 White non-Hispanic householders$109,037 Black householders$8,846 American Indian and Alaska Native householders$61,741 Asian householders$75,373 Some other race householders$92,308 Hispanic or Latino race householdersMedian 2022 house value $247,721 White Non-Hispanic householders$391,579 Black or African American householders$242,255 American Indian or Alaska Native householders $521,625 Asian householders$187,014 Native Hawaiian and other Pacific Islander householders$210,894 Some other race householders$177,519 Two or more races householders$236,501 Hispanic or Latino householders
Median age by race in Moorhead
34.0 Median age for White residents33.8 34.6 25.5 Median age for Black or African American residents31.5 22.0 37.7 Median age for American Indian / Alaska Native residents37.2 40.7 23.8 Median age for Asian residents24.6 21.4 56.2 Median age for Native Hawaiian / Pacific Islander residents-856,799,036.4 -666,666,666.0 27.9 Median age for Other race residents27.3 43.2 21.1 Median age for Two or more races residents30.7 10.0 33.5 Median age for White alone residents33.3 34.1 26.5 Median age for Hispanic or Latino residents35.2 16.1
Owner/renter occupied households by race in Moorhead
House owners and renters - White residents 9,985 61.2% Owner occupied6,318 38.8% Renter occupiedHouse owners and renters - Black or African American residents 164 28.7% Owner occupied406 71.3% Renter occupiedHouse owners and renters - American Indian / Alaska Native residents 5 1.6% Owner occupied313 98.4% Renter occupiedHouse owners and renters - Asian residents 142 55.8% Owner occupied112 44.2% Renter occupiedHouse owners and renters - Native Hawaiian / Pacific Islander residents 74 100.0% Renter occupiedHouse owners and renters - Other race residents 64 83.1% Owner occupied13 16.9% Renter occupiedHouse owners and renters - Two or more races residents 236 22.0% Owner occupied838 78.0% Renter occupiedHouse owners and renters - White alone residents 9,756 62.0% Owner occupied5,976 38.0% Renter occupiedHouse owners and renters - Hispanic or Latino residents 412 43.6% Owner occupied532 56.4% Renter occupied
Language usage in Moorhead
English speakers - Total 89.8% of residents of Moorhead speak English at home.
1.6% of residents speak Spanish at home 490 75.7% Speak English very well157 24.3% Speak English less than very well8.7% of residents speak other language at home 2,528 70.0% Speak English very well1,082 30.0% Speak English less than very well
English speakers - Born in the United States 93.0% of residents of Moorhead speak English at home.
2.8% of residents speak Spanish at home 425 76.3% Speak English very well132 23.7% Speak English less than very well4.2% of residents speak other language at home 767 93.0% Speak English very well58 7.0% Speak English less than very well
English speakers - Native, born elsewhere 75.3% of residents of Moorhead speak English at home.
21.3% of residents speak other language at home 77 100.0% Speak English very well
English speakers - Foreign-born 20.7% of residents of Moorhead speak English at home.
0.6% of residents speak Spanish at home 20 100.0% Speak English very well79.5% of residents speak other language at home 1,520 62.0% Speak English very well932 38.0% Speak English less than very well
White (Caucasian) - Speak only English Native:
97.4% (33,309)Foreign-born:
54.5% (368)
White (Caucasian) - Speak another language Native:
2.5% (845)Foreign-born:
100.0% (674)
Black or African American - Speak only English Native:
81.4% (990)Foreign-born:
29.4% (317)
Black or African American - Speak another language Native:
19.0% (231)Foreign-born:
69.5% (748)
American Indian / Alaska Native - Speak only English Native:
74.0% (402)Foreign-born:
62.1% (32)
Asian - Speak only English Native:
76.3% (335)Foreign-born:
15.9% (61)
Asian - Speak another language Native:
28.0% (123)Foreign-born:
84.1% (321)
Other race - Speak only English Native:
100.0% (144)Foreign-born:
45.8% (33)
White alone - Speak only English Native:
98.5% (32,926)Foreign-born:
7.2% (102)
White alone - Speak another language Native:
1.4% (465)Foreign-born:
86.5% (1,225)
Hispanic or Latino - Speak only English Native:
84.3% (1,727)Foreign-born:
100.0% (67)
Hispanic or Latino - Speak another language Native:
17.9% (367)Foreign-born:
7.5% (5)
Foreign-born residents in Moorhead 3,082 residents are foreign born (3.2% Asia , 2.2% Africa , 0.8% Europe ).
This city:
6.9%Minnesota:
8.5%
Marital status for residents in Moorhead Marital status - White (Caucasian) population 15 years and over
Males 42.5% Never married45.9% Now married1.1% Separated2.8% Widowed7.7% DivorcedFemales 39.5% Never married42.1% Now married0.4% Separated7.8% Widowed10.1% DivorcedWomen who gave birth in the past 12 months Now married:
89.5% (362)Unmarried:
10.5% (42)
Women who did not give birth in the past 12 months Now married:
35.0% (3,344)Unmarried:
65.0% (6,214)
Marital status - Black or African American population 15 years and over
Males 45.2% Never married48.6% Now married5.2% Separated0.1% Widowed0.8% DivorcedFemales 64.3% Never married23.5% Now married5.7% Separated0.0% Widowed6.5% DivorcedWomen who gave birth in the past 12 months Now married:
30.2% (40)Unmarried:
69.8% (93)
Women who did not give birth in the past 12 months Now married:
24.6% (160)Unmarried:
75.4% (490)
Marital status - American Indian / Alaska Native population 15 years and over
Males 51.3% Never married2.2% Now married0.0% Separated0.0% Widowed46.5% DivorcedFemales 50.5% Never married13.4% Now married0.0% Separated0.0% Widowed36.1% DivorcedWomen who did not give birth in the past 12 months Now married:
21.0% (27)Unmarried:
79.0% (102)
Marital status - Asian population 15 years and over
Males 55.8% Never married34.5% Now married9.8% Separated0.0% Widowed0.0% DivorcedFemales 55.9% Never married32.0% Now married5.9% Separated0.0% Widowed6.2% DivorcedWomen who did not give birth in the past 12 months Now married:
34.4% (77)Unmarried:
65.6% (147)
Marital status - Native Hawaiian / Pacific Islander population 15 years and over
Males 100.0% Never married0.0% Now married0.0% Separated0.0% Widowed0.0% DivorcedFemales 0.0% Never married0.0% Now married0.0% Separated100.0% Widowed0.0% DivorcedWomen who did not give birth in the past 12 months Now married:
0.0% (0)Unmarried:
100.0% (112)
Marital status - Other race population 15 years and over
Males 59.0% Never married41.0% Now married0.0% Separated0.0% Widowed0.0% DivorcedFemales 0.0% Never married18.9% Now married0.0% Separated54.1% Widowed27.0% DivorcedWomen who gave birth in the past 12 months Now married:
100.0% (9)Unmarried:
0.0% (0)
Women who did not give birth in the past 12 months Now married:
0.0% (0)Unmarried:
100.0% (26)
Marital status - Two or more races population 15 years and over
Males 64.8% Never married27.9% Now married5.4% Separated0.0% Widowed1.9% DivorcedFemales 74.1% Never married17.6% Now married8.3% Separated0.0% Widowed0.0% DivorcedWomen who gave birth in the past 12 months Now married:
100.0% (26)Unmarried:
0.0% (0)
Women who did not give birth in the past 12 months Now married:
18.2% (117)Unmarried:
81.8% (526)
Marital status - White alone, not Hispanic / Latino population 15 years and over
Males 41.8% Never married46.5% Now married1.1% Separated2.8% Widowed7.7% DivorcedFemales 39.6% Never married41.8% Now married0.4% Separated8.1% Widowed10.2% DivorcedWomen who gave birth in the past 12 months Now married:
89.5% (371)Unmarried:
10.5% (43)
Women who did not give birth in the past 12 months Now married:
34.3% (3,222)Unmarried:
65.7% (6,179)
Marital status - Hispanic or Latino population 15 years and over
Males 63.7% Never married30.3% Now married0.0% Separated0.4% Widowed5.5% DivorcedFemales 40.2% Never married42.0% Now married8.1% Separated2.8% Widowed6.8% DivorcedWomen who gave birth in the past 12 months Now married:
0.0% (0)Unmarried:
100.0% (53)
Women who did not give birth in the past 12 months Now married:
50.0% (274)Unmarried:
50.0% (274)
Ancestries in Moorhead
3,868 21.4% Norwegian3,461 19.1% German1,092 6.0% American787 4.4% Scandinavian563 3.1% African504 2.8% European499 2.8% Irish250 1.4% Swedish206 1.1% Yugoslavian194 1.1% English171 0.9% Dutch151 0.8% Iraqi149 0.8% Polish144 0.8% Scottish104 0.6% French103 0.6% Nigerian91 0.5% Finnish75 0.4% Kenyan69 0.4% Syrian67 0.4% Somali57 0.3% Czech51 0.3% Italian51 0.3% Ukrainian46 0.3% German Russian35 0.2% Czechoslovakian35 0.2% Liberian33 0.2% Danish32 0.2% Lithuanian31 0.2% Brazilian31 0.2% Ethiopian30 0.2% Croatian29 0.2% Northern European20 0.1% Scotch-Irish15 0.08% Lebanese12 0.07% Serbian12 0.07% Welsh10 0.06% Arab10 0.06% Jamaican9 0.05% Canadian9 0.05% French Canadian5 0.03% British5 0.03% Swiss4 0.02% Russian3 0.02% Icelander
Geographical mobility in Moorhead Same house 1 year ago 29,357 80.1% White (Caucasian)1,597 58.7% Black or African American402 63.7% American Indian / Alaska Native481 59.3% Asian118 100.0% Native Hawaiian / Pacific Islander141 62.8% Other race1,986 70.6% Two or more races28,565 80.0% White alone, not Hispanic / Latino1,435 62.3% Hispanic or LatinoMoved within same county 2,501 6.8% White / Caucasian313 11.5% Black or African American20 3.2% American Indian / Alaska Native91 11.3% Asian31 13.7% Other race411 14.6% Two or more races2,503 7.0% White alone, not Hispanic / Latino337 14.6% Hispanic or LatinoMoved within same state 2,094 5.7% White / Caucasian89 3.3% Black or African American45 7.1% American Indian / Alaska Native69 8.5% Asian38 16.8% Other race116 4.1% Two or more races2,037 5.7% White alone, not Hispanic / Latino111 4.8% Hispanic or LatinoMoved from different state 2,859 7.8% White / Caucasian827 30.4% Black or African American143 22.6% American Indian / Alaska Native127 15.6% Asian8 3.6% Other race292 10.4% Two or more races2,819 7.9% White alone, not Hispanic / Latino413 17.9% Hispanic or LatinoMoved from abroad 50 0.1% White86 3.2% Black or African American42 5.2% Asian50 0.1% White alone, not Hispanic / Latino
Children Nativity (place of birth) in Moorhead
Children under 6 years - Living with two parents Both parents native 1,881 99.8% Native3 0.2% Foreign-bornBoth parents foreign-born 445 86.5% Native69 13.5% Foreign-bornOne native, one foreign-born parent 93 100.0% NativeChildren under 6 years - Living with one parent Native parent 588 100.0% NativeForeign-born parent 152 100.0% NativeChildren 6 to 17 years - Living with two parents Both parents native 3,555 99.5% Native17 0.5% Foreign-bornBoth parents foreign-born 359 41.2% Native512 58.8% Foreign-bornOne native, one foreign-born parent 227 90.4% Native24 9.6% Foreign-bornChildren 6 to 17 years - Living with one parent Native parent 1,729 100.0% NativeForeign-born parent 216 50.4% Native212 49.6% Foreign-born
Grandparents responsible for own grandchildren in Moorhead
Grandparents (30 to 59 years) White / Caucasian 124 60.2% Responsible for grandchildren82 39.8% Not responsible for grandchildrenTwo or more races 10 100.0% Not responsible for grandchildrenWhite alone, not Hispanic / Latino 127 60.3% Responsible for grandchildren84 39.7% Not responsible for grandchildrenHispanic or Latino 15 100.0% Not responsible for grandchildrenGrandparents (60 years and over) White / Caucasian 13 8.7% Responsible for grandchildren134 91.3% Not responsible for grandchildrenWhite alone, not Hispanic / Latino 13 8.8% Responsible for grandchildren137 91.2% Not responsible for grandchildrenHispanic or Latino 8 100.0% Not responsible for grandchildren