Races in North St. Paul, Minnesota (MN) Detailed Stats
Data:
Races - White alone (%)
Races - White alone (% change since 2000)
Races - Black alone (%)
Races - Black alone (% change since 2000)
Races - American Indian alone (%)
Races - American Indian alone (% change since 2000)
Races - Asian alone (%)
Races - Asian alone (% change since 2000)
Races - Hispanic (%)
Races - Hispanic (% change since 2000)
Races - Native Hawaiian and Other Pacific Islander alone (%)
Races - Native Hawaiian and Other Pacific Islander alone (% change since 2000)
Races - Two or more races(%)
Races - Two or more races(% change since 2000)
Races - Other race alone (%)
Races - Other race alone (% change since 2000)
Racial diversity
Place of birth - Born in state of residence (%)
Place of birth - Born in state of residence (%) - White
Place of birth - Born in state of residence (%) - Black or African American
Place of birth - Born in state of residence (%) - Asian
Place of birth - Born in state of residence (%) - Hispanic or Latino
Place of birth - Born in state of residence (%) - American Indian and Alaska Native
Place of birth - Born in state of residence (%) - Multirace
Place of birth - Born in state of residence (%) - Other Race
Place of birth - Born in other state (%)
Place of birth - Born in other state (%) - White
Place of birth - Born in other state (%) - Black or African American
Place of birth - Born in other state (%) - Asian
Place of birth - Born in other state (%) - Hispanic or Latino
Place of birth - Born in other state (%) - American Indian and Alaska Native
Place of birth - Born in other state (%) - Multirace
Place of birth - Born in other state (%) - Other Race
Place of birth - Native, outside of US (%)
Place of birth - Native, outside of US (%) - White
Place of birth - Native, outside of US (%) - Black or African American
Place of birth - Native, outside of US (%) - Asian
Place of birth - Native, outside of US (%) - Hispanic or Latino
Place of birth - Native, outside of US (%) - American Indian and Alaska Native
Place of birth - Native, outside of US (%) - Multirace
Place of birth - Native, outside of US (%) - Other Race
Place of birth - Foreign born (%)
Place of birth - Foreign born (%) - White
Place of birth - Foreign born (%) - Black or African American
Place of birth - Foreign born (%) - Asian
Place of birth - Foreign born (%) - Hispanic or Latino
Place of birth - Foreign born (%) - American Indian and Alaska Native
Place of birth - Foreign born (%) - Multirace
Place of birth - Foreign born (%) - Other Race
Residents speaking English at home (%)
Residents speaking English at home - Born in the United States (%)
Residents speaking English at home - Native, born elsewhere (%)
Residents speaking English at home - Foreign born (%)
Residents speaking Spanish at home (%)
Residents speaking Spanish at home - Born in the United States (%)
Residents speaking Spanish at home - Native, born elsewhere (%)
Residents speaking Spanish at home - Foreign born (%)
Residents speaking other language at home (%)
Residents speaking other language at home - Born in the United States (%)
Residents speaking other language at home - Native, born elsewhere (%)
Residents speaking other language at home - Foreign born (%)
Marital status - Never married (%)
Marital status - Now married (%)
Marital status - Separated (%)
Marital status - Widowed (%)
Marital status - Divorced (%)
Ancestries Reported - Arab (%)
Ancestries Reported - Czech (%)
Ancestries Reported - Danish (%)
Ancestries Reported - Dutch (%)
Ancestries Reported - English (%)
Ancestries Reported - French (%)
Ancestries Reported - French Canadian (%)
Ancestries Reported - German (%)
Ancestries Reported - Greek (%)
Ancestries Reported - Hungarian (%)
Ancestries Reported - Irish (%)
Ancestries Reported - Italian (%)
Ancestries Reported - Lithuanian (%)
Ancestries Reported - Norwegian (%)
Ancestries Reported - Polish (%)
Ancestries Reported - Portuguese (%)
Ancestries Reported - Russian (%)
Ancestries Reported - Scotch-Irish (%)
Ancestries Reported - Scottish (%)
Ancestries Reported - Slovak (%)
Ancestries Reported - Subsaharan African (%)
Ancestries Reported - Swedish (%)
Ancestries Reported - Swiss (%)
Ancestries Reported - Ukrainian (%)
Ancestries Reported - United States (%)
Ancestries Reported - Welsh (%)
Ancestries Reported - West Indian (%)
Ancestries Reported - Other (%)
Geographical mobility - Same house 1 year ago (%)
Geographical mobility - Same house 1 year ago (%) - White
Geographical mobility - Same house 1 year ago (%) - Black or African American
Geographical mobility - Same house 1 year ago (%) - Asian
Geographical mobility - Same house 1 year ago (%) - Hispanic or Latino
Geographical mobility - Same house 1 year ago (%) - American Indian and Alaska Native
Geographical mobility - Same house 1 year ago (%) - Multirace
Geographical mobility - Same house 1 year ago (%) - Other Race
Geographical mobility - Moved within same county (%)
Geographical mobility - Moved within same county (%) - White
Geographical mobility - Moved within same county (%) - Black or African American
Geographical mobility - Moved within same county (%) - Asian
Geographical mobility - Moved within same county (%) - Hispanic or Latino
Geographical mobility - Moved within same county (%) - American Indian and Alaska Native
Geographical mobility - Moved within same county (%) - Multirace
Geographical mobility - Moved within same county (%) - Other Race
Geographical mobility - Moved from different county within same state (%)
Geographical mobility - Moved from different county within same state (%) - White
Geographical mobility - Moved from different county within same state (%) - Black or African American
Geographical mobility - Moved from different county within same state (%) - Asian
Geographical mobility - Moved from different county within same state (%) - Hispanic or Latino
Geographical mobility - Moved from different county within same state (%) - American Indian and Alaska Native
Geographical mobility - Moved from different county within same state (%) - Multirace
Geographical mobility - Moved from different county within same state (%) - Other Race
Geographical mobility - Moved from different state (%)
Geographical mobility - Moved from different state (%) - White
Geographical mobility - Moved from different state (%) - Black or African American
Geographical mobility - Moved from different state (%) - Asian
Geographical mobility - Moved from different state (%) - Hispanic or Latino
Geographical mobility - Moved from different state (%) - American Indian and Alaska Native
Geographical mobility - Moved from different state (%) - Multirace
Geographical mobility - Moved from different state (%) - Other Race
Geographical mobility - Moved from abroad (%)
Geographical mobility - Moved from abroad (%) - White
Geographical mobility - Moved from abroad (%) - Black or African American
Geographical mobility - Moved from abroad (%) - Asian
Geographical mobility - Moved from abroad (%) - Hispanic or Latino
Geographical mobility - Moved from abroad (%) - American Indian and Alaska Native
Geographical mobility - Moved from abroad (%) - Multirace
Geographical mobility - Moved from abroad (%) - Other Race
Place of birth for the foreign-born population - Ireland (%)
Place of birth for the foreign-born population - Denmark (%)
Place of birth for the foreign-born population - Norway (%)
Place of birth for the foreign-born population - Sweden (%)
Place of birth for the foreign-born population - United Kingdom (%)
Place of birth for the foreign-born population - England (%)
Place of birth for the foreign-born population - Scotland (%)
Place of birth for the foreign-born population - Other Northern Europe (%)
Place of birth for the foreign-born population - Austria (%)
Place of birth for the foreign-born population - Belgium (%)
Place of birth for the foreign-born population - France (%)
Place of birth for the foreign-born population - Germany (%)
Place of birth for the foreign-born population - Netherlands (%)
Place of birth for the foreign-born population - Switzerland (%)
Place of birth for the foreign-born population - Other Western Europe (%)
Place of birth for the foreign-born population - Greece (%)
Place of birth for the foreign-born population - Italy (%)
Place of birth for the foreign-born population - Portugal (%)
Place of birth for the foreign-born population - Spain (%)
Place of birth for the foreign-born population - Other Southern Europe (%)
Place of birth for the foreign-born population - Albania (%)
Place of birth for the foreign-born population - Belarus (%)
Place of birth for the foreign-born population - Bosnia and Herzegovina (%)
Place of birth for the foreign-born population - Bulgaria (%)
Place of birth for the foreign-born population - Croatia (%)
Place of birth for the foreign-born population - Czechoslovakia (%)
Place of birth for the foreign-born population - Hungary (%)
Place of birth for the foreign-born population - Latvia (%)
Place of birth for the foreign-born population - Lithuania (%)
Place of birth for the foreign-born population - North Macedonia (Macedonia) (%)
Place of birth for the foreign-born population - Moldova (%)
Place of birth for the foreign-born population - Poland (%)
Place of birth for the foreign-born population - Romania (%)
Place of birth for the foreign-born population - Russia (%)
Place of birth for the foreign-born population - Serbia (%)
Place of birth for the foreign-born population - Ukraine (%)
Place of birth for the foreign-born population - Other Eastern Europe (%)
Place of birth for the foreign-born population - China (%)
Place of birth for the foreign-born population - Hong Kong (%)
Place of birth for the foreign-born population - Taiwan (%)
Place of birth for the foreign-born population - Japan (%)
Place of birth for the foreign-born population - Korea (%)
Place of birth for the foreign-born population - Other Eastern Asia (%)
Place of birth for the foreign-born population - Afghanistan (%)
Place of birth for the foreign-born population - Bangladesh (%)
Place of birth for the foreign-born population - India (%)
Place of birth for the foreign-born population - Iran (%)
Place of birth for the foreign-born population - Kazakhstan (%)
Place of birth for the foreign-born population - Nepal (%)
Place of birth for the foreign-born population - Pakistan (%)
Place of birth for the foreign-born population - Sri Lanka (%)
Place of birth for the foreign-born population - Uzbekistan (%)
Place of birth for the foreign-born population - Other South Central Asia (%)
Place of birth for the foreign-born population - Burma (%)
Place of birth for the foreign-born population - Cambodia (%)
Place of birth for the foreign-born population - Indonesia (%)
Place of birth for the foreign-born population - Laos (%)
Place of birth for the foreign-born population - Malaysia (%)
Place of birth for the foreign-born population - Philippines (%)
Place of birth for the foreign-born population - Singapore (%)
Place of birth for the foreign-born population - Thailand (%)
Place of birth for the foreign-born population - Vietnam (%)
Place of birth for the foreign-born population - Other South Eastern Asia (%)
Place of birth for the foreign-born population - Armenia (%)
Place of birth for the foreign-born population - Iraq (%)
Place of birth for the foreign-born population - Israel (%)
Place of birth for the foreign-born population - Jordan (%)
Place of birth for the foreign-born population - Kuwait (%)
Place of birth for the foreign-born population - Lebanon (%)
Place of birth for the foreign-born population - Saudi Arabia (%)
Place of birth for the foreign-born population - Syria (%)
Place of birth for the foreign-born population - Turkey (%)
Place of birth for the foreign-born population - Yemen (%)
Place of birth for the foreign-born population - Other Western Asia (%)
Place of birth for the foreign-born population - Eritrea (%)
Place of birth for the foreign-born population - Ethiopia (%)
Place of birth for the foreign-born population - Kenya (%)
Place of birth for the foreign-born population - Somalia (%)
Place of birth for the foreign-born population - Uganda (%)
Place of birth for the foreign-born population - Zimbabwe (%)
Place of birth for the foreign-born population - Other Eastern Africa (%)
Place of birth for the foreign-born population - Cameroon (%)
Place of birth for the foreign-born population - Congo (%)
Place of birth for the foreign-born population - Democratic Republic of Congo (Zaire) (%)
Place of birth for the foreign-born population - Other Middle Africa (%)
Place of birth for the foreign-born population - Egypt (%)
Place of birth for the foreign-born population - Morocco (%)
Place of birth for the foreign-born population - Sudan (%)
Place of birth for the foreign-born population - Other Northern Africa (%)
Place of birth for the foreign-born population - South Africa (%)
Place of birth for the foreign-born population - Other Southern Africa (%)
Place of birth for the foreign-born population - Cabo Verde (%)
Place of birth for the foreign-born population - Ghana (%)
Place of birth for the foreign-born population - Liberia (%)
Place of birth for the foreign-born population - Nigeria (%)
Place of birth for the foreign-born population - Senegal (%)
Place of birth for the foreign-born population - Sierra Leone (%)
Place of birth for the foreign-born population - Other Western Africa (%)
Place of birth for the foreign-born population - Australia (%)
Place of birth for the foreign-born population - New Zealand (%)
Place of birth for the foreign-born population - Fiji (%)
Place of birth for the foreign-born population - Micronesia (%)
Place of birth for the foreign-born population - Bahamas (%)
Place of birth for the foreign-born population - Barbados (%)
Place of birth for the foreign-born population - Cuba (%)
Place of birth for the foreign-born population - Dominica (%)
Place of birth for the foreign-born population - Dominican Republic (%)
Place of birth for the foreign-born population - Grenada (%)
Place of birth for the foreign-born population - Haiti (%)
Place of birth for the foreign-born population - Jamaica (%)
Place of birth for the foreign-born population - St. Vincent and the Grenadines (%)
Place of birth for the foreign-born population - Trinidad and Tobago (%)
Place of birth for the foreign-born population - West Indies (%)
Place of birth for the foreign-born population - Other Caribbean (%)
Place of birth for the foreign-born population - Belize (%)
Place of birth for the foreign-born population - Costa Rica (%)
Place of birth for the foreign-born population - El Salvador (%)
Place of birth for the foreign-born population - Guatemala (%)
Place of birth for the foreign-born population - Honduras (%)
Place of birth for the foreign-born population - Mexico (%)
Place of birth for the foreign-born population - Nicaragua (%)
Place of birth for the foreign-born population - Panama (%)
Place of birth for the foreign-born population - Other Central America (%)
Place of birth for the foreign-born population - Argentina (%)
Place of birth for the foreign-born population - Bolivia (%)
Place of birth for the foreign-born population - Brazil (%)
Place of birth for the foreign-born population - Chile (%)
Place of birth for the foreign-born population - Colombia (%)
Place of birth for the foreign-born population - Ecuador (%)
Place of birth for the foreign-born population - Guyana (%)
Place of birth for the foreign-born population - Peru (%)
Place of birth for the foreign-born population - Uruguay (%)
Place of birth for the foreign-born population - Venezuela (%)
Place of birth for the foreign-born population - Other South America (%)
Place of birth for the foreign-born population - Canada (%)
Place of birth for the foreign-born population - Other Northern America (%)
Place of birth for the foreign-born population - Other (%)
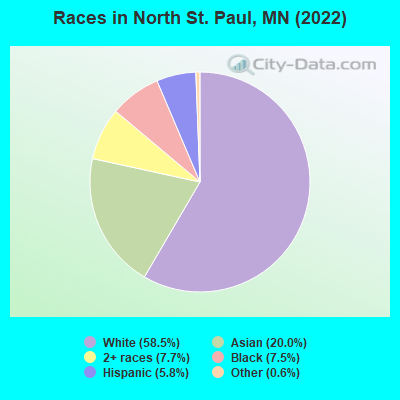
According to 2022 data, the most numerous races in North St. Paul, MN are White alone (7,148 residents), Black alone (916 residents), and Hispanic (705 residents). 77.0% of North St. Paul residents speak English at home. 11.2% of North St. Paul, MN residents are foreign-born (8.0% born in Asia, 1.7% born in Africa), which is 28.7% greater than the foreign-born rate of 8.0% across the entire state of Minnesota.
Race distribution in North St. Paul
2000 2022
4,337,143 88.2% White alone 168,813 3.4% Black alone 143,382 2.9% Hispanic 141,083 2.9% Asian alone 70,304 1.4% Two or more races 52,009 1.1% American Indian alone 5,031 0.1% Other race alone 1,714 0.03% Native Hawaiian and Other
4,356,347 76.2% White alone 395,179 6.9% Black alone 333,830 5.8% Hispanic 294,800 5.2% Asian alone 259,649 4.5% Two or more races 42,125 0.7% American Indian alone 32,976 0.6% Other race alone 2,278 0.04% Native Hawaiian and Other
Income and house value in North St. Paul Median household income in 2022 $76,523 White non-Hispanic householders$41,912 Black householders$89,945 Asian householders$67,844 Some other race householders$73,656 Hispanic or Latino race householdersMedian 2022 house value $289,939 White Non-Hispanic householders$275,259 Black or African American householders$240,515 American Indian or Alaska Native householders $351,842 Asian householders$218,250 Some other race householders$241,738 Two or more races householders$321,258 Hispanic or Latino householders
Median age by race in North St. Paul
42.7 Median age for White residents41.3 43.5 28.4 Median age for Black or African American residents28.2 28.8 -820,846,904.7 Median age for American Indian / Alaska Native residents-1,081,272,083.7 -696,340,256.5 25.9 Median age for Asian residents24.5 28.2 -744,336,568.8 Median age for Native Hawaiian / Pacific Islander residents-856,799,036.4 -534,959,349.1 21.9 Median age for Other race residents25.0 22.0 16.4 Median age for Two or more races residents17.3 14.0 42.6 Median age for White alone residents42.8 42.7 25.3 Median age for Hispanic or Latino residents29.4 25.1
Owner/renter occupied households by race in North St. Paul
House owners and renters - White residents 2,430 71.5% Owner occupied969 28.5% Renter occupiedHouse owners and renters - Black or African American residents 19 6.0% Owner occupied303 94.0% Renter occupiedHouse owners and renters - Asian residents 453 81.6% Owner occupied102 18.4% Renter occupiedHouse owners and renters - Other race residents 183 61.9% Owner occupied113 38.1% Renter occupiedHouse owners and renters - Two or more races residents 32 15.2% Owner occupied176 84.8% Renter occupiedHouse owners and renters - White alone residents 2,447 72.1% Owner occupied948 27.9% Renter occupiedHouse owners and renters - Hispanic or Latino residents 161 56.8% Owner occupied123 43.2% Renter occupied
Language usage in North St. Paul
English speakers - Total 77.0% of residents of North St. Paul speak English at home.
4.0% of residents speak Spanish at home 251 56.4% Speak English very well194 43.6% Speak English less than very well18.7% of residents speak other language at home 1,235 58.9% Speak English very well862 41.1% Speak English less than very well
English speakers - Born in the United States 74.9% of residents of North St. Paul speak English at home.
0.5% of residents speak Spanish at home 9 100.0% Speak English very well21.6% of residents speak other language at home 331 78.6% Speak English very well90 21.4% Speak English less than very well
English speakers - Native, born elsewhere 57.1% of residents of North St. Paul speak English at home.
27.6% of residents speak Spanish at home 43 50.6% Speak English very well42 49.4% Speak English less than very well7.8% of residents speak other language at home 24 100.0% Speak English very well
English speakers - Foreign-born 2.8% of residents of North St. Paul speak English at home.
10.5% of residents speak Spanish at home 137 100.0% Speak English less than very well87.2% of residents speak other language at home 412 36.3% Speak English very well722 63.7% Speak English less than very well
White (Caucasian) - Speak another language Native:
1.5% (103)Foreign-born:
77.5% (23)
Black or African American - Speak only English Native:
100.0% (630)Foreign-born:
7.2% (14)
Black or African American - Speak another language Native:
1.0% (7)Foreign-born:
94.2% (181)
Asian - Speak only English Native:
23.4% (290)Foreign-born:
2.5% (25)
Asian - Speak another language Native:
74.4% (919)Foreign-born:
97.0% (953)
Other race - Speak another language Native:
52.9% (277)Foreign-born:
99.3% (99)
Two or more races - Speak another language Native:
2.9% (26)Foreign-born:
100.0% (14)
White alone - Speak another language Native:
1.5% (99)Foreign-born:
91.4% (10)
Hispanic or Latino - Speak another language Native:
46.6% (250)Foreign-born:
99.7% (128)
Foreign-born residents in North St. Paul 1,371 residents are foreign born (8.0% Asia , 1.7% Africa ).
This city:
11.2%Minnesota:
8.5%
Marital status for residents in North St. Paul Marital status - White (Caucasian) population 15 years and over
Males 34.7% Never married50.0% Now married1.2% Separated3.0% Widowed11.0% DivorcedFemales 33.9% Never married44.1% Now married1.0% Separated11.2% Widowed9.7% DivorcedWomen who gave birth in the past 12 months Now married:
75.3% (101)Unmarried:
24.7% (33)
Women who did not give birth in the past 12 months Now married:
36.8% (512)Unmarried:
63.2% (878)
Marital status - Black or African American population 15 years and over
Males 65.9% Never married34.1% Now married0.0% Separated0.0% Widowed0.0% DivorcedFemales 49.6% Never married43.4% Now married0.0% Separated0.0% Widowed7.0% DivorcedWomen who gave birth in the past 12 months Now married:
76.1% (53)Unmarried:
23.9% (17)
Women who did not give birth in the past 12 months Now married:
20.6% (29)Unmarried:
79.4% (111)
Marital status - Asian population 15 years and over
Males 52.0% Never married45.0% Now married0.0% Separated2.9% Widowed0.0% DivorcedFemales 39.9% Never married42.6% Now married1.0% Separated8.4% Widowed8.1% DivorcedWomen who gave birth in the past 12 months Now married:
69.0% (20)Unmarried:
31.0% (9)
Women who did not give birth in the past 12 months Now married:
40.0% (249)Unmarried:
60.0% (374)
Marital status - Other race population 15 years and over
Males 53.5% Never married0.0% Now married46.5% Separated0.0% Widowed0.0% DivorcedFemales 76.7% Never married8.7% Now married0.0% Separated0.0% Widowed14.6% DivorcedWomen who gave birth in the past 12 months Now married:
0.0% (0)Unmarried:
100.0% (15)
Women who did not give birth in the past 12 months Now married:
3.8% (14)Unmarried:
96.2% (345)
Marital status - Two or more races population 15 years and over
Males 78.5% Never married11.2% Now married0.0% Separated0.0% Widowed10.3% DivorcedFemales 77.5% Never married4.4% Now married0.0% Separated6.2% Widowed11.9% DivorcedWomen who did not give birth in the past 12 months Now married:
5.4% (10)Unmarried:
94.6% (179)
Marital status - White alone, not Hispanic / Latino population 15 years and over
Males 34.1% Never married51.2% Now married0.3% Separated3.1% Widowed11.3% DivorcedFemales 33.8% Never married44.3% Now married0.7% Separated11.5% Widowed9.7% DivorcedWomen who gave birth in the past 12 months Now married:
75.3% (105)Unmarried:
24.7% (34)
Women who did not give birth in the past 12 months Now married:
36.7% (507)Unmarried:
63.3% (874)
Marital status - Hispanic or Latino population 15 years and over
Males 50.4% Never married11.7% Now married37.8% Separated0.0% Widowed0.0% DivorcedFemales 65.0% Never married18.3% Now married3.9% Separated0.0% Widowed12.9% DivorcedWomen who gave birth in the past 12 months Now married:
0.0% (0)Unmarried:
100.0% (9)
Women who did not give birth in the past 12 months Now married:
14.8% (42)Unmarried:
85.2% (241)
Ancestries in North St. Paul
728 14.5% German224 4.5% American171 3.4% Scandinavian163 3.2% Ethiopian150 3.0% Polish146 2.9% Norwegian133 2.6% English113 2.3% Irish111 2.2% Swedish93 1.9% European85 1.7% Italian77 1.5% French Canadian55 1.1% Hungarian48 1.0% Nigerian46 0.9% Czech38 0.8% Eastern European37 0.7% French35 0.7% African30 0.6% Northern European24 0.5% Greek18 0.4% Scottish11 0.2% Finnish11 0.2% Scotch-Irish11 0.2% Swiss8 0.2% Dutch5 0.10% Czechoslovakian
Children Nativity (place of birth) in North St. Paul
Children under 6 years - Living with two parents Both parents native 294 100.0% NativeBoth parents foreign-born 268 100.0% NativeOne native, one foreign-born parent 60 100.0% NativeChildren under 6 years - Living with one parent Native parent 670 100.0% NativeForeign-born parent 56 100.0% NativeChildren 6 to 17 years - Living with two parents Both parents native 534 100.0% NativeBoth parents foreign-born 205 72.8% Native76 27.2% Foreign-bornOne native, one foreign-born parent 35 100.0% NativeChildren 6 to 17 years - Living with one parent Native parent 817 100.0% NativeForeign-born parent 72 48.4% Native77 51.6% Foreign-born
Grandparents responsible for own grandchildren in North St. Paul
Grandparents (30 to 59 years) White / Caucasian 40 54.6% Responsible for grandchildren33 45.4% Not responsible for grandchildrenBlack or African American 13 100.0% Responsible for grandchildrenAsian 11 100.0% Not responsible for grandchildrenOther race 13 100.0% Responsible for grandchildrenWhite alone, not Hispanic / Latino 40 58.9% Responsible for grandchildren28 41.1% Not responsible for grandchildrenHispanic or Latino 8 100.0% Responsible for grandchildrenGrandparents (60 years and over) White / Caucasian 11 23.5% Responsible for grandchildren35 76.5% Not responsible for grandchildrenAsian 5 100.0% Not responsible for grandchildrenWhite alone, not Hispanic / Latino 13 31.6% Responsible for grandchildren28 68.4% Not responsible for grandchildrenHispanic or Latino 6 100.0% Not responsible for grandchildren