Races in Pearl City, Hawaii (HI) Detailed Stats
Data:
Races - White alone (%)
Races - White alone (% change since 2000)
Races - Black alone (%)
Races - Black alone (% change since 2000)
Races - American Indian alone (%)
Races - American Indian alone (% change since 2000)
Races - Asian alone (%)
Races - Asian alone (% change since 2000)
Races - Hispanic (%)
Races - Hispanic (% change since 2000)
Races - Native Hawaiian and Other Pacific Islander alone (%)
Races - Native Hawaiian and Other Pacific Islander alone (% change since 2000)
Races - Two or more races(%)
Races - Two or more races(% change since 2000)
Races - Other race alone (%)
Races - Other race alone (% change since 2000)
Racial diversity
Place of birth - Born in state of residence (%)
Place of birth - Born in state of residence (%) - White
Place of birth - Born in state of residence (%) - Black or African American
Place of birth - Born in state of residence (%) - Asian
Place of birth - Born in state of residence (%) - Hispanic or Latino
Place of birth - Born in state of residence (%) - American Indian and Alaska Native
Place of birth - Born in state of residence (%) - Multirace
Place of birth - Born in state of residence (%) - Other Race
Place of birth - Born in other state (%)
Place of birth - Born in other state (%) - White
Place of birth - Born in other state (%) - Black or African American
Place of birth - Born in other state (%) - Asian
Place of birth - Born in other state (%) - Hispanic or Latino
Place of birth - Born in other state (%) - American Indian and Alaska Native
Place of birth - Born in other state (%) - Multirace
Place of birth - Born in other state (%) - Other Race
Place of birth - Native, outside of US (%)
Place of birth - Native, outside of US (%) - White
Place of birth - Native, outside of US (%) - Black or African American
Place of birth - Native, outside of US (%) - Asian
Place of birth - Native, outside of US (%) - Hispanic or Latino
Place of birth - Native, outside of US (%) - American Indian and Alaska Native
Place of birth - Native, outside of US (%) - Multirace
Place of birth - Native, outside of US (%) - Other Race
Place of birth - Foreign born (%)
Place of birth - Foreign born (%) - White
Place of birth - Foreign born (%) - Black or African American
Place of birth - Foreign born (%) - Asian
Place of birth - Foreign born (%) - Hispanic or Latino
Place of birth - Foreign born (%) - American Indian and Alaska Native
Place of birth - Foreign born (%) - Multirace
Place of birth - Foreign born (%) - Other Race
Residents speaking English at home (%)
Residents speaking English at home - Born in the United States (%)
Residents speaking English at home - Native, born elsewhere (%)
Residents speaking English at home - Foreign born (%)
Residents speaking Spanish at home (%)
Residents speaking Spanish at home - Born in the United States (%)
Residents speaking Spanish at home - Native, born elsewhere (%)
Residents speaking Spanish at home - Foreign born (%)
Residents speaking other language at home (%)
Residents speaking other language at home - Born in the United States (%)
Residents speaking other language at home - Native, born elsewhere (%)
Residents speaking other language at home - Foreign born (%)
Marital status - Never married (%)
Marital status - Now married (%)
Marital status - Separated (%)
Marital status - Widowed (%)
Marital status - Divorced (%)
Ancestries Reported - Arab (%)
Ancestries Reported - Czech (%)
Ancestries Reported - Danish (%)
Ancestries Reported - Dutch (%)
Ancestries Reported - English (%)
Ancestries Reported - French (%)
Ancestries Reported - French Canadian (%)
Ancestries Reported - German (%)
Ancestries Reported - Greek (%)
Ancestries Reported - Hungarian (%)
Ancestries Reported - Irish (%)
Ancestries Reported - Italian (%)
Ancestries Reported - Lithuanian (%)
Ancestries Reported - Norwegian (%)
Ancestries Reported - Polish (%)
Ancestries Reported - Portuguese (%)
Ancestries Reported - Russian (%)
Ancestries Reported - Scotch-Irish (%)
Ancestries Reported - Scottish (%)
Ancestries Reported - Slovak (%)
Ancestries Reported - Subsaharan African (%)
Ancestries Reported - Swedish (%)
Ancestries Reported - Swiss (%)
Ancestries Reported - Ukrainian (%)
Ancestries Reported - United States (%)
Ancestries Reported - Welsh (%)
Ancestries Reported - West Indian (%)
Ancestries Reported - Other (%)
Geographical mobility - Same house 1 year ago (%)
Geographical mobility - Same house 1 year ago (%) - White
Geographical mobility - Same house 1 year ago (%) - Black or African American
Geographical mobility - Same house 1 year ago (%) - Asian
Geographical mobility - Same house 1 year ago (%) - Hispanic or Latino
Geographical mobility - Same house 1 year ago (%) - American Indian and Alaska Native
Geographical mobility - Same house 1 year ago (%) - Multirace
Geographical mobility - Same house 1 year ago (%) - Other Race
Geographical mobility - Moved within same county (%)
Geographical mobility - Moved within same county (%) - White
Geographical mobility - Moved within same county (%) - Black or African American
Geographical mobility - Moved within same county (%) - Asian
Geographical mobility - Moved within same county (%) - Hispanic or Latino
Geographical mobility - Moved within same county (%) - American Indian and Alaska Native
Geographical mobility - Moved within same county (%) - Multirace
Geographical mobility - Moved within same county (%) - Other Race
Geographical mobility - Moved from different county within same state (%)
Geographical mobility - Moved from different county within same state (%) - White
Geographical mobility - Moved from different county within same state (%) - Black or African American
Geographical mobility - Moved from different county within same state (%) - Asian
Geographical mobility - Moved from different county within same state (%) - Hispanic or Latino
Geographical mobility - Moved from different county within same state (%) - American Indian and Alaska Native
Geographical mobility - Moved from different county within same state (%) - Multirace
Geographical mobility - Moved from different county within same state (%) - Other Race
Geographical mobility - Moved from different state (%)
Geographical mobility - Moved from different state (%) - White
Geographical mobility - Moved from different state (%) - Black or African American
Geographical mobility - Moved from different state (%) - Asian
Geographical mobility - Moved from different state (%) - Hispanic or Latino
Geographical mobility - Moved from different state (%) - American Indian and Alaska Native
Geographical mobility - Moved from different state (%) - Multirace
Geographical mobility - Moved from different state (%) - Other Race
Geographical mobility - Moved from abroad (%)
Geographical mobility - Moved from abroad (%) - White
Geographical mobility - Moved from abroad (%) - Black or African American
Geographical mobility - Moved from abroad (%) - Asian
Geographical mobility - Moved from abroad (%) - Hispanic or Latino
Geographical mobility - Moved from abroad (%) - American Indian and Alaska Native
Geographical mobility - Moved from abroad (%) - Multirace
Geographical mobility - Moved from abroad (%) - Other Race
Place of birth for the foreign-born population - Ireland (%)
Place of birth for the foreign-born population - Denmark (%)
Place of birth for the foreign-born population - Norway (%)
Place of birth for the foreign-born population - Sweden (%)
Place of birth for the foreign-born population - United Kingdom (%)
Place of birth for the foreign-born population - England (%)
Place of birth for the foreign-born population - Scotland (%)
Place of birth for the foreign-born population - Other Northern Europe (%)
Place of birth for the foreign-born population - Austria (%)
Place of birth for the foreign-born population - Belgium (%)
Place of birth for the foreign-born population - France (%)
Place of birth for the foreign-born population - Germany (%)
Place of birth for the foreign-born population - Netherlands (%)
Place of birth for the foreign-born population - Switzerland (%)
Place of birth for the foreign-born population - Other Western Europe (%)
Place of birth for the foreign-born population - Greece (%)
Place of birth for the foreign-born population - Italy (%)
Place of birth for the foreign-born population - Portugal (%)
Place of birth for the foreign-born population - Spain (%)
Place of birth for the foreign-born population - Other Southern Europe (%)
Place of birth for the foreign-born population - Albania (%)
Place of birth for the foreign-born population - Belarus (%)
Place of birth for the foreign-born population - Bosnia and Herzegovina (%)
Place of birth for the foreign-born population - Bulgaria (%)
Place of birth for the foreign-born population - Croatia (%)
Place of birth for the foreign-born population - Czechoslovakia (%)
Place of birth for the foreign-born population - Hungary (%)
Place of birth for the foreign-born population - Latvia (%)
Place of birth for the foreign-born population - Lithuania (%)
Place of birth for the foreign-born population - North Macedonia (Macedonia) (%)
Place of birth for the foreign-born population - Moldova (%)
Place of birth for the foreign-born population - Poland (%)
Place of birth for the foreign-born population - Romania (%)
Place of birth for the foreign-born population - Russia (%)
Place of birth for the foreign-born population - Serbia (%)
Place of birth for the foreign-born population - Ukraine (%)
Place of birth for the foreign-born population - Other Eastern Europe (%)
Place of birth for the foreign-born population - China (%)
Place of birth for the foreign-born population - Hong Kong (%)
Place of birth for the foreign-born population - Taiwan (%)
Place of birth for the foreign-born population - Japan (%)
Place of birth for the foreign-born population - Korea (%)
Place of birth for the foreign-born population - Other Eastern Asia (%)
Place of birth for the foreign-born population - Afghanistan (%)
Place of birth for the foreign-born population - Bangladesh (%)
Place of birth for the foreign-born population - India (%)
Place of birth for the foreign-born population - Iran (%)
Place of birth for the foreign-born population - Kazakhstan (%)
Place of birth for the foreign-born population - Nepal (%)
Place of birth for the foreign-born population - Pakistan (%)
Place of birth for the foreign-born population - Sri Lanka (%)
Place of birth for the foreign-born population - Uzbekistan (%)
Place of birth for the foreign-born population - Other South Central Asia (%)
Place of birth for the foreign-born population - Burma (%)
Place of birth for the foreign-born population - Cambodia (%)
Place of birth for the foreign-born population - Indonesia (%)
Place of birth for the foreign-born population - Laos (%)
Place of birth for the foreign-born population - Malaysia (%)
Place of birth for the foreign-born population - Philippines (%)
Place of birth for the foreign-born population - Singapore (%)
Place of birth for the foreign-born population - Thailand (%)
Place of birth for the foreign-born population - Vietnam (%)
Place of birth for the foreign-born population - Other South Eastern Asia (%)
Place of birth for the foreign-born population - Armenia (%)
Place of birth for the foreign-born population - Iraq (%)
Place of birth for the foreign-born population - Israel (%)
Place of birth for the foreign-born population - Jordan (%)
Place of birth for the foreign-born population - Kuwait (%)
Place of birth for the foreign-born population - Lebanon (%)
Place of birth for the foreign-born population - Saudi Arabia (%)
Place of birth for the foreign-born population - Syria (%)
Place of birth for the foreign-born population - Turkey (%)
Place of birth for the foreign-born population - Yemen (%)
Place of birth for the foreign-born population - Other Western Asia (%)
Place of birth for the foreign-born population - Eritrea (%)
Place of birth for the foreign-born population - Ethiopia (%)
Place of birth for the foreign-born population - Kenya (%)
Place of birth for the foreign-born population - Somalia (%)
Place of birth for the foreign-born population - Uganda (%)
Place of birth for the foreign-born population - Zimbabwe (%)
Place of birth for the foreign-born population - Other Eastern Africa (%)
Place of birth for the foreign-born population - Cameroon (%)
Place of birth for the foreign-born population - Congo (%)
Place of birth for the foreign-born population - Democratic Republic of Congo (Zaire) (%)
Place of birth for the foreign-born population - Other Middle Africa (%)
Place of birth for the foreign-born population - Egypt (%)
Place of birth for the foreign-born population - Morocco (%)
Place of birth for the foreign-born population - Sudan (%)
Place of birth for the foreign-born population - Other Northern Africa (%)
Place of birth for the foreign-born population - South Africa (%)
Place of birth for the foreign-born population - Other Southern Africa (%)
Place of birth for the foreign-born population - Cabo Verde (%)
Place of birth for the foreign-born population - Ghana (%)
Place of birth for the foreign-born population - Liberia (%)
Place of birth for the foreign-born population - Nigeria (%)
Place of birth for the foreign-born population - Senegal (%)
Place of birth for the foreign-born population - Sierra Leone (%)
Place of birth for the foreign-born population - Other Western Africa (%)
Place of birth for the foreign-born population - Australia (%)
Place of birth for the foreign-born population - New Zealand (%)
Place of birth for the foreign-born population - Fiji (%)
Place of birth for the foreign-born population - Micronesia (%)
Place of birth for the foreign-born population - Bahamas (%)
Place of birth for the foreign-born population - Barbados (%)
Place of birth for the foreign-born population - Cuba (%)
Place of birth for the foreign-born population - Dominica (%)
Place of birth for the foreign-born population - Dominican Republic (%)
Place of birth for the foreign-born population - Grenada (%)
Place of birth for the foreign-born population - Haiti (%)
Place of birth for the foreign-born population - Jamaica (%)
Place of birth for the foreign-born population - St. Vincent and the Grenadines (%)
Place of birth for the foreign-born population - Trinidad and Tobago (%)
Place of birth for the foreign-born population - West Indies (%)
Place of birth for the foreign-born population - Other Caribbean (%)
Place of birth for the foreign-born population - Belize (%)
Place of birth for the foreign-born population - Costa Rica (%)
Place of birth for the foreign-born population - El Salvador (%)
Place of birth for the foreign-born population - Guatemala (%)
Place of birth for the foreign-born population - Honduras (%)
Place of birth for the foreign-born population - Mexico (%)
Place of birth for the foreign-born population - Nicaragua (%)
Place of birth for the foreign-born population - Panama (%)
Place of birth for the foreign-born population - Other Central America (%)
Place of birth for the foreign-born population - Argentina (%)
Place of birth for the foreign-born population - Bolivia (%)
Place of birth for the foreign-born population - Brazil (%)
Place of birth for the foreign-born population - Chile (%)
Place of birth for the foreign-born population - Colombia (%)
Place of birth for the foreign-born population - Ecuador (%)
Place of birth for the foreign-born population - Guyana (%)
Place of birth for the foreign-born population - Peru (%)
Place of birth for the foreign-born population - Uruguay (%)
Place of birth for the foreign-born population - Venezuela (%)
Place of birth for the foreign-born population - Other South America (%)
Place of birth for the foreign-born population - Canada (%)
Place of birth for the foreign-born population - Other Northern America (%)
Place of birth for the foreign-born population - Other (%)
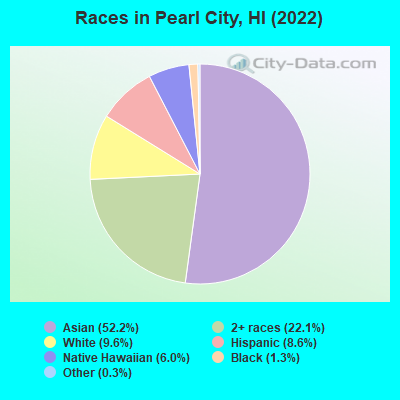
According to 2022 data, the most numerous races in Pearl City, HI are Asian alone (24,102 residents), Two or more races (10,208 residents), and White alone (4,434 residents). 80.5% of Pearl City residents speak English at home. 16.0% of Pearl City, HI residents are foreign-born (12.7% born in Asia, 2.1% born in Oceania), which is 12.6% less than the foreign-born rate of 18.0% across the entire state of Hawaii.
Race distribution in Pearl City
2000 2022
16,215 52.3% Asian alone 4,952 16.0% White alone 4,820 15.6% Two or more races 2,260 7.3% Hispanic 1,815 5.9% Native Hawaiian and Other 796 2.6% Black alone 56 0.2% Other race alone 62 0.2% American Indian alone
24,102 52.2% Asian alone 10,208 22.1% Two or more races 4,434 9.6% White alone 3,974 8.6% Hispanic 2,755 6.0% Native Hawaiian and Other 613 1.3% Black alone 131 0.3% Other race alone 5 0.01% American Indian alone
2000 2022
494,149 40.8% Asian alone 277,091 22.9% White alone 218,700 18.1% Two or more races 108,441 9.0% Native Hawaiian and Other 87,699 7.2% Hispanic 20,829 1.7% Black alone 2,089 0.2% Other race alone 2,539 0.2% American Indian alone
498,125 34.6% Asian alone 318,574 22.1% Two or more races 297,937 20.7% White alone 160,103 11.1% Hispanic 134,567 9.3% Native Hawaiian and Other 23,682 1.6% Black alone 5,378 0.4% Other race alone 1,830 0.1% American Indian alone
Income and house value in Pearl City Median household income in 2022 $94,633 White non-Hispanic householders$71,672 Black householders$122,080 Asian householders$76,457 Native Hawaiian and other Pacific Islander householders$81,368 Some other race householders$118,734 Two or more races householders$72,854 Hispanic or Latino race householdersMedian 2022 house value $870,084 White Non-Hispanic householders$729,121 Black or African American householders$607,601 American Indian or Alaska Native householders $900,869 Asian householders$966,976 Native Hawaiian and other Pacific Islander householdersover $1,000,000 Some other race householders$882,074 Two or more races householders$939,108 Hispanic or Latino householders
Median age by race in Pearl City
40.2 Median age for White residents36.7 46.3 32.1 Median age for Black or African American residents32.2 36.8 27.4 Median age for American Indian / Alaska Native residents-715,953,306.7 5.5 56.3 Median age for Asian residents53.5 58.2 38.0 Median age for Native Hawaiian / Pacific Islander residents33.3 39.6 26.5 Median age for Other race residents26.4 27.4 29.9 Median age for Two or more races residents29.5 29.7 40.1 Median age for White alone residents37.0 45.6 25.0 Median age for Hispanic or Latino residents26.0 23.8
Owner/renter occupied households by race in Pearl City
House owners and renters - White residents 994 46.2% Owner occupied1,160 53.8% Renter occupiedHouse owners and renters - Black or African American residents 48 15.6% Owner occupied259 84.4% Renter occupiedHouse owners and renters - American Indian / Alaska Native residents 7 100.0% Renter occupiedHouse owners and renters - Asian residents 7,505 86.1% Owner occupied1,216 13.9% Renter occupiedHouse owners and renters - Native Hawaiian / Pacific Islander residents 226 33.2% Owner occupied456 66.8% Renter occupiedHouse owners and renters - Other race residents 124 46.9% Owner occupied140 53.1% Renter occupiedHouse owners and renters - Two or more races residents 2,055 63.8% Owner occupied1,168 36.2% Renter occupiedHouse owners and renters - White alone residents 935 46.1% Owner occupied1,093 53.9% Renter occupiedHouse owners and renters - Hispanic or Latino residents 424 42.8% Owner occupied567 57.2% Renter occupied
Language usage in Pearl City
English speakers - Total 80.5% of residents of Pearl City speak English at home.
1.5% of residents speak Spanish at home 595 87.4% Speak English very well86 12.6% Speak English less than very well18.3% of residents speak other language at home 4,295 53.3% Speak English very well3,766 46.7% Speak English less than very well
English speakers - Born in the United States 88.5% of residents of Pearl City speak English at home.
7.3% of residents speak Spanish at home 519 96.6% Speak English very well18 3.4% Speak English less than very well4.1% of residents speak other language at home 262 87.6% Speak English very well37 12.4% Speak English less than very well
English speakers - Native, born elsewhere 75.3% of residents of Pearl City speak English at home.
3.9% of residents speak Spanish at home 32 68.1% Speak English very well15 31.9% Speak English less than very well22.4% of residents speak other language at home 158 59.0% Speak English very well110 41.0% Speak English less than very well
English speakers - Foreign-born 19.6% of residents of Pearl City speak English at home.
1.2% of residents speak Spanish at home 29 34.1% Speak English very well56 65.9% Speak English less than very well79.3% of residents speak other language at home 2,152 39.2% Speak English very well3,337 60.8% Speak English less than very well
White (Caucasian) - Speak only English Native:
92.8% (4,080)Foreign-born:
36.5% (69)
White (Caucasian) - Speak another language Native:
6.8% (297)Foreign-born:
60.9% (115)
Black or African American - Speak only English Native:
96.9% (566)Foreign-born:
100.0% (29)
Asian - Speak only English Native:
91.6% (16,898)Foreign-born:
17.5% (977)
Asian - Speak another language Native:
8.8% (1,619)Foreign-born:
82.5% (4,598)
Native Hawaiian / Pacific Islander - Speak only English Native:
91.0% (1,796)Foreign-born:
15.1% (129)
Native Hawaiian / Pacific Islander - Speak another language Native:
10.2% (201)Foreign-born:
84.7% (724)
Other race - Speak only English Native:
67.0% (568)Foreign-born:
38.0% (41)
Other race - Speak another language Native:
32.6% (276)Foreign-born:
65.3% (71)
Two or more races - Speak only English Native:
93.0% (10,269)Foreign-born:
47.7% (72)
Two or more races - Speak another language Native:
6.9% (766)Foreign-born:
52.7% (80)
White alone - Speak only English Native:
94.0% (3,898)Foreign-born:
42.5% (70)
White alone - Speak another language Native:
5.9% (243)Foreign-born:
57.4% (94)
Hispanic or Latino - Speak only English Native:
82.4% (2,776)Foreign-born:
26.7% (36)
Hispanic or Latino - Speak another language Native:
17.6% (593)Foreign-born:
74.6% (100)
Foreign-born residents in Pearl City 7,374 residents are foreign born (12.7% Asia , 2.1% Oceania ).
This city:
16.0%Hawaii:
18.0%
Marital status for residents in Pearl City Marital status - White (Caucasian) population 15 years and over
Males 32.7% Never married60.3% Now married0.6% Separated0.6% Widowed5.8% DivorcedFemales 15.0% Never married56.7% Now married0.0% Separated12.0% Widowed16.3% DivorcedWomen who gave birth in the past 12 months Now married:
100.0% (34)Unmarried:
0.0% (0)
Women who did not give birth in the past 12 months Now married:
53.4% (416)Unmarried:
46.6% (362)
Marital status - Black or African American population 15 years and over
Males 38.9% Never married56.8% Now married0.0% Separated0.0% Widowed4.3% DivorcedFemales 6.8% Never married66.9% Now married0.0% Separated3.4% Widowed22.9% DivorcedWomen who gave birth in the past 12 months Now married:
100.0% (25)Unmarried:
0.0% (0)
Women who did not give birth in the past 12 months Now married:
63.6% (101)Unmarried:
36.4% (57)
Marital status - American Indian / Alaska Native population 15 years and over
Males 0.0% Never married0.0% Now married0.0% Separated0.0% Widowed100.0% DivorcedFemales 0.0% Never married50.0% Now married0.0% Separated0.0% Widowed50.0% DivorcedWomen who gave birth in the past 12 months Now married:
50.0% (8)Unmarried:
50.0% (8)
Marital status - Asian population 15 years and over
Males 32.4% Never married58.1% Now married1.4% Separated3.1% Widowed5.0% DivorcedFemales 22.9% Never married51.6% Now married0.6% Separated15.1% Widowed9.8% DivorcedWomen who gave birth in the past 12 months Now married:
81.0% (158)Unmarried:
19.0% (37)
Women who did not give birth in the past 12 months Now married:
47.9% (1,958)Unmarried:
52.1% (2,129)
Marital status - Native Hawaiian / Pacific Islander population 15 years and over
Males 37.1% Never married47.8% Now married1.2% Separated9.4% Widowed4.6% DivorcedFemales 50.9% Never married36.7% Now married2.3% Separated6.6% Widowed3.4% DivorcedWomen who gave birth in the past 12 months Now married:
74.4% (28)Unmarried:
25.6% (10)
Women who did not give birth in the past 12 months Now married:
32.9% (230)Unmarried:
67.1% (470)
Marital status - Other race population 15 years and over
Males 38.1% Never married61.9% Now married0.0% Separated0.0% Widowed0.0% DivorcedFemales 32.0% Never married50.4% Now married0.0% Separated5.3% Widowed12.2% DivorcedWomen who gave birth in the past 12 months Now married:
66.7% (55)Unmarried:
33.3% (27)
Women who did not give birth in the past 12 months Now married:
48.1% (126)Unmarried:
51.9% (136)
Marital status - Two or more races population 15 years and over
Males 48.6% Never married43.7% Now married0.2% Separated1.2% Widowed6.3% DivorcedFemales 41.3% Never married43.1% Now married1.2% Separated4.4% Widowed10.1% DivorcedWomen who gave birth in the past 12 months Now married:
33.1% (45)Unmarried:
66.9% (90)
Women who did not give birth in the past 12 months Now married:
37.7% (937)Unmarried:
62.3% (1,548)
Marital status - White alone, not Hispanic / Latino population 15 years and over
Males 33.6% Never married59.4% Now married0.6% Separated0.7% Widowed5.7% DivorcedFemales 16.3% Never married53.8% Now married0.0% Separated12.9% Widowed17.0% DivorcedWomen who gave birth in the past 12 months Now married:
100.0% (35)Unmarried:
0.0% (0)
Women who did not give birth in the past 12 months Now married:
49.4% (364)Unmarried:
50.6% (373)
Marital status - Hispanic or Latino population 15 years and over
Males 46.5% Never married50.6% Now married0.0% Separated0.0% Widowed2.9% DivorcedFemales 43.6% Never married44.1% Now married0.0% Separated4.0% Widowed8.2% DivorcedWomen who gave birth in the past 12 months Now married:
45.1% (51)Unmarried:
54.9% (62)
Women who did not give birth in the past 12 months Now married:
40.4% (369)Unmarried:
59.6% (544)
Ancestries in Pearl City
233 0.9% English160 0.6% Portuguese150 0.6% German127 0.5% American122 0.5% Jamaican62 0.2% Dutch61 0.2% Norwegian55 0.2% Irish47 0.2% French42 0.2% Italian33 0.1% Greek32 0.1% Swedish27 0.1% European26 0.1% Russian25 0.10% Brazilian24 0.09% Polish23 0.09% Hungarian20 0.08% French Canadian16 0.06% Yugoslavian11 0.04% Northern European9 0.03% Scotch-Irish8 0.03% African7 0.03% Australian6 0.02% Swiss4 0.02% British3 0.01% Danish3 0.01% Scottish2 0.01% Arab2 0.01% Finnish
Geographical mobility in Pearl City Same house 1 year ago 3,758 80.1% White (Caucasian)298 47.5% Black or African American43 100.0% American Indian / Alaska Native22,309 91.8% Asian2,454 86.4% Native Hawaiian / Pacific Islander808 75.5% Other race10,929 87.7% Two or more races3,467 78.7% White alone, not Hispanic / Latino3,360 86.3% Hispanic or LatinoMoved within same county 372 7.9% White / Caucasian126 20.1% Black or African American1,694 7.0% Asian293 10.3% Native Hawaiian / Pacific Islander73 6.9% Other race1,105 8.9% Two or more races363 8.3% White alone, not Hispanic / Latino309 7.9% Hispanic or LatinoMoved within same state 326 6.9% White / Caucasian52 0.2% Asian25 0.2% Two or more races324 7.4% White alone, not Hispanic / LatinoMoved from different state 399 8.5% White / Caucasian226 36.0% Black or African American175 0.7% Asian129 12.1% Other race302 2.4% Two or more races402 9.1% White alone, not Hispanic / Latino207 5.3% Hispanic or LatinoMoved from abroad 9 0.2% White67 0.3% Asian101 3.6% Native Hawaiian / Pacific Islander38 0.3% Two or more races10 0.2% White alone, not Hispanic / Latino
Children Nativity (place of birth) in Pearl City
Children under 6 years - Living with two parents Both parents native 1,264 99.9% Native1 0.1% Foreign-bornBoth parents foreign-born 123 95.0% Native6 5.0% Foreign-bornOne native, one foreign-born parent 158 100.0% NativeChildren under 6 years - Living with one parent Native parent 836 100.0% NativeForeign-born parent 21 100.0% NativeChildren 6 to 17 years - Living with two parents Both parents native 2,370 98.6% Native33 1.4% Foreign-bornBoth parents foreign-born 556 88.2% Native74 11.8% Foreign-bornOne native, one foreign-born parent 511 98.6% Native7 1.4% Foreign-bornChildren 6 to 17 years - Living with one parent Native parent 1,553 100.0% NativeForeign-born parent 254 55.7% Native202 44.3% Foreign-born
Grandparents responsible for own grandchildren in Pearl City
Grandparents (30 to 59 years) White / Caucasian 7 100.0% Not responsible for grandchildrenAsian 59 23.2% Responsible for grandchildren195 76.8% Not responsible for grandchildrenNative Hawaiian / Pacific Islander 12 37.9% Responsible for grandchildren20 62.1% Not responsible for grandchildrenOther race 51 100.0% Not responsible for grandchildrenTwo or more races 5 2.8% Responsible for grandchildren156 97.2% Not responsible for grandchildrenHispanic or Latino 34 100.0% Not responsible for grandchildrenGrandparents (60 years and over) White / Caucasian 6 5.2% Responsible for grandchildren102 94.8% Not responsible for grandchildrenAsian 84 9.4% Responsible for grandchildren811 90.6% Not responsible for grandchildrenNative Hawaiian / Pacific Islander 50 35.8% Responsible for grandchildren89 64.2% Not responsible for grandchildrenOther race 44 100.0% Not responsible for grandchildrenTwo or more races 198 38.9% Responsible for grandchildren310 61.1% Not responsible for grandchildrenHispanic or Latino 1 1.3% Responsible for grandchildren109 98.7% Not responsible for grandchildren