Races in Red Bank, New Jersey (NJ) Detailed Stats
Data:
Races - White alone (%)
Races - White alone (% change since 2000)
Races - Black alone (%)
Races - Black alone (% change since 2000)
Races - American Indian alone (%)
Races - American Indian alone (% change since 2000)
Races - Asian alone (%)
Races - Asian alone (% change since 2000)
Races - Hispanic (%)
Races - Hispanic (% change since 2000)
Races - Native Hawaiian and Other Pacific Islander alone (%)
Races - Native Hawaiian and Other Pacific Islander alone (% change since 2000)
Races - Two or more races(%)
Races - Two or more races(% change since 2000)
Races - Other race alone (%)
Races - Other race alone (% change since 2000)
Racial diversity
Place of birth - Born in state of residence (%)
Place of birth - Born in state of residence (%) - White
Place of birth - Born in state of residence (%) - Black or African American
Place of birth - Born in state of residence (%) - Asian
Place of birth - Born in state of residence (%) - Hispanic or Latino
Place of birth - Born in state of residence (%) - American Indian and Alaska Native
Place of birth - Born in state of residence (%) - Multirace
Place of birth - Born in state of residence (%) - Other Race
Place of birth - Born in other state (%)
Place of birth - Born in other state (%) - White
Place of birth - Born in other state (%) - Black or African American
Place of birth - Born in other state (%) - Asian
Place of birth - Born in other state (%) - Hispanic or Latino
Place of birth - Born in other state (%) - American Indian and Alaska Native
Place of birth - Born in other state (%) - Multirace
Place of birth - Born in other state (%) - Other Race
Place of birth - Native, outside of US (%)
Place of birth - Native, outside of US (%) - White
Place of birth - Native, outside of US (%) - Black or African American
Place of birth - Native, outside of US (%) - Asian
Place of birth - Native, outside of US (%) - Hispanic or Latino
Place of birth - Native, outside of US (%) - American Indian and Alaska Native
Place of birth - Native, outside of US (%) - Multirace
Place of birth - Native, outside of US (%) - Other Race
Place of birth - Foreign born (%)
Place of birth - Foreign born (%) - White
Place of birth - Foreign born (%) - Black or African American
Place of birth - Foreign born (%) - Asian
Place of birth - Foreign born (%) - Hispanic or Latino
Place of birth - Foreign born (%) - American Indian and Alaska Native
Place of birth - Foreign born (%) - Multirace
Place of birth - Foreign born (%) - Other Race
Residents speaking English at home (%)
Residents speaking English at home - Born in the United States (%)
Residents speaking English at home - Native, born elsewhere (%)
Residents speaking English at home - Foreign born (%)
Residents speaking Spanish at home (%)
Residents speaking Spanish at home - Born in the United States (%)
Residents speaking Spanish at home - Native, born elsewhere (%)
Residents speaking Spanish at home - Foreign born (%)
Residents speaking other language at home (%)
Residents speaking other language at home - Born in the United States (%)
Residents speaking other language at home - Native, born elsewhere (%)
Residents speaking other language at home - Foreign born (%)
Marital status - Never married (%)
Marital status - Now married (%)
Marital status - Separated (%)
Marital status - Widowed (%)
Marital status - Divorced (%)
Ancestries Reported - Arab (%)
Ancestries Reported - Czech (%)
Ancestries Reported - Danish (%)
Ancestries Reported - Dutch (%)
Ancestries Reported - English (%)
Ancestries Reported - French (%)
Ancestries Reported - French Canadian (%)
Ancestries Reported - German (%)
Ancestries Reported - Greek (%)
Ancestries Reported - Hungarian (%)
Ancestries Reported - Irish (%)
Ancestries Reported - Italian (%)
Ancestries Reported - Lithuanian (%)
Ancestries Reported - Norwegian (%)
Ancestries Reported - Polish (%)
Ancestries Reported - Portuguese (%)
Ancestries Reported - Russian (%)
Ancestries Reported - Scotch-Irish (%)
Ancestries Reported - Scottish (%)
Ancestries Reported - Slovak (%)
Ancestries Reported - Subsaharan African (%)
Ancestries Reported - Swedish (%)
Ancestries Reported - Swiss (%)
Ancestries Reported - Ukrainian (%)
Ancestries Reported - United States (%)
Ancestries Reported - Welsh (%)
Ancestries Reported - West Indian (%)
Ancestries Reported - Other (%)
Geographical mobility - Same house 1 year ago (%)
Geographical mobility - Same house 1 year ago (%) - White
Geographical mobility - Same house 1 year ago (%) - Black or African American
Geographical mobility - Same house 1 year ago (%) - Asian
Geographical mobility - Same house 1 year ago (%) - Hispanic or Latino
Geographical mobility - Same house 1 year ago (%) - American Indian and Alaska Native
Geographical mobility - Same house 1 year ago (%) - Multirace
Geographical mobility - Same house 1 year ago (%) - Other Race
Geographical mobility - Moved within same county (%)
Geographical mobility - Moved within same county (%) - White
Geographical mobility - Moved within same county (%) - Black or African American
Geographical mobility - Moved within same county (%) - Asian
Geographical mobility - Moved within same county (%) - Hispanic or Latino
Geographical mobility - Moved within same county (%) - American Indian and Alaska Native
Geographical mobility - Moved within same county (%) - Multirace
Geographical mobility - Moved within same county (%) - Other Race
Geographical mobility - Moved from different county within same state (%)
Geographical mobility - Moved from different county within same state (%) - White
Geographical mobility - Moved from different county within same state (%) - Black or African American
Geographical mobility - Moved from different county within same state (%) - Asian
Geographical mobility - Moved from different county within same state (%) - Hispanic or Latino
Geographical mobility - Moved from different county within same state (%) - American Indian and Alaska Native
Geographical mobility - Moved from different county within same state (%) - Multirace
Geographical mobility - Moved from different county within same state (%) - Other Race
Geographical mobility - Moved from different state (%)
Geographical mobility - Moved from different state (%) - White
Geographical mobility - Moved from different state (%) - Black or African American
Geographical mobility - Moved from different state (%) - Asian
Geographical mobility - Moved from different state (%) - Hispanic or Latino
Geographical mobility - Moved from different state (%) - American Indian and Alaska Native
Geographical mobility - Moved from different state (%) - Multirace
Geographical mobility - Moved from different state (%) - Other Race
Geographical mobility - Moved from abroad (%)
Geographical mobility - Moved from abroad (%) - White
Geographical mobility - Moved from abroad (%) - Black or African American
Geographical mobility - Moved from abroad (%) - Asian
Geographical mobility - Moved from abroad (%) - Hispanic or Latino
Geographical mobility - Moved from abroad (%) - American Indian and Alaska Native
Geographical mobility - Moved from abroad (%) - Multirace
Geographical mobility - Moved from abroad (%) - Other Race
Place of birth for the foreign-born population - Ireland (%)
Place of birth for the foreign-born population - Denmark (%)
Place of birth for the foreign-born population - Norway (%)
Place of birth for the foreign-born population - Sweden (%)
Place of birth for the foreign-born population - United Kingdom (%)
Place of birth for the foreign-born population - England (%)
Place of birth for the foreign-born population - Scotland (%)
Place of birth for the foreign-born population - Other Northern Europe (%)
Place of birth for the foreign-born population - Austria (%)
Place of birth for the foreign-born population - Belgium (%)
Place of birth for the foreign-born population - France (%)
Place of birth for the foreign-born population - Germany (%)
Place of birth for the foreign-born population - Netherlands (%)
Place of birth for the foreign-born population - Switzerland (%)
Place of birth for the foreign-born population - Other Western Europe (%)
Place of birth for the foreign-born population - Greece (%)
Place of birth for the foreign-born population - Italy (%)
Place of birth for the foreign-born population - Portugal (%)
Place of birth for the foreign-born population - Spain (%)
Place of birth for the foreign-born population - Other Southern Europe (%)
Place of birth for the foreign-born population - Albania (%)
Place of birth for the foreign-born population - Belarus (%)
Place of birth for the foreign-born population - Bosnia and Herzegovina (%)
Place of birth for the foreign-born population - Bulgaria (%)
Place of birth for the foreign-born population - Croatia (%)
Place of birth for the foreign-born population - Czechoslovakia (%)
Place of birth for the foreign-born population - Hungary (%)
Place of birth for the foreign-born population - Latvia (%)
Place of birth for the foreign-born population - Lithuania (%)
Place of birth for the foreign-born population - North Macedonia (Macedonia) (%)
Place of birth for the foreign-born population - Moldova (%)
Place of birth for the foreign-born population - Poland (%)
Place of birth for the foreign-born population - Romania (%)
Place of birth for the foreign-born population - Russia (%)
Place of birth for the foreign-born population - Serbia (%)
Place of birth for the foreign-born population - Ukraine (%)
Place of birth for the foreign-born population - Other Eastern Europe (%)
Place of birth for the foreign-born population - China (%)
Place of birth for the foreign-born population - Hong Kong (%)
Place of birth for the foreign-born population - Taiwan (%)
Place of birth for the foreign-born population - Japan (%)
Place of birth for the foreign-born population - Korea (%)
Place of birth for the foreign-born population - Other Eastern Asia (%)
Place of birth for the foreign-born population - Afghanistan (%)
Place of birth for the foreign-born population - Bangladesh (%)
Place of birth for the foreign-born population - India (%)
Place of birth for the foreign-born population - Iran (%)
Place of birth for the foreign-born population - Kazakhstan (%)
Place of birth for the foreign-born population - Nepal (%)
Place of birth for the foreign-born population - Pakistan (%)
Place of birth for the foreign-born population - Sri Lanka (%)
Place of birth for the foreign-born population - Uzbekistan (%)
Place of birth for the foreign-born population - Other South Central Asia (%)
Place of birth for the foreign-born population - Burma (%)
Place of birth for the foreign-born population - Cambodia (%)
Place of birth for the foreign-born population - Indonesia (%)
Place of birth for the foreign-born population - Laos (%)
Place of birth for the foreign-born population - Malaysia (%)
Place of birth for the foreign-born population - Philippines (%)
Place of birth for the foreign-born population - Singapore (%)
Place of birth for the foreign-born population - Thailand (%)
Place of birth for the foreign-born population - Vietnam (%)
Place of birth for the foreign-born population - Other South Eastern Asia (%)
Place of birth for the foreign-born population - Armenia (%)
Place of birth for the foreign-born population - Iraq (%)
Place of birth for the foreign-born population - Israel (%)
Place of birth for the foreign-born population - Jordan (%)
Place of birth for the foreign-born population - Kuwait (%)
Place of birth for the foreign-born population - Lebanon (%)
Place of birth for the foreign-born population - Saudi Arabia (%)
Place of birth for the foreign-born population - Syria (%)
Place of birth for the foreign-born population - Turkey (%)
Place of birth for the foreign-born population - Yemen (%)
Place of birth for the foreign-born population - Other Western Asia (%)
Place of birth for the foreign-born population - Eritrea (%)
Place of birth for the foreign-born population - Ethiopia (%)
Place of birth for the foreign-born population - Kenya (%)
Place of birth for the foreign-born population - Somalia (%)
Place of birth for the foreign-born population - Uganda (%)
Place of birth for the foreign-born population - Zimbabwe (%)
Place of birth for the foreign-born population - Other Eastern Africa (%)
Place of birth for the foreign-born population - Cameroon (%)
Place of birth for the foreign-born population - Congo (%)
Place of birth for the foreign-born population - Democratic Republic of Congo (Zaire) (%)
Place of birth for the foreign-born population - Other Middle Africa (%)
Place of birth for the foreign-born population - Egypt (%)
Place of birth for the foreign-born population - Morocco (%)
Place of birth for the foreign-born population - Sudan (%)
Place of birth for the foreign-born population - Other Northern Africa (%)
Place of birth for the foreign-born population - South Africa (%)
Place of birth for the foreign-born population - Other Southern Africa (%)
Place of birth for the foreign-born population - Cabo Verde (%)
Place of birth for the foreign-born population - Ghana (%)
Place of birth for the foreign-born population - Liberia (%)
Place of birth for the foreign-born population - Nigeria (%)
Place of birth for the foreign-born population - Senegal (%)
Place of birth for the foreign-born population - Sierra Leone (%)
Place of birth for the foreign-born population - Other Western Africa (%)
Place of birth for the foreign-born population - Australia (%)
Place of birth for the foreign-born population - New Zealand (%)
Place of birth for the foreign-born population - Fiji (%)
Place of birth for the foreign-born population - Micronesia (%)
Place of birth for the foreign-born population - Bahamas (%)
Place of birth for the foreign-born population - Barbados (%)
Place of birth for the foreign-born population - Cuba (%)
Place of birth for the foreign-born population - Dominica (%)
Place of birth for the foreign-born population - Dominican Republic (%)
Place of birth for the foreign-born population - Grenada (%)
Place of birth for the foreign-born population - Haiti (%)
Place of birth for the foreign-born population - Jamaica (%)
Place of birth for the foreign-born population - St. Vincent and the Grenadines (%)
Place of birth for the foreign-born population - Trinidad and Tobago (%)
Place of birth for the foreign-born population - West Indies (%)
Place of birth for the foreign-born population - Other Caribbean (%)
Place of birth for the foreign-born population - Belize (%)
Place of birth for the foreign-born population - Costa Rica (%)
Place of birth for the foreign-born population - El Salvador (%)
Place of birth for the foreign-born population - Guatemala (%)
Place of birth for the foreign-born population - Honduras (%)
Place of birth for the foreign-born population - Mexico (%)
Place of birth for the foreign-born population - Nicaragua (%)
Place of birth for the foreign-born population - Panama (%)
Place of birth for the foreign-born population - Other Central America (%)
Place of birth for the foreign-born population - Argentina (%)
Place of birth for the foreign-born population - Bolivia (%)
Place of birth for the foreign-born population - Brazil (%)
Place of birth for the foreign-born population - Chile (%)
Place of birth for the foreign-born population - Colombia (%)
Place of birth for the foreign-born population - Ecuador (%)
Place of birth for the foreign-born population - Guyana (%)
Place of birth for the foreign-born population - Peru (%)
Place of birth for the foreign-born population - Uruguay (%)
Place of birth for the foreign-born population - Venezuela (%)
Place of birth for the foreign-born population - Other South America (%)
Place of birth for the foreign-born population - Canada (%)
Place of birth for the foreign-born population - Other Northern America (%)
Place of birth for the foreign-born population - Other (%)
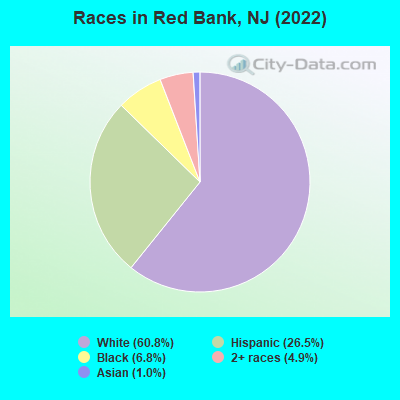
According to 2022 data, the most numerous races in Red Bank, NJ are White alone (7,838 residents), Hispanic (3,421 residents), and Black alone (874 residents). 75.9% of Red Bank residents speak English at home. 18.2% of Red Bank, NJ residents are foreign-born (13.5% born in Latin America, 2.3% born in Europe), which is 26.7% less than the foreign-born rate of 23.0% across the entire state of New Jersey.
Race distribution in Red Bank
2000 2022
5,557,209 66.0% White alone 1,117,191 13.3% Hispanic 1,096,171 13.0% Black alone 477,012 5.7% Asian alone 133,689 1.6% Two or more races 19,565 0.2% Other race alone 11,338 0.1% American Indian alone 2,175 0.03% Native Hawaiian and Other
4,766,476 51.5% White alone 2,028,470 21.9% Hispanic 1,111,632 12.0% Black alone 923,546 10.0% Asian alone 332,237 3.6% Two or more races 89,847 1.0% Other race alone 8,557 0.09% American Indian alone 934 0.01% Native Hawaiian and Other
Income and house value in Red Bank Median household income in 2022 $107,772 White non-Hispanic householders$57,397 Black householders$90,733 American Indian and Alaska Native householders$85,470 Asian householders$54,997 Some other race householders$52,824 Hispanic or Latino race householdersMedian 2022 house value $569,047 White Non-Hispanic householders$267,349 Black or African American householdersover $1,000,000 American Indian or Alaska Native householders $355,225 Asian householders$293,397 Some other race householders$517,237 Two or more races householders$457,985 Hispanic or Latino householders
Median age by race in Red Bank
42.5 Median age for White residents39.7 45.5 44.1 Median age for Black or African American residents63.5 40.8 25.6 Median age for American Indian / Alaska Native residents28.4 23.6 52.7 Median age for Asian residents-654,320,987.0 54.3 -804,177,544.9 Median age for Native Hawaiian / Pacific Islander residents-860,335,194.7 -713,070,378.3 28.1 Median age for Other race residents32.4 24.2 38.3 Median age for Two or more races residents39.7 36.0 46.7 Median age for White alone residents42.2 51.1 30.9 Median age for Hispanic or Latino residents31.4 29.2
Owner/renter occupied households by race in Red Bank
House owners and renters - White residents 2,438 55.0% Owner occupied1,997 45.0% Renter occupiedHouse owners and renters - Black or African American residents 249 55.8% Owner occupied197 44.2% Renter occupiedHouse owners and renters - American Indian / Alaska Native residents 108 100.0% Renter occupiedHouse owners and renters - Asian residents 72 57.9% Owner occupied52 42.1% Renter occupiedHouse owners and renters - Other race residents 97 20.7% Owner occupied369 79.3% Renter occupiedHouse owners and renters - Two or more races residents 479 63.7% Owner occupied273 36.3% Renter occupiedHouse owners and renters - White alone residents 2,340 55.8% Owner occupied1,851 44.2% Renter occupiedHouse owners and renters - Hispanic or Latino residents 384 33.4% Owner occupied768 66.6% Renter occupied
Language usage in Red Bank
English speakers - Total 75.9% of residents of Red Bank speak English at home.
17.6% of residents speak Spanish at home 1,184 55.6% Speak English very well945 44.4% Speak English less than very well4.4% of residents speak other language at home 426 80.2% Speak English very well105 19.8% Speak English less than very well
English speakers - Born in the United States 92.6% of residents of Red Bank speak English at home.
3.1% of residents speak Spanish at home 117 100.0% Speak English very well3.4% of residents speak other language at home 107 84.3% Speak English very well20 15.7% Speak English less than very well
English speakers - Native, born elsewhere 56.8% of residents of Red Bank speak English at home.
24.3% of residents speak Spanish at home 18 100.0% Speak English very well18.9% of residents speak other language at home 14 100.0% Speak English very well
English speakers - Foreign-born 22.6% of residents of Red Bank speak English at home.
59.6% of residents speak Spanish at home 466 33.3% Speak English very well933 66.7% Speak English less than very well10.5% of residents speak other language at home 162 65.6% Speak English very well85 34.4% Speak English less than very well
White (Caucasian) - Speak only English Native:
92.4% (6,859)Foreign-born:
47.1% (325)
White (Caucasian) - Speak another language Native:
6.9% (512)Foreign-born:
52.2% (359)
Black or African American - Speak only English Native:
98.0% (803)Foreign-born:
26.5% (21)
American Indian / Alaska Native - Speak only English Native:
36.2% (17)Foreign-born:
15.1% (51)
American Indian / Alaska Native - Speak another language Native:
66.3% (32)Foreign-born:
86.0% (289)
Asian - Speak another language Native:
100.0% (39)Foreign-born:
41.3% (41)
Other race - Speak only English Native:
60.1% (574)Foreign-born:
13.7% (117)
Other race - Speak another language Native:
40.9% (391)Foreign-born:
86.3% (733)
Two or more races - Speak only English Native:
77.5% (562)Foreign-born:
5.6% (38)
Two or more races - Speak another language Native:
21.2% (154)Foreign-born:
99.4% (685)
White alone - Speak only English Native:
96.0% (6,787)Foreign-born:
62.8% (298)
White alone - Speak another language Native:
4.0% (282)Foreign-born:
28.9% (137)
Hispanic or Latino - Speak only English Native:
47.8% (664)Foreign-born:
12.2% (193)
Hispanic or Latino - Speak another language Native:
49.8% (692)Foreign-born:
87.3% (1,380)
Foreign-born residents in Red Bank 2,340 residents are foreign born (13.5% Latin America , 2.3% Europe ).
This city:
18.2%New Jersey:
23.2%
Marital status for residents in Red Bank Marital status - White (Caucasian) population 15 years and over
Males 31.1% Never married49.1% Now married3.9% Separated1.4% Widowed14.5% DivorcedFemales 25.5% Never married42.8% Now married2.0% Separated12.4% Widowed17.4% DivorcedWomen who gave birth in the past 12 months Now married:
100.0% (126)Unmarried:
0.0% (0)
Women who did not give birth in the past 12 months Now married:
46.0% (782)Unmarried:
54.0% (917)
Marital status - Black or African American population 15 years and over
Males 55.9% Never married28.1% Now married0.0% Separated3.9% Widowed12.1% DivorcedFemales 66.4% Never married22.8% Now married0.0% Separated5.8% Widowed5.1% DivorcedWomen who gave birth in the past 12 months Now married:
0.0% (0)Unmarried:
84.6% (1)
Women who did not give birth in the past 12 months Now married:
11.3% (40)Unmarried:
88.7% (312)
Marital status - American Indian / Alaska Native population 15 years and over
Males 27.5% Never married42.5% Now married30.0% Separated0.0% Widowed0.0% DivorcedFemales 76.8% Never married23.2% Now married0.0% Separated0.0% Widowed0.0% DivorcedWomen who gave birth in the past 12 months Now married:
0.0% (0)Unmarried:
100.0% (15)
Women who did not give birth in the past 12 months Now married:
25.5% (40)Unmarried:
74.5% (117)
Marital status - Asian population 15 years and over
Males 100.0% Never married0.0% Now married0.0% Separated0.0% Widowed0.0% DivorcedFemales 21.6% Never married23.9% Now married0.0% Separated17.0% Widowed37.5% DivorcedWomen who did not give birth in the past 12 months Now married:
0.0% (0)Unmarried:
100.0% (33)
Marital status - Other race population 15 years and over
Males 55.7% Never married43.7% Now married0.6% Separated0.0% Widowed0.0% DivorcedFemales 45.4% Never married43.2% Now married0.0% Separated0.0% Widowed11.4% DivorcedWomen who gave birth in the past 12 months Now married:
0.0% (0)Unmarried:
100.0% (85)
Women who did not give birth in the past 12 months Now married:
52.1% (214)Unmarried:
47.9% (197)
Marital status - Two or more races population 15 years and over
Males 26.0% Never married19.8% Now married0.0% Separated0.0% Widowed54.2% DivorcedFemales 38.5% Never married16.0% Now married5.8% Separated29.3% Widowed10.4% DivorcedWomen who did not give birth in the past 12 months Now married:
28.0% (105)Unmarried:
72.0% (270)
Marital status - White alone, not Hispanic / Latino population 15 years and over
Males 31.4% Never married47.3% Now married4.3% Separated1.5% Widowed15.5% DivorcedFemales 22.9% Never married41.8% Now married2.2% Separated13.8% Widowed19.3% DivorcedWomen who gave birth in the past 12 months Now married:
100.0% (85)Unmarried:
0.0% (0)
Women who did not give birth in the past 12 months Now married:
47.7% (693)Unmarried:
52.3% (761)
Marital status - Hispanic or Latino population 15 years and over
Males 44.6% Never married47.4% Now married3.3% Separated0.0% Widowed4.7% DivorcedFemales 42.1% Never married38.5% Now married2.5% Separated12.4% Widowed4.5% DivorcedWomen who gave birth in the past 12 months Now married:
42.9% (50)Unmarried:
57.1% (66)
Women who did not give birth in the past 12 months Now married:
45.5% (373)Unmarried:
54.5% (447)
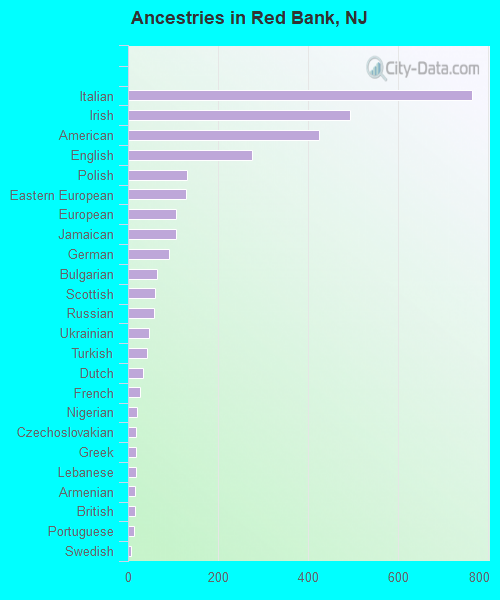
Ancestries in Red Bank
763 11.2% Italian492 7.2% Irish424 6.2% American275 4.0% English130 1.9% Polish128 1.9% Eastern European107 1.6% European107 1.6% Jamaican91 1.3% German65 1.0% Bulgarian59 0.9% Scottish58 0.8% Russian47 0.7% Ukrainian42 0.6% Turkish33 0.5% Dutch27 0.4% French21 0.3% Nigerian18 0.3% Czechoslovakian18 0.3% Greek17 0.2% Lebanese15 0.2% Armenian15 0.2% British14 0.2% Portuguese7 0.1% Swedish5 0.07% New Zealander4 0.06% Arab4 0.06% Danish4 0.06% Hungarian
Geographical mobility in Red Bank Same house 1 year ago 7,373 87.7% White (Caucasian)962 100.0% Black or African American389 96.6% American Indian / Alaska Native120 88.4% Asian1,700 86.6% Other race1,654 100.0% Two or more races6,716 86.7% White alone, not Hispanic / Latino3,092 93.4% Hispanic or LatinoMoved within same county 495 5.9% White / Caucasian1 0.1% Black or African American96 4.9% Other race7 0.4% Two or more races487 6.3% White alone, not Hispanic / Latino142 4.3% Hispanic or LatinoMoved within same state 243 2.9% White / Caucasian1 0.1% Black or African American250 3.2% White alone, not Hispanic / LatinoMoved from different state 161 1.9% White / Caucasian14 10.4% Asian168 2.2% White alone, not Hispanic / LatinoMoved from abroad 35 0.4% White98 1.3% White alone, not Hispanic / Latino
Children Nativity (place of birth) in Red Bank
Children under 6 years - Living with two parents Both parents native 436 100.0% NativeBoth parents foreign-born 89 100.0% NativeOne native, one foreign-born parent 19 100.0% NativeChildren under 6 years - Living with one parent Native parent 125 100.0% NativeForeign-born parent 188 100.0% NativeChildren 6 to 17 years - Living with two parents Both parents native 338 100.0% NativeBoth parents foreign-born 519 100.0% NativeChildren 6 to 17 years - Living with one parent Native parent 563 100.0% NativeForeign-born parent 355 51.4% Native335 48.6% Foreign-born
Grandparents responsible for own grandchildren in Red Bank
Grandparents (30 to 59 years) White / Caucasian 11 100.0% Not responsible for grandchildrenAmerican Indian / Alaska Native 24 100.0% Responsible for grandchildrenWhite alone, not Hispanic / Latino 12 100.0% Not responsible for grandchildrenHispanic or Latino 29 100.0% Responsible for grandchildrenGrandparents (60 years and over) White / Caucasian 3 5.0% Responsible for grandchildren57 95.0% Not responsible for grandchildrenWhite alone, not Hispanic / Latino 3 5.1% Responsible for grandchildren56 94.9% Not responsible for grandchildren