Races in Rochester, Minnesota (MN) Detailed Stats
Data:
Races - White alone (%)
Races - White alone (% change since 2000)
Races - Black alone (%)
Races - Black alone (% change since 2000)
Races - American Indian alone (%)
Races - American Indian alone (% change since 2000)
Races - Asian alone (%)
Races - Asian alone (% change since 2000)
Races - Hispanic (%)
Races - Hispanic (% change since 2000)
Races - Native Hawaiian and Other Pacific Islander alone (%)
Races - Native Hawaiian and Other Pacific Islander alone (% change since 2000)
Races - Two or more races(%)
Races - Two or more races(% change since 2000)
Races - Other race alone (%)
Races - Other race alone (% change since 2000)
Racial diversity
Place of birth - Born in state of residence (%)
Place of birth - Born in state of residence (%) - White
Place of birth - Born in state of residence (%) - Black or African American
Place of birth - Born in state of residence (%) - Asian
Place of birth - Born in state of residence (%) - Hispanic or Latino
Place of birth - Born in state of residence (%) - American Indian and Alaska Native
Place of birth - Born in state of residence (%) - Multirace
Place of birth - Born in state of residence (%) - Other Race
Place of birth - Born in other state (%)
Place of birth - Born in other state (%) - White
Place of birth - Born in other state (%) - Black or African American
Place of birth - Born in other state (%) - Asian
Place of birth - Born in other state (%) - Hispanic or Latino
Place of birth - Born in other state (%) - American Indian and Alaska Native
Place of birth - Born in other state (%) - Multirace
Place of birth - Born in other state (%) - Other Race
Place of birth - Native, outside of US (%)
Place of birth - Native, outside of US (%) - White
Place of birth - Native, outside of US (%) - Black or African American
Place of birth - Native, outside of US (%) - Asian
Place of birth - Native, outside of US (%) - Hispanic or Latino
Place of birth - Native, outside of US (%) - American Indian and Alaska Native
Place of birth - Native, outside of US (%) - Multirace
Place of birth - Native, outside of US (%) - Other Race
Place of birth - Foreign born (%)
Place of birth - Foreign born (%) - White
Place of birth - Foreign born (%) - Black or African American
Place of birth - Foreign born (%) - Asian
Place of birth - Foreign born (%) - Hispanic or Latino
Place of birth - Foreign born (%) - American Indian and Alaska Native
Place of birth - Foreign born (%) - Multirace
Place of birth - Foreign born (%) - Other Race
Residents speaking English at home (%)
Residents speaking English at home - Born in the United States (%)
Residents speaking English at home - Native, born elsewhere (%)
Residents speaking English at home - Foreign born (%)
Residents speaking Spanish at home (%)
Residents speaking Spanish at home - Born in the United States (%)
Residents speaking Spanish at home - Native, born elsewhere (%)
Residents speaking Spanish at home - Foreign born (%)
Residents speaking other language at home (%)
Residents speaking other language at home - Born in the United States (%)
Residents speaking other language at home - Native, born elsewhere (%)
Residents speaking other language at home - Foreign born (%)
Marital status - Never married (%)
Marital status - Now married (%)
Marital status - Separated (%)
Marital status - Widowed (%)
Marital status - Divorced (%)
Ancestries Reported - Arab (%)
Ancestries Reported - Czech (%)
Ancestries Reported - Danish (%)
Ancestries Reported - Dutch (%)
Ancestries Reported - English (%)
Ancestries Reported - French (%)
Ancestries Reported - French Canadian (%)
Ancestries Reported - German (%)
Ancestries Reported - Greek (%)
Ancestries Reported - Hungarian (%)
Ancestries Reported - Irish (%)
Ancestries Reported - Italian (%)
Ancestries Reported - Lithuanian (%)
Ancestries Reported - Norwegian (%)
Ancestries Reported - Polish (%)
Ancestries Reported - Portuguese (%)
Ancestries Reported - Russian (%)
Ancestries Reported - Scotch-Irish (%)
Ancestries Reported - Scottish (%)
Ancestries Reported - Slovak (%)
Ancestries Reported - Subsaharan African (%)
Ancestries Reported - Swedish (%)
Ancestries Reported - Swiss (%)
Ancestries Reported - Ukrainian (%)
Ancestries Reported - United States (%)
Ancestries Reported - Welsh (%)
Ancestries Reported - West Indian (%)
Ancestries Reported - Other (%)
Geographical mobility - Same house 1 year ago (%)
Geographical mobility - Same house 1 year ago (%) - White
Geographical mobility - Same house 1 year ago (%) - Black or African American
Geographical mobility - Same house 1 year ago (%) - Asian
Geographical mobility - Same house 1 year ago (%) - Hispanic or Latino
Geographical mobility - Same house 1 year ago (%) - American Indian and Alaska Native
Geographical mobility - Same house 1 year ago (%) - Multirace
Geographical mobility - Same house 1 year ago (%) - Other Race
Geographical mobility - Moved within same county (%)
Geographical mobility - Moved within same county (%) - White
Geographical mobility - Moved within same county (%) - Black or African American
Geographical mobility - Moved within same county (%) - Asian
Geographical mobility - Moved within same county (%) - Hispanic or Latino
Geographical mobility - Moved within same county (%) - American Indian and Alaska Native
Geographical mobility - Moved within same county (%) - Multirace
Geographical mobility - Moved within same county (%) - Other Race
Geographical mobility - Moved from different county within same state (%)
Geographical mobility - Moved from different county within same state (%) - White
Geographical mobility - Moved from different county within same state (%) - Black or African American
Geographical mobility - Moved from different county within same state (%) - Asian
Geographical mobility - Moved from different county within same state (%) - Hispanic or Latino
Geographical mobility - Moved from different county within same state (%) - American Indian and Alaska Native
Geographical mobility - Moved from different county within same state (%) - Multirace
Geographical mobility - Moved from different county within same state (%) - Other Race
Geographical mobility - Moved from different state (%)
Geographical mobility - Moved from different state (%) - White
Geographical mobility - Moved from different state (%) - Black or African American
Geographical mobility - Moved from different state (%) - Asian
Geographical mobility - Moved from different state (%) - Hispanic or Latino
Geographical mobility - Moved from different state (%) - American Indian and Alaska Native
Geographical mobility - Moved from different state (%) - Multirace
Geographical mobility - Moved from different state (%) - Other Race
Geographical mobility - Moved from abroad (%)
Geographical mobility - Moved from abroad (%) - White
Geographical mobility - Moved from abroad (%) - Black or African American
Geographical mobility - Moved from abroad (%) - Asian
Geographical mobility - Moved from abroad (%) - Hispanic or Latino
Geographical mobility - Moved from abroad (%) - American Indian and Alaska Native
Geographical mobility - Moved from abroad (%) - Multirace
Geographical mobility - Moved from abroad (%) - Other Race
Place of birth for the foreign-born population - Ireland (%)
Place of birth for the foreign-born population - Denmark (%)
Place of birth for the foreign-born population - Norway (%)
Place of birth for the foreign-born population - Sweden (%)
Place of birth for the foreign-born population - United Kingdom (%)
Place of birth for the foreign-born population - England (%)
Place of birth for the foreign-born population - Scotland (%)
Place of birth for the foreign-born population - Other Northern Europe (%)
Place of birth for the foreign-born population - Austria (%)
Place of birth for the foreign-born population - Belgium (%)
Place of birth for the foreign-born population - France (%)
Place of birth for the foreign-born population - Germany (%)
Place of birth for the foreign-born population - Netherlands (%)
Place of birth for the foreign-born population - Switzerland (%)
Place of birth for the foreign-born population - Other Western Europe (%)
Place of birth for the foreign-born population - Greece (%)
Place of birth for the foreign-born population - Italy (%)
Place of birth for the foreign-born population - Portugal (%)
Place of birth for the foreign-born population - Spain (%)
Place of birth for the foreign-born population - Other Southern Europe (%)
Place of birth for the foreign-born population - Albania (%)
Place of birth for the foreign-born population - Belarus (%)
Place of birth for the foreign-born population - Bosnia and Herzegovina (%)
Place of birth for the foreign-born population - Bulgaria (%)
Place of birth for the foreign-born population - Croatia (%)
Place of birth for the foreign-born population - Czechoslovakia (%)
Place of birth for the foreign-born population - Hungary (%)
Place of birth for the foreign-born population - Latvia (%)
Place of birth for the foreign-born population - Lithuania (%)
Place of birth for the foreign-born population - North Macedonia (Macedonia) (%)
Place of birth for the foreign-born population - Moldova (%)
Place of birth for the foreign-born population - Poland (%)
Place of birth for the foreign-born population - Romania (%)
Place of birth for the foreign-born population - Russia (%)
Place of birth for the foreign-born population - Serbia (%)
Place of birth for the foreign-born population - Ukraine (%)
Place of birth for the foreign-born population - Other Eastern Europe (%)
Place of birth for the foreign-born population - China (%)
Place of birth for the foreign-born population - Hong Kong (%)
Place of birth for the foreign-born population - Taiwan (%)
Place of birth for the foreign-born population - Japan (%)
Place of birth for the foreign-born population - Korea (%)
Place of birth for the foreign-born population - Other Eastern Asia (%)
Place of birth for the foreign-born population - Afghanistan (%)
Place of birth for the foreign-born population - Bangladesh (%)
Place of birth for the foreign-born population - India (%)
Place of birth for the foreign-born population - Iran (%)
Place of birth for the foreign-born population - Kazakhstan (%)
Place of birth for the foreign-born population - Nepal (%)
Place of birth for the foreign-born population - Pakistan (%)
Place of birth for the foreign-born population - Sri Lanka (%)
Place of birth for the foreign-born population - Uzbekistan (%)
Place of birth for the foreign-born population - Other South Central Asia (%)
Place of birth for the foreign-born population - Burma (%)
Place of birth for the foreign-born population - Cambodia (%)
Place of birth for the foreign-born population - Indonesia (%)
Place of birth for the foreign-born population - Laos (%)
Place of birth for the foreign-born population - Malaysia (%)
Place of birth for the foreign-born population - Philippines (%)
Place of birth for the foreign-born population - Singapore (%)
Place of birth for the foreign-born population - Thailand (%)
Place of birth for the foreign-born population - Vietnam (%)
Place of birth for the foreign-born population - Other South Eastern Asia (%)
Place of birth for the foreign-born population - Armenia (%)
Place of birth for the foreign-born population - Iraq (%)
Place of birth for the foreign-born population - Israel (%)
Place of birth for the foreign-born population - Jordan (%)
Place of birth for the foreign-born population - Kuwait (%)
Place of birth for the foreign-born population - Lebanon (%)
Place of birth for the foreign-born population - Saudi Arabia (%)
Place of birth for the foreign-born population - Syria (%)
Place of birth for the foreign-born population - Turkey (%)
Place of birth for the foreign-born population - Yemen (%)
Place of birth for the foreign-born population - Other Western Asia (%)
Place of birth for the foreign-born population - Eritrea (%)
Place of birth for the foreign-born population - Ethiopia (%)
Place of birth for the foreign-born population - Kenya (%)
Place of birth for the foreign-born population - Somalia (%)
Place of birth for the foreign-born population - Uganda (%)
Place of birth for the foreign-born population - Zimbabwe (%)
Place of birth for the foreign-born population - Other Eastern Africa (%)
Place of birth for the foreign-born population - Cameroon (%)
Place of birth for the foreign-born population - Congo (%)
Place of birth for the foreign-born population - Democratic Republic of Congo (Zaire) (%)
Place of birth for the foreign-born population - Other Middle Africa (%)
Place of birth for the foreign-born population - Egypt (%)
Place of birth for the foreign-born population - Morocco (%)
Place of birth for the foreign-born population - Sudan (%)
Place of birth for the foreign-born population - Other Northern Africa (%)
Place of birth for the foreign-born population - South Africa (%)
Place of birth for the foreign-born population - Other Southern Africa (%)
Place of birth for the foreign-born population - Cabo Verde (%)
Place of birth for the foreign-born population - Ghana (%)
Place of birth for the foreign-born population - Liberia (%)
Place of birth for the foreign-born population - Nigeria (%)
Place of birth for the foreign-born population - Senegal (%)
Place of birth for the foreign-born population - Sierra Leone (%)
Place of birth for the foreign-born population - Other Western Africa (%)
Place of birth for the foreign-born population - Australia (%)
Place of birth for the foreign-born population - New Zealand (%)
Place of birth for the foreign-born population - Fiji (%)
Place of birth for the foreign-born population - Micronesia (%)
Place of birth for the foreign-born population - Bahamas (%)
Place of birth for the foreign-born population - Barbados (%)
Place of birth for the foreign-born population - Cuba (%)
Place of birth for the foreign-born population - Dominica (%)
Place of birth for the foreign-born population - Dominican Republic (%)
Place of birth for the foreign-born population - Grenada (%)
Place of birth for the foreign-born population - Haiti (%)
Place of birth for the foreign-born population - Jamaica (%)
Place of birth for the foreign-born population - St. Vincent and the Grenadines (%)
Place of birth for the foreign-born population - Trinidad and Tobago (%)
Place of birth for the foreign-born population - West Indies (%)
Place of birth for the foreign-born population - Other Caribbean (%)
Place of birth for the foreign-born population - Belize (%)
Place of birth for the foreign-born population - Costa Rica (%)
Place of birth for the foreign-born population - El Salvador (%)
Place of birth for the foreign-born population - Guatemala (%)
Place of birth for the foreign-born population - Honduras (%)
Place of birth for the foreign-born population - Mexico (%)
Place of birth for the foreign-born population - Nicaragua (%)
Place of birth for the foreign-born population - Panama (%)
Place of birth for the foreign-born population - Other Central America (%)
Place of birth for the foreign-born population - Argentina (%)
Place of birth for the foreign-born population - Bolivia (%)
Place of birth for the foreign-born population - Brazil (%)
Place of birth for the foreign-born population - Chile (%)
Place of birth for the foreign-born population - Colombia (%)
Place of birth for the foreign-born population - Ecuador (%)
Place of birth for the foreign-born population - Guyana (%)
Place of birth for the foreign-born population - Peru (%)
Place of birth for the foreign-born population - Uruguay (%)
Place of birth for the foreign-born population - Venezuela (%)
Place of birth for the foreign-born population - Other South America (%)
Place of birth for the foreign-born population - Canada (%)
Place of birth for the foreign-born population - Other Northern America (%)
Place of birth for the foreign-born population - Other (%)
Latest news about races in Rochester, MN collected exclusively by city-data.com from local newspapers, TV, and radio stations
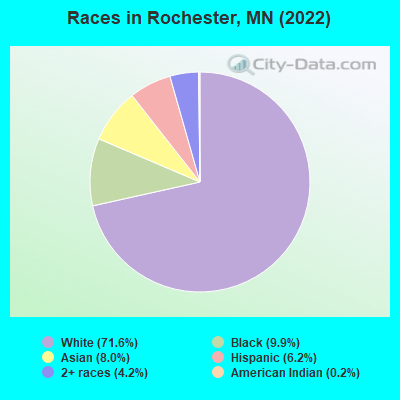
According to 2022 data, the most numerous races in Rochester, MN are White alone (87,236 residents), Black alone (12,066 residents), and Hispanic (7,497 residents). 81.4% of Rochester residents speak English at home. 14.3% of Rochester, MN residents are foreign-born (5.8% born in Asia, 4.8% born in Africa, 1.9% born in Latin America), which is 44.1% greater than the foreign-born rate of 8.0% across the entire state of Minnesota.
Race distribution in Rochester
2000 2022
73,656 85.8% White alone 4,796 5.6% Asian alone 3,034 3.5% Black alone 2,565 3.0% Hispanic 1,388 1.6% Two or more races 232 0.3% American Indian alone 103 0.1% Other race alone 32 0.04% Native Hawaiian and Other
87,236 71.6% White alone 12,066 9.9% Black alone 9,762 8.0% Asian alone 7,497 6.2% Hispanic 5,067 4.2% Two or more races 266 0.2% American Indian alone
2000 2022
4,337,143 88.2% White alone 168,813 3.4% Black alone 143,382 2.9% Hispanic 141,083 2.9% Asian alone 70,304 1.4% Two or more races 52,009 1.1% American Indian alone 5,031 0.1% Other race alone 1,714 0.03% Native Hawaiian and Other
4,356,347 76.2% White alone 395,179 6.9% Black alone 333,830 5.8% Hispanic 294,800 5.2% Asian alone 259,649 4.5% Two or more races 42,125 0.7% American Indian alone 32,976 0.6% Other race alone 2,278 0.04% Native Hawaiian and Other
Income and house value in Rochester Median household income in 2022 $84,582 White non-Hispanic householders$41,281 Black householders$79,540 Asian householders$75,186 Some other race householders$102,024 Two or more races householders$71,275 Hispanic or Latino race householdersMedian 2022 house value $282,544 White Non-Hispanic householders$286,248 Black or African American householders$203,757 American Indian or Alaska Native householders $298,844 Asian householders$296,375 Some other race householders$210,920 Two or more races householders$315,639 Hispanic or Latino householders
Median age by race in Rochester
40.4 Median age for White residents39.2 41.5 26.6 Median age for Black or African American residents28.3 20.2 44.0 Median age for American Indian / Alaska Native residents44.1 38.7 35.7 Median age for Asian residents35.6 35.7 -666,666,666.0 Median age for Native Hawaiian / Pacific Islander residents-666,666,666.0 -666,666,666.0 31.7 Median age for Other race residents26.6 36.9 19.7 Median age for Two or more races residents19.1 25.2 41.1 Median age for White alone residents39.8 42.0 30.0 Median age for Hispanic or Latino residents28.1 33.0
Owner/renter occupied households by race in Rochester
House owners and renters - White residents 28,914 68.0% Owner occupied13,615 32.0% Renter occupiedHouse owners and renters - Black or African American residents 736 19.9% Owner occupied2,954 80.1% Renter occupiedHouse owners and renters - American Indian / Alaska Native residents 5 13.5% Owner occupied33 86.5% Renter occupiedHouse owners and renters - Asian residents 2,117 60.2% Owner occupied1,397 39.8% Renter occupiedHouse owners and renters - Native Hawaiian / Pacific Islander residents 92 65.2% Owner occupied49 34.8% Renter occupiedHouse owners and renters - Other race residents 685 69.3% Owner occupied304 30.7% Renter occupiedHouse owners and renters - Two or more races residents 1,367 67.0% Owner occupied673 33.0% Renter occupiedHouse owners and renters - White alone residents 28,443 67.9% Owner occupied13,443 32.1% Renter occupiedHouse owners and renters - Hispanic or Latino residents 1,520 67.5% Owner occupied732 32.5% Renter occupied
Language usage in Rochester
English speakers - Total 81.4% of residents of Rochester speak English at home.
4.5% of residents speak Spanish at home 3,224 61.8% Speak English very well1,989 38.2% Speak English less than very well14.1% of residents speak other language at home 10,624 65.9% Speak English very well5,498 34.1% Speak English less than very well
English speakers - Born in the United States 94.2% of residents of Rochester speak English at home.
2.8% of residents speak Spanish at home 881 92.3% Speak English very well74 7.7% Speak English less than very well3.1% of residents speak other language at home 964 91.8% Speak English very well86 8.2% Speak English less than very well
English speakers - Native, born elsewhere 28.0% of residents of Rochester speak English at home.
29.0% of residents speak Spanish at home 95 43.8% Speak English very well122 56.2% Speak English less than very well43.0% of residents speak other language at home 321 100.0% Speak English very well
English speakers - Foreign-born 18.6% of residents of Rochester speak English at home.
14.3% of residents speak Spanish at home 1,085 38.7% Speak English very well1,720 61.3% Speak English less than very well67.1% of residents speak other language at home 8,125 61.6% Speak English very well5,074 38.4% Speak English less than very well
White (Caucasian) - Speak only English Native:
97.2% (79,984)Foreign-born:
38.0% (1,052)
White (Caucasian) - Speak another language Native:
2.8% (2,267)Foreign-born:
62.0% (1,714)
Black or African American - Speak only English Native:
78.9% (3,339)Foreign-born:
10.6% (701)
Black or African American - Speak another language Native:
21.1% (894)Foreign-born:
89.4% (5,906)
Asian - Speak only English Native:
53.8% (969)Foreign-born:
20.8% (1,547)
Asian - Speak another language Native:
46.2% (831)Foreign-born:
79.2% (5,908)
Other race - Speak only English Native:
57.6% (533)Foreign-born:
4.0% (69)
Other race - Speak another language Native:
44.1% (408)Foreign-born:
99.1% (1,724)
Two or more races - Speak only English Native:
83.1% (4,851)Foreign-born:
22.0% (197)
Two or more races - Speak another language Native:
16.9% (987)Foreign-born:
78.0% (698)
White alone - Speak only English Native:
98.2% (79,130)Foreign-born:
43.7% (1,052)
White alone - Speak another language Native:
1.8% (1,440)Foreign-born:
56.3% (1,355)
Hispanic or Latino - Speak only English Native:
51.5% (2,054)Foreign-born:
7.5% (223)
Hispanic or Latino - Speak another language Native:
48.5% (1,934)Foreign-born:
92.5% (2,767)
Foreign-born residents in Rochester 17,484 residents are foreign born (5.8% Asia , 4.8% Africa , 1.9% Latin America ).
This city:
14.3%Minnesota:
8.5%
Marital status for residents in Rochester Marital status - White (Caucasian) population 15 years and over
Males 36.7% Never married52.0% Now married0.2% Separated3.3% Widowed7.8% DivorcedFemales 31.2% Never married47.7% Now married0.9% Separated9.3% Widowed10.9% DivorcedWomen who gave birth in the past 12 months Now married:
95.9% (1,411)Unmarried:
4.1% (60)
Women who did not give birth in the past 12 months Now married:
38.7% (7,590)Unmarried:
61.3% (12,015)
Marital status - Black or African American population 15 years and over
Males 49.0% Never married39.1% Now married5.3% Separated0.9% Widowed5.7% DivorcedFemales 47.1% Never married38.0% Now married0.7% Separated8.9% Widowed5.4% DivorcedWomen who gave birth in the past 12 months Now married:
41.1% (105)Unmarried:
58.9% (151)
Women who did not give birth in the past 12 months Now married:
37.2% (1,080)Unmarried:
62.8% (1,823)
Marital status - American Indian / Alaska Native population 15 years and over
Males 77.1% Never married6.7% Now married0.0% Separated0.0% Widowed16.2% DivorcedFemales 70.4% Never married16.7% Now married0.0% Separated0.0% Widowed13.0% DivorcedWomen who did not give birth in the past 12 months Now married:
0.0% (0)Unmarried:
100.0% (40)
Marital status - Asian population 15 years and over
Males 18.9% Never married70.2% Now married0.0% Separated0.0% Widowed11.0% DivorcedFemales 18.5% Never married65.3% Now married0.0% Separated11.9% Widowed4.3% DivorcedWomen who gave birth in the past 12 months Now married:
100.0% (31)Unmarried:
0.0% (0)
Women who did not give birth in the past 12 months Now married:
55.8% (1,516)Unmarried:
44.2% (1,202)
Marital status - Other race population 15 years and over
Males 39.7% Never married56.8% Now married0.0% Separated0.0% Widowed3.5% DivorcedFemales 35.9% Never married57.4% Now married0.0% Separated0.0% Widowed6.7% DivorcedWomen who gave birth in the past 12 months Now married:
100.0% (22)Unmarried:
0.0% (0)
Women who did not give birth in the past 12 months Now married:
60.5% (474)Unmarried:
39.5% (309)
Marital status - Two or more races population 15 years and over
Males 58.0% Never married35.4% Now married2.4% Separated0.0% Widowed4.2% DivorcedFemales 61.5% Never married32.4% Now married2.2% Separated1.0% Widowed2.9% DivorcedWomen who gave birth in the past 12 months Now married:
100.0% (229)Unmarried:
0.0% (0)
Women who did not give birth in the past 12 months Now married:
35.6% (716)Unmarried:
64.4% (1,296)
Marital status - White alone, not Hispanic / Latino population 15 years and over
Males 36.1% Never married53.1% Now married0.2% Separated3.2% Widowed7.4% DivorcedFemales 31.1% Never married48.0% Now married0.6% Separated9.3% Widowed11.0% DivorcedWomen who gave birth in the past 12 months Now married:
95.9% (1,411)Unmarried:
4.1% (60)
Women who did not give birth in the past 12 months Now married:
38.7% (7,475)Unmarried:
61.3% (11,861)
Marital status - Hispanic or Latino population 15 years and over
Males 53.2% Never married37.2% Now married0.0% Separated2.3% Widowed7.3% DivorcedFemales 43.1% Never married46.9% Now married6.3% Separated0.0% Widowed3.6% DivorcedWomen who gave birth in the past 12 months Now married:
65.6% (76)Unmarried:
34.4% (40)
Women who did not give birth in the past 12 months Now married:
46.6% (1,036)Unmarried:
53.4% (1,188)
Ancestries in Rochester
12,137 21.8% German4,415 7.9% Norwegian3,423 6.1% Somali2,925 5.3% American2,057 3.7% Irish1,791 3.2% English1,262 2.3% European870 1.6% Scandinavian854 1.5% Sudanese738 1.3% Swedish661 1.2% Polish580 1.0% Italian538 1.0% Ethiopian536 1.0% African427 0.8% Eastern European346 0.6% Iraqi324 0.6% Moroccan294 0.5% Dutch259 0.5% Iranian259 0.5% Nigerian238 0.4% Yugoslavian235 0.4% French215 0.4% Danish215 0.4% Scottish203 0.4% Egyptian199 0.4% Czech188 0.3% Finnish176 0.3% Swiss154 0.3% Hungarian154 0.3% Ukrainian129 0.2% Welsh125 0.2% Turkish121 0.2% Northern European116 0.2% French Canadian112 0.2% Arab100 0.2% British87 0.2% Brazilian87 0.2% Scotch-Irish86 0.2% Afghan85 0.2% Greek77 0.1% Lebanese70 0.1% Bulgarian68 0.1% Russian64 0.1% Czechoslovakian64 0.1% Belgian58 0.1% South African47 0.08% Slovak47 0.08% Maltese44 0.08% Canadian43 0.08% Ghanaian37 0.07% Icelander34 0.06% Serbian30 0.05% Austrian28 0.05% Bermudan24 0.04% Croatian22 0.04% Lithuanian22 0.04% Romanian20 0.04% Palestinian18 0.03% Pennsylvania German16 0.03% Celtic16 0.03% Luxembourger14 0.03% Portuguese14 0.03% Kenyan14 0.03% Slovene11 0.02% Slavic10 0.02% Ugandan7 0.01% Latvian7 0.01% Syrian3 0.01% Jordanian
Geographical mobility in Rochester Same house 1 year ago 73,924 84.3% White (Caucasian)6,979 57.8% Black or African American141 57.3% American Indian / Alaska Native7,642 78.7% Asian27 23.8% Native Hawaiian / Pacific Islander1,934 79.7% Other race5,566 76.4% Two or more races72,611 84.9% White alone, not Hispanic / Latino4,952 66.1% Hispanic or LatinoMoved within same county 7,454 8.5% White / Caucasian1,344 11.1% Black or African American9 3.6% American Indian / Alaska Native435 4.5% Asian224 9.2% Other race749 10.3% Two or more races7,022 8.2% White alone, not Hispanic / Latino1,560 20.8% Hispanic or LatinoMoved within same state 4,095 4.7% White / Caucasian348 2.9% Black or African American103 41.7% American Indian / Alaska Native507 5.2% Asian214 8.8% Other race147 2.0% Two or more races3,609 4.2% White alone, not Hispanic / Latino912 12.2% Hispanic or LatinoMoved from different state 1,965 2.2% White / Caucasian2,475 20.5% Black or African American710 7.3% Asian32 28.1% Native Hawaiian / Pacific Islander22 0.9% Other race757 10.4% Two or more races1,965 2.3% White alone, not Hispanic / Latino73 1.0% Hispanic or LatinoMoved from abroad 284 0.3% White920 7.6% Black or African American414 4.3% Asian38 34.0% Native Hawaiian / Pacific Islander9 0.4% Other race158 2.2% Two or more races284 0.3% White alone, not Hispanic / Latino
Children Nativity (place of birth) in Rochester
Children under 6 years - Living with two parents Both parents native 5,024 100.0% NativeBoth parents foreign-born 920 51.3% Native874 48.7% Foreign-bornOne native, one foreign-born parent 709 100.0% NativeChildren under 6 years - Living with one parent Native parent 507 100.0% NativeForeign-born parent 142 100.0% NativeChildren 6 to 17 years - Living with two parents Both parents native 8,466 96.6% Native299 3.4% Foreign-bornBoth parents foreign-born 739 18.8% Native3,191 81.2% Foreign-bornOne native, one foreign-born parent 1,768 100.0% NativeChildren 6 to 17 years - Living with one parent Native parent 2,711 100.0% NativeForeign-born parent 1,180 51.1% Native1,130 48.9% Foreign-born
Place of birth for residents in Rochester 7,215 Asia6,059 Africa3,404 Eastern Africa2,925 South Eastern Asia2,609 Americas2,323 Latin America2,202 South Central Asia1,674 Northern Africa1,583 Central America1,544 Europe1,192 Eastern Asia962 Eastern Europe895 Western Asia851 China583 South America468 Western Africa424 Middle Africa285 Northern America218 Northern Europe213 Western Europe156 Caribbean150 Southern Europe86 Southern Africa55 Oceania46 Australia and New Zealand Subregion1,972 Somalia1,387 India1,224 Mexico1,084 Vietnam820 Egypt770 Cambodia695 China672 Ethiopia488 Bosnia and Herzegovina481 Sudan398 Kenya359 Morocco315 Philippines308 Cameroon302 Pakistan293 Nigeria278 Canada266 Thailand253 Saudi Arabia240 Korea231 El Salvador230 Laos220 Burma (Myanmar)199 Yemen152 Iran146 Taiwan142 Bangladesh139 Ghana127 Nepal120 Turkey108 Germany106 Colombia100 Japan97 Congo89 Poland87 Brazil79 Russia79 Ecuador77 Peru76 Venezuela72 Romania70 United Kingdom66 France66 Iraq66 Lebanon63 Sri Lanka58 Chile57 England56 Syria54 South Africa50 Greece49 Guatemala46 Tanzania46 Australia43 Spain42 Azerbaijan39 Uruguay37 Malaysia37 Kuwait35 Liberia34 Bulgaria34 Cuba32 Hungary31 Ukraine30 Croatia27 Eritrea27 Ireland24 Italy22 Nicaragua19 Kazakhstan19 Netherlands18 Scotland18 Serbia18 Guyana18 Switzerland17 Belarus16 Argentina15 Jordan14 Lithuania12 Uganda11 Democratic Republic of Congo (Zaire)10 Denmark10 Czechoslovakia9 Fiji9 Hong Kong9 Honduras8 Afghanistan
Grandparents responsible for own grandchildren in Rochester
Grandparents (30 to 59 years) White / Caucasian 115 44.1% Responsible for grandchildren146 55.9% Not responsible for grandchildrenBlack or African American 19 14.1% Responsible for grandchildren114 85.9% Not responsible for grandchildrenAmerican Indian / Alaska Native 4 100.0% Not responsible for grandchildrenAsian 77 100.0% Not responsible for grandchildrenWhite alone, not Hispanic / Latino 118 44.1% Responsible for grandchildren149 55.9% Not responsible for grandchildrenGrandparents (60 years and over) White / Caucasian 173 40.7% Responsible for grandchildren253 59.3% Not responsible for grandchildrenBlack or African American 186 100.0% Responsible for grandchildrenAsian 36 17.3% Responsible for grandchildren170 82.7% Not responsible for grandchildrenWhite alone, not Hispanic / Latino 179 42.9% Responsible for grandchildren238 57.1% Not responsible for grandchildren