Races in Roseville, Minnesota (MN) Detailed Stats
Data:
Races - White alone (%)
Races - White alone (% change since 2000)
Races - Black alone (%)
Races - Black alone (% change since 2000)
Races - American Indian alone (%)
Races - American Indian alone (% change since 2000)
Races - Asian alone (%)
Races - Asian alone (% change since 2000)
Races - Hispanic (%)
Races - Hispanic (% change since 2000)
Races - Native Hawaiian and Other Pacific Islander alone (%)
Races - Native Hawaiian and Other Pacific Islander alone (% change since 2000)
Races - Two or more races(%)
Races - Two or more races(% change since 2000)
Races - Other race alone (%)
Races - Other race alone (% change since 2000)
Racial diversity
Place of birth - Born in state of residence (%)
Place of birth - Born in state of residence (%) - White
Place of birth - Born in state of residence (%) - Black or African American
Place of birth - Born in state of residence (%) - Asian
Place of birth - Born in state of residence (%) - Hispanic or Latino
Place of birth - Born in state of residence (%) - American Indian and Alaska Native
Place of birth - Born in state of residence (%) - Multirace
Place of birth - Born in state of residence (%) - Other Race
Place of birth - Born in other state (%)
Place of birth - Born in other state (%) - White
Place of birth - Born in other state (%) - Black or African American
Place of birth - Born in other state (%) - Asian
Place of birth - Born in other state (%) - Hispanic or Latino
Place of birth - Born in other state (%) - American Indian and Alaska Native
Place of birth - Born in other state (%) - Multirace
Place of birth - Born in other state (%) - Other Race
Place of birth - Native, outside of US (%)
Place of birth - Native, outside of US (%) - White
Place of birth - Native, outside of US (%) - Black or African American
Place of birth - Native, outside of US (%) - Asian
Place of birth - Native, outside of US (%) - Hispanic or Latino
Place of birth - Native, outside of US (%) - American Indian and Alaska Native
Place of birth - Native, outside of US (%) - Multirace
Place of birth - Native, outside of US (%) - Other Race
Place of birth - Foreign born (%)
Place of birth - Foreign born (%) - White
Place of birth - Foreign born (%) - Black or African American
Place of birth - Foreign born (%) - Asian
Place of birth - Foreign born (%) - Hispanic or Latino
Place of birth - Foreign born (%) - American Indian and Alaska Native
Place of birth - Foreign born (%) - Multirace
Place of birth - Foreign born (%) - Other Race
Residents speaking English at home (%)
Residents speaking English at home - Born in the United States (%)
Residents speaking English at home - Native, born elsewhere (%)
Residents speaking English at home - Foreign born (%)
Residents speaking Spanish at home (%)
Residents speaking Spanish at home - Born in the United States (%)
Residents speaking Spanish at home - Native, born elsewhere (%)
Residents speaking Spanish at home - Foreign born (%)
Residents speaking other language at home (%)
Residents speaking other language at home - Born in the United States (%)
Residents speaking other language at home - Native, born elsewhere (%)
Residents speaking other language at home - Foreign born (%)
Marital status - Never married (%)
Marital status - Now married (%)
Marital status - Separated (%)
Marital status - Widowed (%)
Marital status - Divorced (%)
Ancestries Reported - Arab (%)
Ancestries Reported - Czech (%)
Ancestries Reported - Danish (%)
Ancestries Reported - Dutch (%)
Ancestries Reported - English (%)
Ancestries Reported - French (%)
Ancestries Reported - French Canadian (%)
Ancestries Reported - German (%)
Ancestries Reported - Greek (%)
Ancestries Reported - Hungarian (%)
Ancestries Reported - Irish (%)
Ancestries Reported - Italian (%)
Ancestries Reported - Lithuanian (%)
Ancestries Reported - Norwegian (%)
Ancestries Reported - Polish (%)
Ancestries Reported - Portuguese (%)
Ancestries Reported - Russian (%)
Ancestries Reported - Scotch-Irish (%)
Ancestries Reported - Scottish (%)
Ancestries Reported - Slovak (%)
Ancestries Reported - Subsaharan African (%)
Ancestries Reported - Swedish (%)
Ancestries Reported - Swiss (%)
Ancestries Reported - Ukrainian (%)
Ancestries Reported - United States (%)
Ancestries Reported - Welsh (%)
Ancestries Reported - West Indian (%)
Ancestries Reported - Other (%)
Geographical mobility - Same house 1 year ago (%)
Geographical mobility - Same house 1 year ago (%) - White
Geographical mobility - Same house 1 year ago (%) - Black or African American
Geographical mobility - Same house 1 year ago (%) - Asian
Geographical mobility - Same house 1 year ago (%) - Hispanic or Latino
Geographical mobility - Same house 1 year ago (%) - American Indian and Alaska Native
Geographical mobility - Same house 1 year ago (%) - Multirace
Geographical mobility - Same house 1 year ago (%) - Other Race
Geographical mobility - Moved within same county (%)
Geographical mobility - Moved within same county (%) - White
Geographical mobility - Moved within same county (%) - Black or African American
Geographical mobility - Moved within same county (%) - Asian
Geographical mobility - Moved within same county (%) - Hispanic or Latino
Geographical mobility - Moved within same county (%) - American Indian and Alaska Native
Geographical mobility - Moved within same county (%) - Multirace
Geographical mobility - Moved within same county (%) - Other Race
Geographical mobility - Moved from different county within same state (%)
Geographical mobility - Moved from different county within same state (%) - White
Geographical mobility - Moved from different county within same state (%) - Black or African American
Geographical mobility - Moved from different county within same state (%) - Asian
Geographical mobility - Moved from different county within same state (%) - Hispanic or Latino
Geographical mobility - Moved from different county within same state (%) - American Indian and Alaska Native
Geographical mobility - Moved from different county within same state (%) - Multirace
Geographical mobility - Moved from different county within same state (%) - Other Race
Geographical mobility - Moved from different state (%)
Geographical mobility - Moved from different state (%) - White
Geographical mobility - Moved from different state (%) - Black or African American
Geographical mobility - Moved from different state (%) - Asian
Geographical mobility - Moved from different state (%) - Hispanic or Latino
Geographical mobility - Moved from different state (%) - American Indian and Alaska Native
Geographical mobility - Moved from different state (%) - Multirace
Geographical mobility - Moved from different state (%) - Other Race
Geographical mobility - Moved from abroad (%)
Geographical mobility - Moved from abroad (%) - White
Geographical mobility - Moved from abroad (%) - Black or African American
Geographical mobility - Moved from abroad (%) - Asian
Geographical mobility - Moved from abroad (%) - Hispanic or Latino
Geographical mobility - Moved from abroad (%) - American Indian and Alaska Native
Geographical mobility - Moved from abroad (%) - Multirace
Geographical mobility - Moved from abroad (%) - Other Race
Place of birth for the foreign-born population - Ireland (%)
Place of birth for the foreign-born population - Denmark (%)
Place of birth for the foreign-born population - Norway (%)
Place of birth for the foreign-born population - Sweden (%)
Place of birth for the foreign-born population - United Kingdom (%)
Place of birth for the foreign-born population - England (%)
Place of birth for the foreign-born population - Scotland (%)
Place of birth for the foreign-born population - Other Northern Europe (%)
Place of birth for the foreign-born population - Austria (%)
Place of birth for the foreign-born population - Belgium (%)
Place of birth for the foreign-born population - France (%)
Place of birth for the foreign-born population - Germany (%)
Place of birth for the foreign-born population - Netherlands (%)
Place of birth for the foreign-born population - Switzerland (%)
Place of birth for the foreign-born population - Other Western Europe (%)
Place of birth for the foreign-born population - Greece (%)
Place of birth for the foreign-born population - Italy (%)
Place of birth for the foreign-born population - Portugal (%)
Place of birth for the foreign-born population - Spain (%)
Place of birth for the foreign-born population - Other Southern Europe (%)
Place of birth for the foreign-born population - Albania (%)
Place of birth for the foreign-born population - Belarus (%)
Place of birth for the foreign-born population - Bosnia and Herzegovina (%)
Place of birth for the foreign-born population - Bulgaria (%)
Place of birth for the foreign-born population - Croatia (%)
Place of birth for the foreign-born population - Czechoslovakia (%)
Place of birth for the foreign-born population - Hungary (%)
Place of birth for the foreign-born population - Latvia (%)
Place of birth for the foreign-born population - Lithuania (%)
Place of birth for the foreign-born population - North Macedonia (Macedonia) (%)
Place of birth for the foreign-born population - Moldova (%)
Place of birth for the foreign-born population - Poland (%)
Place of birth for the foreign-born population - Romania (%)
Place of birth for the foreign-born population - Russia (%)
Place of birth for the foreign-born population - Serbia (%)
Place of birth for the foreign-born population - Ukraine (%)
Place of birth for the foreign-born population - Other Eastern Europe (%)
Place of birth for the foreign-born population - China (%)
Place of birth for the foreign-born population - Hong Kong (%)
Place of birth for the foreign-born population - Taiwan (%)
Place of birth for the foreign-born population - Japan (%)
Place of birth for the foreign-born population - Korea (%)
Place of birth for the foreign-born population - Other Eastern Asia (%)
Place of birth for the foreign-born population - Afghanistan (%)
Place of birth for the foreign-born population - Bangladesh (%)
Place of birth for the foreign-born population - India (%)
Place of birth for the foreign-born population - Iran (%)
Place of birth for the foreign-born population - Kazakhstan (%)
Place of birth for the foreign-born population - Nepal (%)
Place of birth for the foreign-born population - Pakistan (%)
Place of birth for the foreign-born population - Sri Lanka (%)
Place of birth for the foreign-born population - Uzbekistan (%)
Place of birth for the foreign-born population - Other South Central Asia (%)
Place of birth for the foreign-born population - Burma (%)
Place of birth for the foreign-born population - Cambodia (%)
Place of birth for the foreign-born population - Indonesia (%)
Place of birth for the foreign-born population - Laos (%)
Place of birth for the foreign-born population - Malaysia (%)
Place of birth for the foreign-born population - Philippines (%)
Place of birth for the foreign-born population - Singapore (%)
Place of birth for the foreign-born population - Thailand (%)
Place of birth for the foreign-born population - Vietnam (%)
Place of birth for the foreign-born population - Other South Eastern Asia (%)
Place of birth for the foreign-born population - Armenia (%)
Place of birth for the foreign-born population - Iraq (%)
Place of birth for the foreign-born population - Israel (%)
Place of birth for the foreign-born population - Jordan (%)
Place of birth for the foreign-born population - Kuwait (%)
Place of birth for the foreign-born population - Lebanon (%)
Place of birth for the foreign-born population - Saudi Arabia (%)
Place of birth for the foreign-born population - Syria (%)
Place of birth for the foreign-born population - Turkey (%)
Place of birth for the foreign-born population - Yemen (%)
Place of birth for the foreign-born population - Other Western Asia (%)
Place of birth for the foreign-born population - Eritrea (%)
Place of birth for the foreign-born population - Ethiopia (%)
Place of birth for the foreign-born population - Kenya (%)
Place of birth for the foreign-born population - Somalia (%)
Place of birth for the foreign-born population - Uganda (%)
Place of birth for the foreign-born population - Zimbabwe (%)
Place of birth for the foreign-born population - Other Eastern Africa (%)
Place of birth for the foreign-born population - Cameroon (%)
Place of birth for the foreign-born population - Congo (%)
Place of birth for the foreign-born population - Democratic Republic of Congo (Zaire) (%)
Place of birth for the foreign-born population - Other Middle Africa (%)
Place of birth for the foreign-born population - Egypt (%)
Place of birth for the foreign-born population - Morocco (%)
Place of birth for the foreign-born population - Sudan (%)
Place of birth for the foreign-born population - Other Northern Africa (%)
Place of birth for the foreign-born population - South Africa (%)
Place of birth for the foreign-born population - Other Southern Africa (%)
Place of birth for the foreign-born population - Cabo Verde (%)
Place of birth for the foreign-born population - Ghana (%)
Place of birth for the foreign-born population - Liberia (%)
Place of birth for the foreign-born population - Nigeria (%)
Place of birth for the foreign-born population - Senegal (%)
Place of birth for the foreign-born population - Sierra Leone (%)
Place of birth for the foreign-born population - Other Western Africa (%)
Place of birth for the foreign-born population - Australia (%)
Place of birth for the foreign-born population - New Zealand (%)
Place of birth for the foreign-born population - Fiji (%)
Place of birth for the foreign-born population - Micronesia (%)
Place of birth for the foreign-born population - Bahamas (%)
Place of birth for the foreign-born population - Barbados (%)
Place of birth for the foreign-born population - Cuba (%)
Place of birth for the foreign-born population - Dominica (%)
Place of birth for the foreign-born population - Dominican Republic (%)
Place of birth for the foreign-born population - Grenada (%)
Place of birth for the foreign-born population - Haiti (%)
Place of birth for the foreign-born population - Jamaica (%)
Place of birth for the foreign-born population - St. Vincent and the Grenadines (%)
Place of birth for the foreign-born population - Trinidad and Tobago (%)
Place of birth for the foreign-born population - West Indies (%)
Place of birth for the foreign-born population - Other Caribbean (%)
Place of birth for the foreign-born population - Belize (%)
Place of birth for the foreign-born population - Costa Rica (%)
Place of birth for the foreign-born population - El Salvador (%)
Place of birth for the foreign-born population - Guatemala (%)
Place of birth for the foreign-born population - Honduras (%)
Place of birth for the foreign-born population - Mexico (%)
Place of birth for the foreign-born population - Nicaragua (%)
Place of birth for the foreign-born population - Panama (%)
Place of birth for the foreign-born population - Other Central America (%)
Place of birth for the foreign-born population - Argentina (%)
Place of birth for the foreign-born population - Bolivia (%)
Place of birth for the foreign-born population - Brazil (%)
Place of birth for the foreign-born population - Chile (%)
Place of birth for the foreign-born population - Colombia (%)
Place of birth for the foreign-born population - Ecuador (%)
Place of birth for the foreign-born population - Guyana (%)
Place of birth for the foreign-born population - Peru (%)
Place of birth for the foreign-born population - Uruguay (%)
Place of birth for the foreign-born population - Venezuela (%)
Place of birth for the foreign-born population - Other South America (%)
Place of birth for the foreign-born population - Canada (%)
Place of birth for the foreign-born population - Other Northern America (%)
Place of birth for the foreign-born population - Other (%)
Latest news about races in Roseville, MN collected exclusively by city-data.com from local newspapers, TV, and radio stations
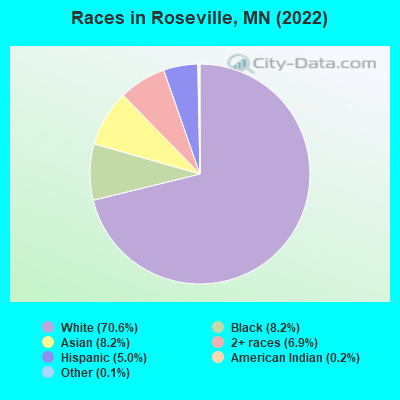
According to 2022 data, the most numerous races in Roseville, MN are White alone (24,971 residents), Black alone (2,907 residents), and Hispanic (1,783 residents). 85.4% of Roseville residents speak English at home. 11.4% of Roseville, MN residents are foreign-born (5.0% born in Asia, 3.4% born in Africa, 1.4% born in Latin America), which is 30.1% greater than the foreign-born rate of 8.0% across the entire state of Minnesota.
Race distribution in Roseville
2000 2022
4,337,143 88.2% White alone 168,813 3.4% Black alone 143,382 2.9% Hispanic 141,083 2.9% Asian alone 70,304 1.4% Two or more races 52,009 1.1% American Indian alone 5,031 0.1% Other race alone 1,714 0.03% Native Hawaiian and Other
4,356,347 76.2% White alone 395,179 6.9% Black alone 333,830 5.8% Hispanic 294,800 5.2% Asian alone 259,649 4.5% Two or more races 42,125 0.7% American Indian alone 32,976 0.6% Other race alone 2,278 0.04% Native Hawaiian and Other
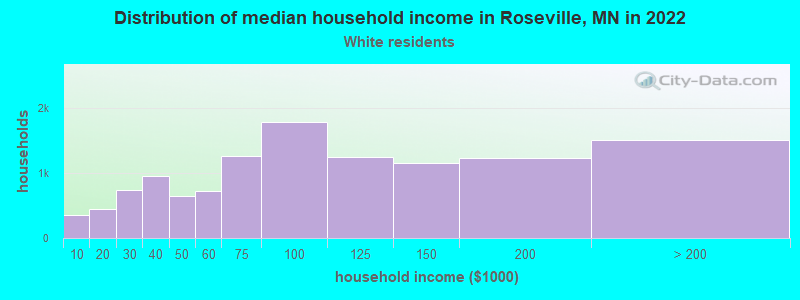
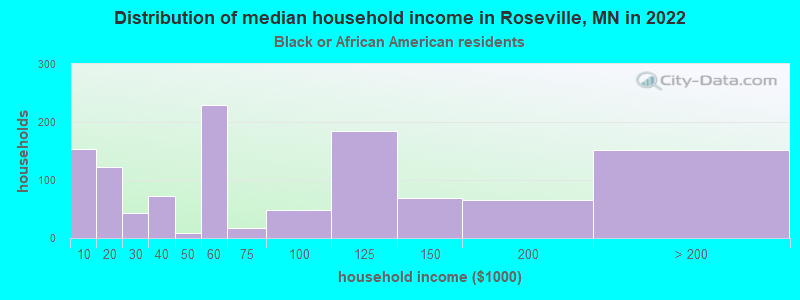
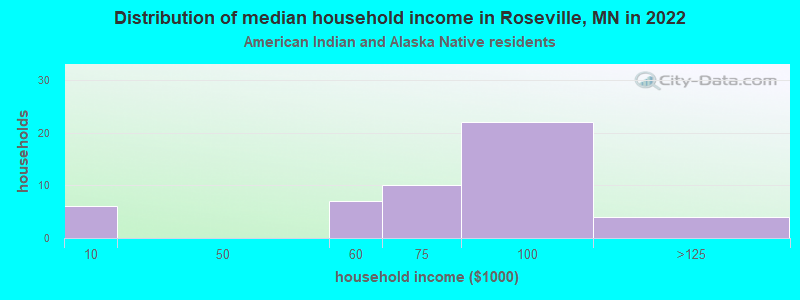
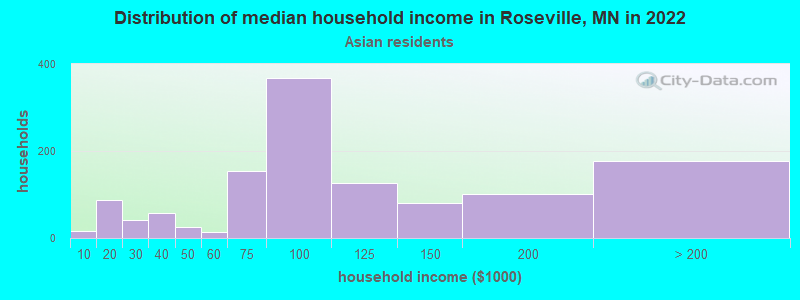
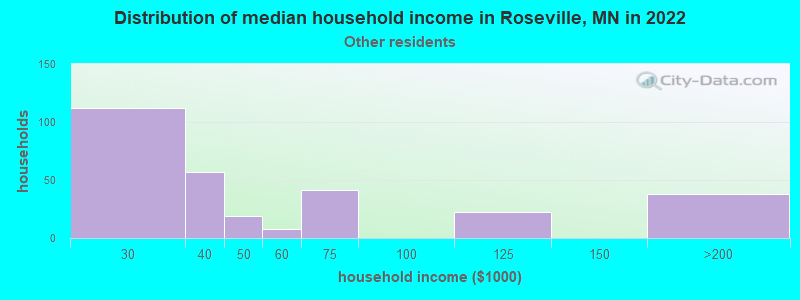
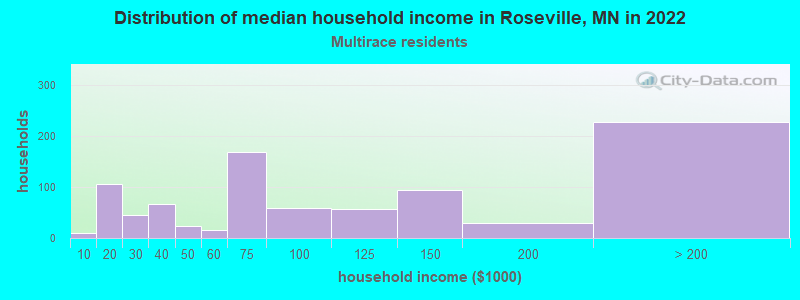
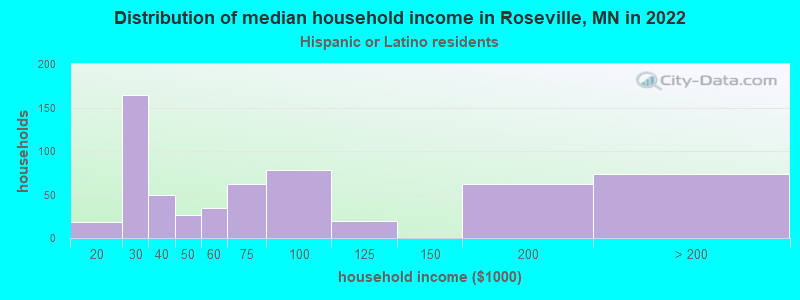
Income and house value in Roseville Median household income in 2022 $87,523 White non-Hispanic householders$50,347 Black householders$68,905 American Indian and Alaska Native householders$88,592 Asian householders$35,059 Some other race householders$72,800 Two or more races householders$62,947 Hispanic or Latino race householdersMedian 2022 house value $353,382 White Non-Hispanic householders$346,957 Black or African American householders$243,660 American Indian or Alaska Native householders $399,099 Asian householders$401,570 Native Hawaiian and other Pacific Islander householdersover $1,000,000 Some other race householders$350,169 Two or more races householders$388,720 Hispanic or Latino householders
Median age by race in Roseville
49.8 Median age for White residents47.0 51.4 31.2 Median age for Black or African American residents33.9 29.1 63.7 Median age for American Indian / Alaska Native residents75.7 55.7 32.7 Median age for Asian residents30.9 33.8 -744,336,568.8 Median age for Native Hawaiian / Pacific Islander residents-856,799,036.4 -534,959,349.1 25.6 Median age for Other race residents26.4 25.2 21.0 Median age for Two or more races residents22.8 17.3 49.3 Median age for White alone residents47.1 50.9 27.7 Median age for Hispanic or Latino residents30.9 23.5
Owner/renter occupied households by race in Roseville
House owners and renters - White residents 9,167 75.5% Owner occupied2,978 24.5% Renter occupiedHouse owners and renters - Black or African American residents 277 25.7% Owner occupied800 74.3% Renter occupiedHouse owners and renters - American Indian / Alaska Native residents 12 23.5% Owner occupied40 76.5% Renter occupiedHouse owners and renters - Asian residents 608 54.3% Owner occupied513 45.7% Renter occupiedHouse owners and renters - Other race residents 147 52.4% Owner occupied133 47.6% Renter occupiedHouse owners and renters - Two or more races residents 674 65.9% Owner occupied349 34.1% Renter occupiedHouse owners and renters - White alone residents 9,188 75.5% Owner occupied2,985 24.5% Renter occupiedHouse owners and renters - Hispanic or Latino residents 273 51.2% Owner occupied260 48.8% Renter occupied
Language usage in Roseville
English speakers - Total 85.4% of residents of Roseville speak English at home.
2.8% of residents speak Spanish at home 749 79.7% Speak English very well191 20.3% Speak English less than very well11.9% of residents speak other language at home 2,059 51.7% Speak English very well1,924 48.3% Speak English less than very well
English speakers - Born in the United States 95.7% of residents of Roseville speak English at home.
2.0% of residents speak Spanish at home 133 82.6% Speak English very well28 17.4% Speak English less than very well2.6% of residents speak other language at home 166 79.0% Speak English very well44 21.0% Speak English less than very well
English speakers - Native, born elsewhere 48.2% of residents of Roseville speak English at home.
32.1% of residents speak Spanish at home 125 100.0% Speak English very well20.3% of residents speak other language at home 79 100.0% Speak English very well
English speakers - Foreign-born 20.1% of residents of Roseville speak English at home.
8.8% of residents speak Spanish at home 241 71.7% Speak English very well95 28.3% Speak English less than very well69.5% of residents speak other language at home 1,061 39.8% Speak English very well1,605 60.2% Speak English less than very well
White (Caucasian) - Speak only English Native:
99.0% (23,342)Foreign-born:
58.7% (206)
White (Caucasian) - Speak another language Native:
1.4% (331)Foreign-born:
48.9% (172)
Black or African American - Speak only English Native:
84.0% (1,396)Foreign-born:
11.5% (130)
Black or African American - Speak another language Native:
15.4% (255)Foreign-born:
88.9% (1,003)
American Indian / Alaska Native - Speak only English Native:
66.9% (127)Foreign-born:
5.7% (8)
American Indian / Alaska Native - Speak another language Native:
42.1% (80)Foreign-born:
60.5% (84)
Asian - Speak only English Native:
29.7% (334)Foreign-born:
17.9% (295)
Asian - Speak another language Native:
69.4% (781)Foreign-born:
82.6% (1,364)
Other race - Speak only English Native:
57.4% (136)Foreign-born:
57.9% (203)
Other race - Speak another language Native:
43.1% (102)Foreign-born:
45.0% (158)
Two or more races - Speak only English Native:
87.7% (2,232)Foreign-born:
8.5% (11)
Two or more races - Speak another language Native:
12.3% (314)Foreign-born:
94.7% (125)
White alone - Speak only English Native:
98.5% (23,125)Foreign-born:
46.8% (231)
White alone - Speak another language Native:
1.6% (369)Foreign-born:
53.0% (262)
Hispanic or Latino - Speak only English Native:
60.9% (661)Foreign-born:
34.4% (167)
Hispanic or Latino - Speak another language Native:
38.5% (418)Foreign-born:
66.5% (323)
Foreign-born residents in Roseville 4,046 residents are foreign born (5.0% Asia , 3.4% Africa , 1.4% Latin America ).
This city:
11.4%Minnesota:
8.5%
Marital status for residents in Roseville Marital status - White (Caucasian) population 15 years and over
Males 33.5% Never married55.3% Now married0.7% Separated4.9% Widowed5.6% DivorcedFemales 27.1% Never married51.3% Now married0.1% Separated11.8% Widowed9.8% DivorcedWomen who gave birth in the past 12 months Now married:
93.4% (286)Unmarried:
6.6% (20)
Women who did not give birth in the past 12 months Now married:
43.5% (2,078)Unmarried:
56.5% (2,702)
Marital status - Black or African American population 15 years and over
Males 54.5% Never married38.0% Now married0.0% Separated1.9% Widowed5.6% DivorcedFemales 55.0% Never married32.7% Now married1.8% Separated7.3% Widowed3.2% DivorcedWomen who gave birth in the past 12 months Now married:
100.0% (38)Unmarried:
0.0% (0)
Women who did not give birth in the past 12 months Now married:
30.5% (303)Unmarried:
69.5% (692)
Marital status - American Indian / Alaska Native population 15 years and over
Males 38.2% Never married36.8% Now married9.2% Separated0.0% Widowed15.8% DivorcedFemales 24.8% Never married67.3% Now married0.0% Separated5.2% Widowed2.6% DivorcedWomen who did not give birth in the past 12 months Now married:
43.3% (30)Unmarried:
56.7% (40)
Marital status - Asian population 15 years and over
Males 36.5% Never married58.4% Now married0.8% Separated4.3% Widowed0.0% DivorcedFemales 38.3% Never married49.2% Now married1.0% Separated4.4% Widowed7.0% DivorcedWomen who gave birth in the past 12 months Now married:
100.0% (27)Unmarried:
0.0% (0)
Women who did not give birth in the past 12 months Now married:
43.5% (449)Unmarried:
56.5% (584)
Marital status - Other race population 15 years and over
Males 25.0% Never married75.0% Now married0.0% Separated0.0% Widowed0.0% DivorcedFemales 25.3% Never married41.4% Now married0.0% Separated0.0% Widowed33.3% DivorcedWomen who gave birth in the past 12 months Now married:
100.0% (104)Unmarried:
0.0% (0)
Women who did not give birth in the past 12 months Now married:
6.4% (5)Unmarried:
93.6% (75)
Marital status - Two or more races population 15 years and over
Males 41.9% Never married54.0% Now married1.5% Separated1.1% Widowed1.4% DivorcedFemales 55.0% Never married34.6% Now married2.5% Separated1.2% Widowed6.7% DivorcedWomen who did not give birth in the past 12 months Now married:
37.4% (201)Unmarried:
62.6% (336)
Marital status - White alone, not Hispanic / Latino population 15 years and over
Males 32.5% Never married56.0% Now married0.7% Separated5.0% Widowed5.7% DivorcedFemales 26.1% Never married52.0% Now married0.0% Separated12.0% Widowed9.9% DivorcedWomen who gave birth in the past 12 months Now married:
93.1% (283)Unmarried:
6.9% (21)
Women who did not give birth in the past 12 months Now married:
45.1% (2,143)Unmarried:
54.9% (2,609)
Marital status - Hispanic or Latino population 15 years and over
Males 46.6% Never married44.6% Now married0.0% Separated0.0% Widowed8.8% DivorcedFemales 50.6% Never married37.5% Now married0.7% Separated1.5% Widowed9.7% DivorcedWomen who gave birth in the past 12 months Now married:
100.0% (74)Unmarried:
0.0% (0)
Women who did not give birth in the past 12 months Now married:
18.2% (80)Unmarried:
81.8% (358)
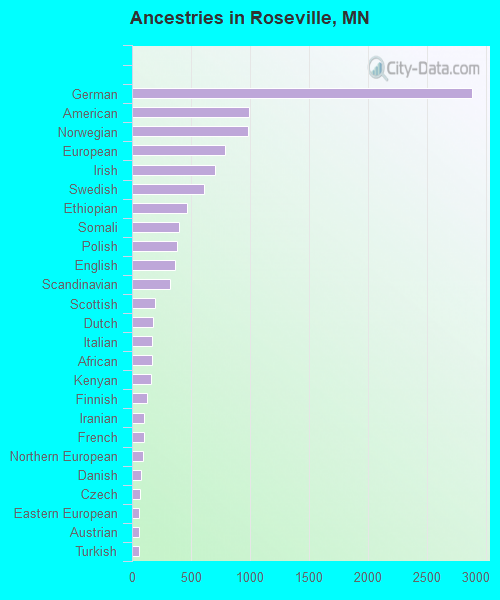
Ancestries in Roseville
2,885 18.2% German996 6.3% American983 6.2% Norwegian792 5.0% European701 4.4% Irish608 3.8% Swedish469 3.0% Ethiopian397 2.5% Somali380 2.4% Polish369 2.3% English321 2.0% Scandinavian193 1.2% Scottish178 1.1% Dutch172 1.1% Italian167 1.1% African163 1.0% Kenyan131 0.8% Finnish103 0.7% Iranian100 0.6% French92 0.6% Northern European78 0.5% Danish70 0.4% Czech62 0.4% Eastern European62 0.4% Austrian59 0.4% Turkish55 0.3% Ukrainian52 0.3% Swiss47 0.3% Czechoslovakian40 0.3% British30 0.2% Slovene30 0.2% Ugandan28 0.2% Ghanaian28 0.2% Palestinian27 0.2% Nigerian23 0.1% Romanian23 0.1% Hungarian22 0.1% Russian22 0.1% French Canadian18 0.1% Iraqi18 0.1% Jamaican7 0.04% Serbian7 0.04% Welsh6 0.04% Slavic5 0.03% Lebanese4 0.03% Yugoslavian
Geographical mobility in Roseville Same house 1 year ago 20,855 84.8% White (Caucasian)2,675 90.8% Black or African American227 93.9% American Indian / Alaska Native2,596 88.5% Asian528 75.9% Other race2,918 94.2% Two or more races21,063 85.1% White alone, not Hispanic / Latino1,417 82.0% Hispanic or LatinoMoved within same county 1,808 7.4% White / Caucasian127 4.3% Black or African American1 0.3% American Indian / Alaska Native107 3.6% Asian24 3.4% Other race72 2.3% Two or more races1,799 7.3% White alone, not Hispanic / Latino131 7.6% Hispanic or LatinoMoved within same state 1,343 5.5% White / Caucasian100 3.4% Black or African American7 2.8% American Indian / Alaska Native138 4.7% Asian74 10.6% Other race53 1.7% Two or more races1,345 5.4% White alone, not Hispanic / Latino118 6.8% Hispanic or LatinoMoved from different state 425 1.7% White / Caucasian36 1.2% Black or African American10 4.1% American Indian / Alaska Native53 1.8% Asian22 3.1% Other race394 1.6% White alone, not Hispanic / Latino33 1.9% Hispanic or LatinoMoved from abroad 108 0.4% White21 0.7% Black or African American27 0.9% Asian104 0.4% White alone, not Hispanic / Latino
Children Nativity (place of birth) in Roseville
Children under 6 years - Living with two parents Both parents native 1,178 100.0% NativeBoth parents foreign-born 177 100.0% NativeOne native, one foreign-born parent 291 100.0% NativeChildren under 6 years - Living with one parent Native parent 262 100.0% NativeForeign-born parent 106 100.0% NativeChildren 6 to 17 years - Living with two parents Both parents native 2,119 99.7% Native5 0.3% Foreign-bornBoth parents foreign-born 373 82.3% Native80 17.7% Foreign-bornOne native, one foreign-born parent 409 100.0% NativeChildren 6 to 17 years - Living with one parent Native parent 828 100.0% NativeForeign-born parent 272 54.6% Native226 45.4% Foreign-born
Grandparents responsible for own grandchildren in Roseville
Grandparents (30 to 59 years) White / Caucasian 43 38.2% Responsible for grandchildren70 61.8% Not responsible for grandchildrenBlack or African American 27 100.0% Not responsible for grandchildrenWhite alone, not Hispanic / Latino 43 42.3% Responsible for grandchildren59 57.7% Not responsible for grandchildren
Grandparents (60 years and over) White / Caucasian 125 100.0% Not responsible for grandchildrenBlack or African American 32 100.0% Not responsible for grandchildrenWhite alone, not Hispanic / Latino 131 100.0% Not responsible for grandchildren