Races in Somerville, New Jersey (NJ) Detailed Stats
Data:
Races - White alone (%)
Races - White alone (% change since 2000)
Races - Black alone (%)
Races - Black alone (% change since 2000)
Races - American Indian alone (%)
Races - American Indian alone (% change since 2000)
Races - Asian alone (%)
Races - Asian alone (% change since 2000)
Races - Hispanic (%)
Races - Hispanic (% change since 2000)
Races - Native Hawaiian and Other Pacific Islander alone (%)
Races - Native Hawaiian and Other Pacific Islander alone (% change since 2000)
Races - Two or more races(%)
Races - Two or more races(% change since 2000)
Races - Other race alone (%)
Races - Other race alone (% change since 2000)
Racial diversity
Place of birth - Born in state of residence (%)
Place of birth - Born in state of residence (%) - White
Place of birth - Born in state of residence (%) - Black or African American
Place of birth - Born in state of residence (%) - Asian
Place of birth - Born in state of residence (%) - Hispanic or Latino
Place of birth - Born in state of residence (%) - American Indian and Alaska Native
Place of birth - Born in state of residence (%) - Multirace
Place of birth - Born in state of residence (%) - Other Race
Place of birth - Born in other state (%)
Place of birth - Born in other state (%) - White
Place of birth - Born in other state (%) - Black or African American
Place of birth - Born in other state (%) - Asian
Place of birth - Born in other state (%) - Hispanic or Latino
Place of birth - Born in other state (%) - American Indian and Alaska Native
Place of birth - Born in other state (%) - Multirace
Place of birth - Born in other state (%) - Other Race
Place of birth - Native, outside of US (%)
Place of birth - Native, outside of US (%) - White
Place of birth - Native, outside of US (%) - Black or African American
Place of birth - Native, outside of US (%) - Asian
Place of birth - Native, outside of US (%) - Hispanic or Latino
Place of birth - Native, outside of US (%) - American Indian and Alaska Native
Place of birth - Native, outside of US (%) - Multirace
Place of birth - Native, outside of US (%) - Other Race
Place of birth - Foreign born (%)
Place of birth - Foreign born (%) - White
Place of birth - Foreign born (%) - Black or African American
Place of birth - Foreign born (%) - Asian
Place of birth - Foreign born (%) - Hispanic or Latino
Place of birth - Foreign born (%) - American Indian and Alaska Native
Place of birth - Foreign born (%) - Multirace
Place of birth - Foreign born (%) - Other Race
Residents speaking English at home (%)
Residents speaking English at home - Born in the United States (%)
Residents speaking English at home - Native, born elsewhere (%)
Residents speaking English at home - Foreign born (%)
Residents speaking Spanish at home (%)
Residents speaking Spanish at home - Born in the United States (%)
Residents speaking Spanish at home - Native, born elsewhere (%)
Residents speaking Spanish at home - Foreign born (%)
Residents speaking other language at home (%)
Residents speaking other language at home - Born in the United States (%)
Residents speaking other language at home - Native, born elsewhere (%)
Residents speaking other language at home - Foreign born (%)
Marital status - Never married (%)
Marital status - Now married (%)
Marital status - Separated (%)
Marital status - Widowed (%)
Marital status - Divorced (%)
Ancestries Reported - Arab (%)
Ancestries Reported - Czech (%)
Ancestries Reported - Danish (%)
Ancestries Reported - Dutch (%)
Ancestries Reported - English (%)
Ancestries Reported - French (%)
Ancestries Reported - French Canadian (%)
Ancestries Reported - German (%)
Ancestries Reported - Greek (%)
Ancestries Reported - Hungarian (%)
Ancestries Reported - Irish (%)
Ancestries Reported - Italian (%)
Ancestries Reported - Lithuanian (%)
Ancestries Reported - Norwegian (%)
Ancestries Reported - Polish (%)
Ancestries Reported - Portuguese (%)
Ancestries Reported - Russian (%)
Ancestries Reported - Scotch-Irish (%)
Ancestries Reported - Scottish (%)
Ancestries Reported - Slovak (%)
Ancestries Reported - Subsaharan African (%)
Ancestries Reported - Swedish (%)
Ancestries Reported - Swiss (%)
Ancestries Reported - Ukrainian (%)
Ancestries Reported - United States (%)
Ancestries Reported - Welsh (%)
Ancestries Reported - West Indian (%)
Ancestries Reported - Other (%)
Geographical mobility - Same house 1 year ago (%)
Geographical mobility - Same house 1 year ago (%) - White
Geographical mobility - Same house 1 year ago (%) - Black or African American
Geographical mobility - Same house 1 year ago (%) - Asian
Geographical mobility - Same house 1 year ago (%) - Hispanic or Latino
Geographical mobility - Same house 1 year ago (%) - American Indian and Alaska Native
Geographical mobility - Same house 1 year ago (%) - Multirace
Geographical mobility - Same house 1 year ago (%) - Other Race
Geographical mobility - Moved within same county (%)
Geographical mobility - Moved within same county (%) - White
Geographical mobility - Moved within same county (%) - Black or African American
Geographical mobility - Moved within same county (%) - Asian
Geographical mobility - Moved within same county (%) - Hispanic or Latino
Geographical mobility - Moved within same county (%) - American Indian and Alaska Native
Geographical mobility - Moved within same county (%) - Multirace
Geographical mobility - Moved within same county (%) - Other Race
Geographical mobility - Moved from different county within same state (%)
Geographical mobility - Moved from different county within same state (%) - White
Geographical mobility - Moved from different county within same state (%) - Black or African American
Geographical mobility - Moved from different county within same state (%) - Asian
Geographical mobility - Moved from different county within same state (%) - Hispanic or Latino
Geographical mobility - Moved from different county within same state (%) - American Indian and Alaska Native
Geographical mobility - Moved from different county within same state (%) - Multirace
Geographical mobility - Moved from different county within same state (%) - Other Race
Geographical mobility - Moved from different state (%)
Geographical mobility - Moved from different state (%) - White
Geographical mobility - Moved from different state (%) - Black or African American
Geographical mobility - Moved from different state (%) - Asian
Geographical mobility - Moved from different state (%) - Hispanic or Latino
Geographical mobility - Moved from different state (%) - American Indian and Alaska Native
Geographical mobility - Moved from different state (%) - Multirace
Geographical mobility - Moved from different state (%) - Other Race
Geographical mobility - Moved from abroad (%)
Geographical mobility - Moved from abroad (%) - White
Geographical mobility - Moved from abroad (%) - Black or African American
Geographical mobility - Moved from abroad (%) - Asian
Geographical mobility - Moved from abroad (%) - Hispanic or Latino
Geographical mobility - Moved from abroad (%) - American Indian and Alaska Native
Geographical mobility - Moved from abroad (%) - Multirace
Geographical mobility - Moved from abroad (%) - Other Race
Place of birth for the foreign-born population - Ireland (%)
Place of birth for the foreign-born population - Denmark (%)
Place of birth for the foreign-born population - Norway (%)
Place of birth for the foreign-born population - Sweden (%)
Place of birth for the foreign-born population - United Kingdom (%)
Place of birth for the foreign-born population - England (%)
Place of birth for the foreign-born population - Scotland (%)
Place of birth for the foreign-born population - Other Northern Europe (%)
Place of birth for the foreign-born population - Austria (%)
Place of birth for the foreign-born population - Belgium (%)
Place of birth for the foreign-born population - France (%)
Place of birth for the foreign-born population - Germany (%)
Place of birth for the foreign-born population - Netherlands (%)
Place of birth for the foreign-born population - Switzerland (%)
Place of birth for the foreign-born population - Other Western Europe (%)
Place of birth for the foreign-born population - Greece (%)
Place of birth for the foreign-born population - Italy (%)
Place of birth for the foreign-born population - Portugal (%)
Place of birth for the foreign-born population - Spain (%)
Place of birth for the foreign-born population - Other Southern Europe (%)
Place of birth for the foreign-born population - Albania (%)
Place of birth for the foreign-born population - Belarus (%)
Place of birth for the foreign-born population - Bosnia and Herzegovina (%)
Place of birth for the foreign-born population - Bulgaria (%)
Place of birth for the foreign-born population - Croatia (%)
Place of birth for the foreign-born population - Czechoslovakia (%)
Place of birth for the foreign-born population - Hungary (%)
Place of birth for the foreign-born population - Latvia (%)
Place of birth for the foreign-born population - Lithuania (%)
Place of birth for the foreign-born population - North Macedonia (Macedonia) (%)
Place of birth for the foreign-born population - Moldova (%)
Place of birth for the foreign-born population - Poland (%)
Place of birth for the foreign-born population - Romania (%)
Place of birth for the foreign-born population - Russia (%)
Place of birth for the foreign-born population - Serbia (%)
Place of birth for the foreign-born population - Ukraine (%)
Place of birth for the foreign-born population - Other Eastern Europe (%)
Place of birth for the foreign-born population - China (%)
Place of birth for the foreign-born population - Hong Kong (%)
Place of birth for the foreign-born population - Taiwan (%)
Place of birth for the foreign-born population - Japan (%)
Place of birth for the foreign-born population - Korea (%)
Place of birth for the foreign-born population - Other Eastern Asia (%)
Place of birth for the foreign-born population - Afghanistan (%)
Place of birth for the foreign-born population - Bangladesh (%)
Place of birth for the foreign-born population - India (%)
Place of birth for the foreign-born population - Iran (%)
Place of birth for the foreign-born population - Kazakhstan (%)
Place of birth for the foreign-born population - Nepal (%)
Place of birth for the foreign-born population - Pakistan (%)
Place of birth for the foreign-born population - Sri Lanka (%)
Place of birth for the foreign-born population - Uzbekistan (%)
Place of birth for the foreign-born population - Other South Central Asia (%)
Place of birth for the foreign-born population - Burma (%)
Place of birth for the foreign-born population - Cambodia (%)
Place of birth for the foreign-born population - Indonesia (%)
Place of birth for the foreign-born population - Laos (%)
Place of birth for the foreign-born population - Malaysia (%)
Place of birth for the foreign-born population - Philippines (%)
Place of birth for the foreign-born population - Singapore (%)
Place of birth for the foreign-born population - Thailand (%)
Place of birth for the foreign-born population - Vietnam (%)
Place of birth for the foreign-born population - Other South Eastern Asia (%)
Place of birth for the foreign-born population - Armenia (%)
Place of birth for the foreign-born population - Iraq (%)
Place of birth for the foreign-born population - Israel (%)
Place of birth for the foreign-born population - Jordan (%)
Place of birth for the foreign-born population - Kuwait (%)
Place of birth for the foreign-born population - Lebanon (%)
Place of birth for the foreign-born population - Saudi Arabia (%)
Place of birth for the foreign-born population - Syria (%)
Place of birth for the foreign-born population - Turkey (%)
Place of birth for the foreign-born population - Yemen (%)
Place of birth for the foreign-born population - Other Western Asia (%)
Place of birth for the foreign-born population - Eritrea (%)
Place of birth for the foreign-born population - Ethiopia (%)
Place of birth for the foreign-born population - Kenya (%)
Place of birth for the foreign-born population - Somalia (%)
Place of birth for the foreign-born population - Uganda (%)
Place of birth for the foreign-born population - Zimbabwe (%)
Place of birth for the foreign-born population - Other Eastern Africa (%)
Place of birth for the foreign-born population - Cameroon (%)
Place of birth for the foreign-born population - Congo (%)
Place of birth for the foreign-born population - Democratic Republic of Congo (Zaire) (%)
Place of birth for the foreign-born population - Other Middle Africa (%)
Place of birth for the foreign-born population - Egypt (%)
Place of birth for the foreign-born population - Morocco (%)
Place of birth for the foreign-born population - Sudan (%)
Place of birth for the foreign-born population - Other Northern Africa (%)
Place of birth for the foreign-born population - South Africa (%)
Place of birth for the foreign-born population - Other Southern Africa (%)
Place of birth for the foreign-born population - Cabo Verde (%)
Place of birth for the foreign-born population - Ghana (%)
Place of birth for the foreign-born population - Liberia (%)
Place of birth for the foreign-born population - Nigeria (%)
Place of birth for the foreign-born population - Senegal (%)
Place of birth for the foreign-born population - Sierra Leone (%)
Place of birth for the foreign-born population - Other Western Africa (%)
Place of birth for the foreign-born population - Australia (%)
Place of birth for the foreign-born population - New Zealand (%)
Place of birth for the foreign-born population - Fiji (%)
Place of birth for the foreign-born population - Micronesia (%)
Place of birth for the foreign-born population - Bahamas (%)
Place of birth for the foreign-born population - Barbados (%)
Place of birth for the foreign-born population - Cuba (%)
Place of birth for the foreign-born population - Dominica (%)
Place of birth for the foreign-born population - Dominican Republic (%)
Place of birth for the foreign-born population - Grenada (%)
Place of birth for the foreign-born population - Haiti (%)
Place of birth for the foreign-born population - Jamaica (%)
Place of birth for the foreign-born population - St. Vincent and the Grenadines (%)
Place of birth for the foreign-born population - Trinidad and Tobago (%)
Place of birth for the foreign-born population - West Indies (%)
Place of birth for the foreign-born population - Other Caribbean (%)
Place of birth for the foreign-born population - Belize (%)
Place of birth for the foreign-born population - Costa Rica (%)
Place of birth for the foreign-born population - El Salvador (%)
Place of birth for the foreign-born population - Guatemala (%)
Place of birth for the foreign-born population - Honduras (%)
Place of birth for the foreign-born population - Mexico (%)
Place of birth for the foreign-born population - Nicaragua (%)
Place of birth for the foreign-born population - Panama (%)
Place of birth for the foreign-born population - Other Central America (%)
Place of birth for the foreign-born population - Argentina (%)
Place of birth for the foreign-born population - Bolivia (%)
Place of birth for the foreign-born population - Brazil (%)
Place of birth for the foreign-born population - Chile (%)
Place of birth for the foreign-born population - Colombia (%)
Place of birth for the foreign-born population - Ecuador (%)
Place of birth for the foreign-born population - Guyana (%)
Place of birth for the foreign-born population - Peru (%)
Place of birth for the foreign-born population - Uruguay (%)
Place of birth for the foreign-born population - Venezuela (%)
Place of birth for the foreign-born population - Other South America (%)
Place of birth for the foreign-born population - Canada (%)
Place of birth for the foreign-born population - Other Northern America (%)
Place of birth for the foreign-born population - Other (%)
Latest news about races in Somerville, NJ collected exclusively by city-data.com from local newspapers, TV, and radio stations
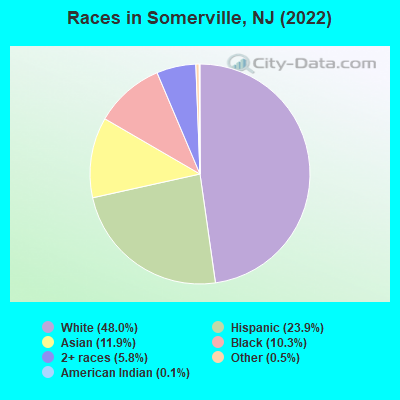
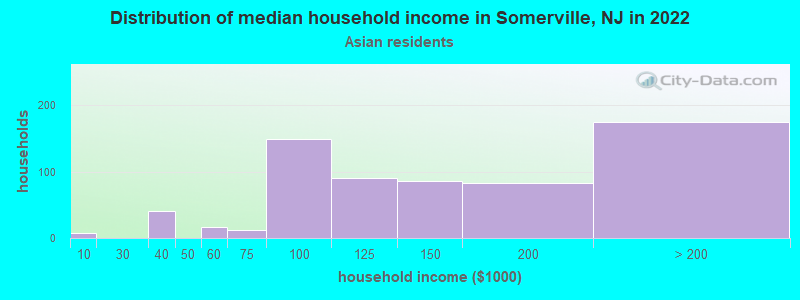
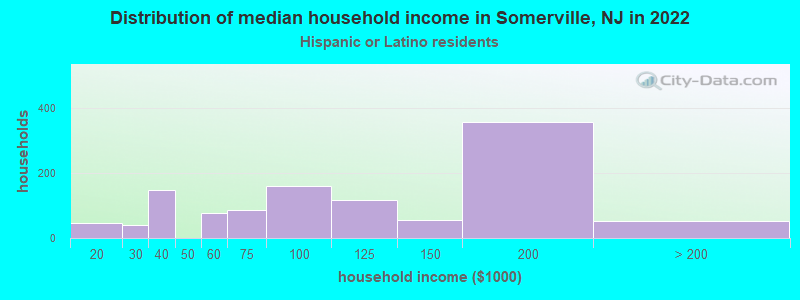
According to 2022 data, the most numerous races in Somerville, NJ are White alone (6,019 residents), Hispanic (2,992 residents), and Black alone (1,297 residents). 63.5% of Somerville residents speak English at home. 27.5% of Somerville, NJ residents are foreign-born (12.7% born in Latin America, 11.6% born in Asia), which is 16.4% greater than the foreign-born rate of 23.0% across the entire state of New Jersey.
Race distribution in Somerville
2000 2022
5,557,209 66.0% White alone 1,117,191 13.3% Hispanic 1,096,171 13.0% Black alone 477,012 5.7% Asian alone 133,689 1.6% Two or more races 19,565 0.2% Other race alone 11,338 0.1% American Indian alone 2,175 0.03% Native Hawaiian and Other
4,766,476 51.5% White alone 2,028,470 21.9% Hispanic 1,111,632 12.0% Black alone 923,546 10.0% Asian alone 332,237 3.6% Two or more races 89,847 1.0% Other race alone 8,557 0.09% American Indian alone 934 0.01% Native Hawaiian and Other
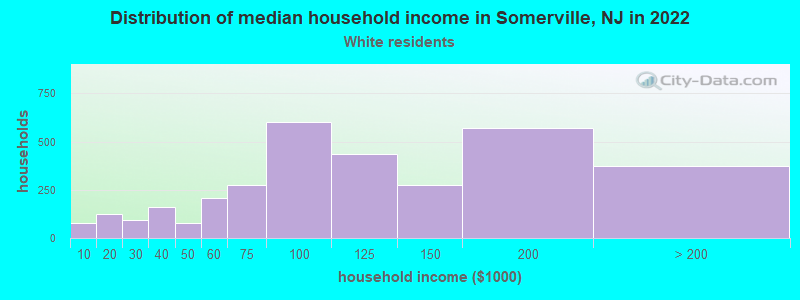
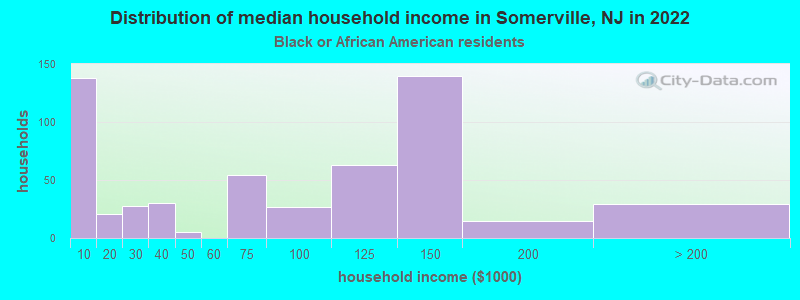
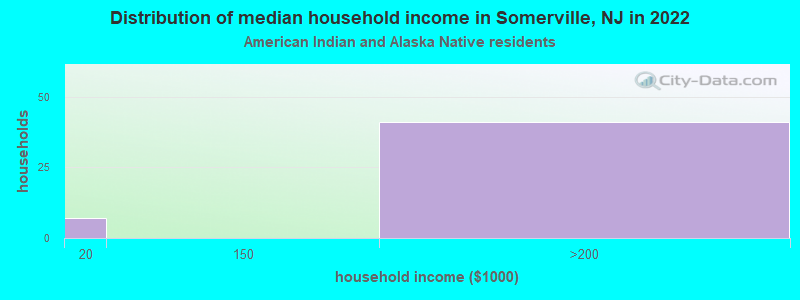
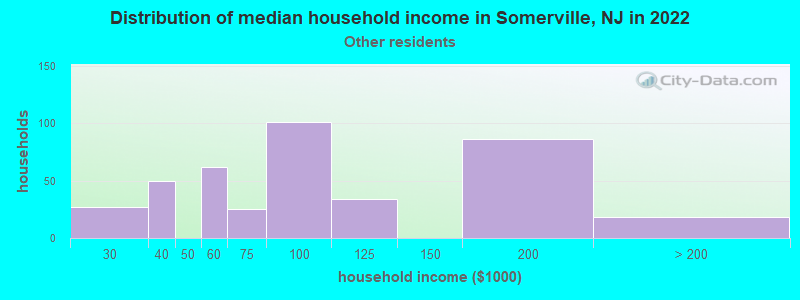
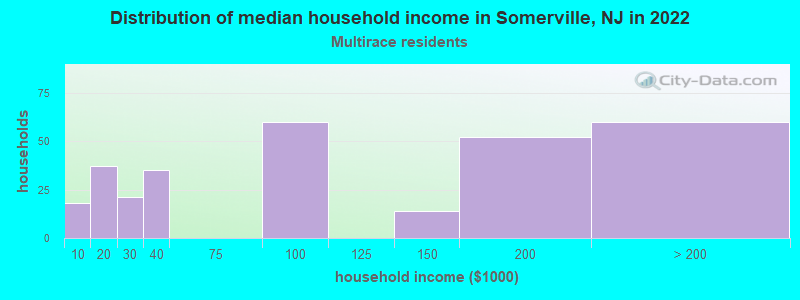
Income and house value in Somerville Median household income in 2022 $106,032 White non-Hispanic householders$108,608 Black householders$129,302 Asian householders$94,788 Some other race householders$102,919 Hispanic or Latino race householdersMedian 2022 house value $385,363 White Non-Hispanic householders$336,555 Black or African American householders $382,935 Asian householders$338,255 Some other race householders$407,703 Two or more races householders$336,069 Hispanic or Latino householders
Median age by race in Somerville
35.9 Median age for White residents36.7 35.4 38.1 Median age for Black or African American residents37.9 37.2 34.4 Median age for American Indian / Alaska Native residents-643,500,642.9 -1,220,338,981.8 36.6 Median age for Asian residents37.7 35.5 -804,177,544.9 Median age for Native Hawaiian / Pacific Islander residents-666,666,666.0 -713,070,378.3 33.6 Median age for Other race residents31.6 33.4 39.2 Median age for Two or more races residents40.6 22.0 37.9 Median age for White alone residents38.5 36.3 33.3 Median age for Hispanic or Latino residents33.3 33.3
Owner/renter occupied households by race in Somerville
House owners and renters - White residents 1,820 58.7% Owner occupied1,279 41.3% Renter occupiedHouse owners and renters - Black or African American residents 138 25.9% Owner occupied394 74.1% Renter occupiedHouse owners and renters - American Indian / Alaska Native residents 37 67.5% Owner occupied18 32.5% Renter occupiedHouse owners and renters - Asian residents 152 29.0% Owner occupied371 71.0% Renter occupiedHouse owners and renters - Other race residents 104 29.4% Owner occupied251 70.6% Renter occupiedHouse owners and renters - Two or more races residents 168 47.3% Owner occupied187 52.7% Renter occupiedHouse owners and renters - White alone residents 1,778 63.5% Owner occupied1,022 36.5% Renter occupiedHouse owners and renters - Hispanic or Latino residents 285 26.9% Owner occupied776 73.1% Renter occupied
Language usage in Somerville
English speakers - Total 63.5% of residents of Somerville speak English at home.
17.5% of residents speak Spanish at home 1,082 52.8% Speak English very well967 47.2% Speak English less than very well18.9% of residents speak other language at home 1,742 79.0% Speak English very well463 21.0% Speak English less than very well
English speakers - Born in the United States 92.5% of residents of Somerville speak English at home.
2.5% of residents speak Spanish at home 53 100.0% Speak English very well4.5% of residents speak other language at home 95 100.0% Speak English very well
English speakers - Native, born elsewhere 27.7% of residents of Somerville speak English at home.
84.7% of residents speak Spanish at home 364 100.0% Speak English less than very well8.4% of residents speak other language at home 36 100.0% Speak English very well
English speakers - Foreign-born 22.1% of residents of Somerville speak English at home.
30.2% of residents speak Spanish at home 475 47.2% Speak English very well531 52.8% Speak English less than very well46.5% of residents speak other language at home 1,094 70.8% Speak English very well452 29.2% Speak English less than very well
White (Caucasian) - Speak only English Native:
86.8% (5,101)Foreign-born:
17.9% (132)
White (Caucasian) - Speak another language Native:
13.2% (774)Foreign-born:
82.4% (604)
Black or African American - Speak only English Native:
83.3% (765)Foreign-born:
34.3% (144)
Black or African American - Speak another language Native:
10.4% (95)Foreign-born:
40.8% (171)
American Indian / Alaska Native - Speak another language Native:
72.0% (26)Foreign-born:
97.6% (39)
Asian - Speak only English Native:
48.1% (107)Foreign-born:
28.4% (360)
Asian - Speak another language Native:
51.6% (115)Foreign-born:
71.3% (903)
Other race - Speak only English Native:
22.0% (122)Foreign-born:
11.2% (54)
Other race - Speak another language Native:
76.5% (424)Foreign-born:
89.5% (431)
Two or more races - Speak only English Native:
89.5% (486)Foreign-born:
5.7% (23)
Two or more races - Speak another language Native:
11.8% (64)Foreign-born:
94.1% (374)
White alone - Speak only English Native:
93.1% (4,803)Foreign-born:
31.5% (128)
White alone - Speak another language Native:
7.0% (362)Foreign-born:
65.5% (266)
Hispanic or Latino - Speak only English Native:
38.3% (640)Foreign-born:
5.3% (62)
Hispanic or Latino - Speak another language Native:
62.0% (1,036)Foreign-born:
93.9% (1,093)
Foreign-born residents in Somerville 3,450 residents are foreign born (12.7% Latin America , 11.6% Asia ).
This city:
27.5%New Jersey:
23.2%
Marital status for residents in Somerville Marital status - White (Caucasian) population 15 years and over
Males 41.9% Never married42.7% Now married3.0% Separated1.6% Widowed10.8% DivorcedFemales 28.5% Never married49.6% Now married0.6% Separated10.6% Widowed10.7% DivorcedWomen who gave birth in the past 12 months Now married:
100.0% (71)Unmarried:
0.0% (0)
Women who did not give birth in the past 12 months Now married:
53.9% (950)Unmarried:
46.1% (814)
Marital status - Black or African American population 15 years and over
Males 54.4% Never married36.2% Now married0.0% Separated6.7% Widowed2.7% DivorcedFemales 65.0% Never married22.9% Now married0.0% Separated2.6% Widowed9.4% DivorcedWomen who gave birth in the past 12 months Now married:
0.0% (0)Unmarried:
100.0% (3)
Women who did not give birth in the past 12 months Now married:
0.0% (0)Unmarried:
100.0% (297)
Marital status - American Indian / Alaska Native population 15 years and over
Males 0.0% Never married100.0% Now married0.0% Separated0.0% Widowed0.0% DivorcedFemales 0.0% Never married100.0% Now married0.0% Separated0.0% Widowed0.0% DivorcedWomen who did not give birth in the past 12 months Now married:
100.0% (17)Unmarried:
0.0% (0)
Marital status - Asian population 15 years and over
Males 36.9% Never married58.6% Now married0.0% Separated0.0% Widowed4.6% DivorcedFemales 27.7% Never married60.0% Now married1.7% Separated7.2% Widowed3.4% DivorcedWomen who gave birth in the past 12 months Now married:
100.0% (23)Unmarried:
0.0% (0)
Women who did not give birth in the past 12 months Now married:
61.4% (306)Unmarried:
38.6% (193)
Marital status - Other race population 15 years and over
Males 43.7% Never married37.8% Now married3.9% Separated0.0% Widowed14.7% DivorcedFemales 44.5% Never married42.1% Now married5.0% Separated5.6% Widowed2.7% DivorcedWomen who did not give birth in the past 12 months Now married:
25.2% (62)Unmarried:
74.8% (183)
Marital status - Two or more races population 15 years and over
Males 37.5% Never married52.4% Now married0.0% Separated6.3% Widowed3.7% DivorcedFemales 18.9% Never married76.5% Now married0.0% Separated0.0% Widowed4.6% DivorcedWomen who did not give birth in the past 12 months Now married:
71.8% (179)Unmarried:
28.2% (71)
Marital status - White alone, not Hispanic / Latino population 15 years and over
Males 40.3% Never married45.6% Now married1.9% Separated1.5% Widowed10.7% DivorcedFemales 27.4% Never married51.8% Now married0.1% Separated9.4% Widowed11.2% DivorcedWomen who gave birth in the past 12 months Now married:
100.0% (61)Unmarried:
0.0% (0)
Women who did not give birth in the past 12 months Now married:
55.9% (843)Unmarried:
44.1% (664)
Marital status - Hispanic or Latino population 15 years and over
Males 44.7% Never married37.8% Now married5.1% Separated2.2% Widowed10.1% DivorcedFemales 34.2% Never married44.6% Now married3.3% Separated12.9% Widowed5.0% DivorcedWomen who gave birth in the past 12 months Now married:
100.0% (15)Unmarried:
0.0% (0)
Women who did not give birth in the past 12 months Now married:
43.7% (312)Unmarried:
56.2% (402)
Ancestries in Somerville
591 9.4% Italian479 7.6% Haitian289 4.6% American217 3.4% Irish146 2.3% Polish131 2.1% Greek129 2.0% German86 1.4% Guyanese82 1.3% English82 1.3% Trinidadian and Tobagonian72 1.1% Jamaican48 0.8% Nigerian38 0.6% Russian34 0.5% Portuguese34 0.5% Turkish29 0.5% European26 0.4% Armenian25 0.4% Kenyan20 0.3% Belgian20 0.3% Dutch18 0.3% British17 0.3% Syrian16 0.3% Swedish15 0.2% Brazilian15 0.2% Czechoslovakian15 0.2% Hungarian15 0.2% Romanian12 0.2% Finnish11 0.2% French11 0.2% Northern European10 0.2% Swiss7 0.1% French Canadian5 0.08% Norwegian4 0.06% Scotch-Irish4 0.06% Slovak
Children Nativity (place of birth) in Somerville
Children under 6 years - Living with two parents Both parents native 517 100.0% NativeBoth parents foreign-born 218 80.2% Native54 19.8% Foreign-bornOne native, one foreign-born parent 41 100.0% NativeChildren under 6 years - Living with one parent Native parent 32 100.0% NativeForeign-born parent 90 100.0% NativeChildren 6 to 17 years - Living with two parents Both parents native 457 100.0% NativeBoth parents foreign-born 402 88.7% Native51 11.3% Foreign-bornOne native, one foreign-born parent 130 100.0% NativeChildren 6 to 17 years - Living with one parent Native parent 19 100.0% NativeForeign-born parent 303 51.1% Native290 48.9% Foreign-born