Races in St. Paul, Minnesota (MN) Detailed Stats
Data:
Races - White alone (%)
Races - White alone (% change since 2000)
Races - Black alone (%)
Races - Black alone (% change since 2000)
Races - American Indian alone (%)
Races - American Indian alone (% change since 2000)
Races - Asian alone (%)
Races - Asian alone (% change since 2000)
Races - Hispanic (%)
Races - Hispanic (% change since 2000)
Races - Native Hawaiian and Other Pacific Islander alone (%)
Races - Native Hawaiian and Other Pacific Islander alone (% change since 2000)
Races - Two or more races(%)
Races - Two or more races(% change since 2000)
Races - Other race alone (%)
Races - Other race alone (% change since 2000)
Racial diversity
Place of birth - Born in state of residence (%)
Place of birth - Born in state of residence (%) - White
Place of birth - Born in state of residence (%) - Black or African American
Place of birth - Born in state of residence (%) - Asian
Place of birth - Born in state of residence (%) - Hispanic or Latino
Place of birth - Born in state of residence (%) - American Indian and Alaska Native
Place of birth - Born in state of residence (%) - Multirace
Place of birth - Born in state of residence (%) - Other Race
Place of birth - Born in other state (%)
Place of birth - Born in other state (%) - White
Place of birth - Born in other state (%) - Black or African American
Place of birth - Born in other state (%) - Asian
Place of birth - Born in other state (%) - Hispanic or Latino
Place of birth - Born in other state (%) - American Indian and Alaska Native
Place of birth - Born in other state (%) - Multirace
Place of birth - Born in other state (%) - Other Race
Place of birth - Native, outside of US (%)
Place of birth - Native, outside of US (%) - White
Place of birth - Native, outside of US (%) - Black or African American
Place of birth - Native, outside of US (%) - Asian
Place of birth - Native, outside of US (%) - Hispanic or Latino
Place of birth - Native, outside of US (%) - American Indian and Alaska Native
Place of birth - Native, outside of US (%) - Multirace
Place of birth - Native, outside of US (%) - Other Race
Place of birth - Foreign born (%)
Place of birth - Foreign born (%) - White
Place of birth - Foreign born (%) - Black or African American
Place of birth - Foreign born (%) - Asian
Place of birth - Foreign born (%) - Hispanic or Latino
Place of birth - Foreign born (%) - American Indian and Alaska Native
Place of birth - Foreign born (%) - Multirace
Place of birth - Foreign born (%) - Other Race
Residents speaking English at home (%)
Residents speaking English at home - Born in the United States (%)
Residents speaking English at home - Native, born elsewhere (%)
Residents speaking English at home - Foreign born (%)
Residents speaking Spanish at home (%)
Residents speaking Spanish at home - Born in the United States (%)
Residents speaking Spanish at home - Native, born elsewhere (%)
Residents speaking Spanish at home - Foreign born (%)
Residents speaking other language at home (%)
Residents speaking other language at home - Born in the United States (%)
Residents speaking other language at home - Native, born elsewhere (%)
Residents speaking other language at home - Foreign born (%)
Marital status - Never married (%)
Marital status - Now married (%)
Marital status - Separated (%)
Marital status - Widowed (%)
Marital status - Divorced (%)
Ancestries Reported - Arab (%)
Ancestries Reported - Czech (%)
Ancestries Reported - Danish (%)
Ancestries Reported - Dutch (%)
Ancestries Reported - English (%)
Ancestries Reported - French (%)
Ancestries Reported - French Canadian (%)
Ancestries Reported - German (%)
Ancestries Reported - Greek (%)
Ancestries Reported - Hungarian (%)
Ancestries Reported - Irish (%)
Ancestries Reported - Italian (%)
Ancestries Reported - Lithuanian (%)
Ancestries Reported - Norwegian (%)
Ancestries Reported - Polish (%)
Ancestries Reported - Portuguese (%)
Ancestries Reported - Russian (%)
Ancestries Reported - Scotch-Irish (%)
Ancestries Reported - Scottish (%)
Ancestries Reported - Slovak (%)
Ancestries Reported - Subsaharan African (%)
Ancestries Reported - Swedish (%)
Ancestries Reported - Swiss (%)
Ancestries Reported - Ukrainian (%)
Ancestries Reported - United States (%)
Ancestries Reported - Welsh (%)
Ancestries Reported - West Indian (%)
Ancestries Reported - Other (%)
Geographical mobility - Same house 1 year ago (%)
Geographical mobility - Same house 1 year ago (%) - White
Geographical mobility - Same house 1 year ago (%) - Black or African American
Geographical mobility - Same house 1 year ago (%) - Asian
Geographical mobility - Same house 1 year ago (%) - Hispanic or Latino
Geographical mobility - Same house 1 year ago (%) - American Indian and Alaska Native
Geographical mobility - Same house 1 year ago (%) - Multirace
Geographical mobility - Same house 1 year ago (%) - Other Race
Geographical mobility - Moved within same county (%)
Geographical mobility - Moved within same county (%) - White
Geographical mobility - Moved within same county (%) - Black or African American
Geographical mobility - Moved within same county (%) - Asian
Geographical mobility - Moved within same county (%) - Hispanic or Latino
Geographical mobility - Moved within same county (%) - American Indian and Alaska Native
Geographical mobility - Moved within same county (%) - Multirace
Geographical mobility - Moved within same county (%) - Other Race
Geographical mobility - Moved from different county within same state (%)
Geographical mobility - Moved from different county within same state (%) - White
Geographical mobility - Moved from different county within same state (%) - Black or African American
Geographical mobility - Moved from different county within same state (%) - Asian
Geographical mobility - Moved from different county within same state (%) - Hispanic or Latino
Geographical mobility - Moved from different county within same state (%) - American Indian and Alaska Native
Geographical mobility - Moved from different county within same state (%) - Multirace
Geographical mobility - Moved from different county within same state (%) - Other Race
Geographical mobility - Moved from different state (%)
Geographical mobility - Moved from different state (%) - White
Geographical mobility - Moved from different state (%) - Black or African American
Geographical mobility - Moved from different state (%) - Asian
Geographical mobility - Moved from different state (%) - Hispanic or Latino
Geographical mobility - Moved from different state (%) - American Indian and Alaska Native
Geographical mobility - Moved from different state (%) - Multirace
Geographical mobility - Moved from different state (%) - Other Race
Geographical mobility - Moved from abroad (%)
Geographical mobility - Moved from abroad (%) - White
Geographical mobility - Moved from abroad (%) - Black or African American
Geographical mobility - Moved from abroad (%) - Asian
Geographical mobility - Moved from abroad (%) - Hispanic or Latino
Geographical mobility - Moved from abroad (%) - American Indian and Alaska Native
Geographical mobility - Moved from abroad (%) - Multirace
Geographical mobility - Moved from abroad (%) - Other Race
Place of birth for the foreign-born population - Ireland (%)
Place of birth for the foreign-born population - Denmark (%)
Place of birth for the foreign-born population - Norway (%)
Place of birth for the foreign-born population - Sweden (%)
Place of birth for the foreign-born population - United Kingdom (%)
Place of birth for the foreign-born population - England (%)
Place of birth for the foreign-born population - Scotland (%)
Place of birth for the foreign-born population - Other Northern Europe (%)
Place of birth for the foreign-born population - Austria (%)
Place of birth for the foreign-born population - Belgium (%)
Place of birth for the foreign-born population - France (%)
Place of birth for the foreign-born population - Germany (%)
Place of birth for the foreign-born population - Netherlands (%)
Place of birth for the foreign-born population - Switzerland (%)
Place of birth for the foreign-born population - Other Western Europe (%)
Place of birth for the foreign-born population - Greece (%)
Place of birth for the foreign-born population - Italy (%)
Place of birth for the foreign-born population - Portugal (%)
Place of birth for the foreign-born population - Spain (%)
Place of birth for the foreign-born population - Other Southern Europe (%)
Place of birth for the foreign-born population - Albania (%)
Place of birth for the foreign-born population - Belarus (%)
Place of birth for the foreign-born population - Bosnia and Herzegovina (%)
Place of birth for the foreign-born population - Bulgaria (%)
Place of birth for the foreign-born population - Croatia (%)
Place of birth for the foreign-born population - Czechoslovakia (%)
Place of birth for the foreign-born population - Hungary (%)
Place of birth for the foreign-born population - Latvia (%)
Place of birth for the foreign-born population - Lithuania (%)
Place of birth for the foreign-born population - North Macedonia (Macedonia) (%)
Place of birth for the foreign-born population - Moldova (%)
Place of birth for the foreign-born population - Poland (%)
Place of birth for the foreign-born population - Romania (%)
Place of birth for the foreign-born population - Russia (%)
Place of birth for the foreign-born population - Serbia (%)
Place of birth for the foreign-born population - Ukraine (%)
Place of birth for the foreign-born population - Other Eastern Europe (%)
Place of birth for the foreign-born population - China (%)
Place of birth for the foreign-born population - Hong Kong (%)
Place of birth for the foreign-born population - Taiwan (%)
Place of birth for the foreign-born population - Japan (%)
Place of birth for the foreign-born population - Korea (%)
Place of birth for the foreign-born population - Other Eastern Asia (%)
Place of birth for the foreign-born population - Afghanistan (%)
Place of birth for the foreign-born population - Bangladesh (%)
Place of birth for the foreign-born population - India (%)
Place of birth for the foreign-born population - Iran (%)
Place of birth for the foreign-born population - Kazakhstan (%)
Place of birth for the foreign-born population - Nepal (%)
Place of birth for the foreign-born population - Pakistan (%)
Place of birth for the foreign-born population - Sri Lanka (%)
Place of birth for the foreign-born population - Uzbekistan (%)
Place of birth for the foreign-born population - Other South Central Asia (%)
Place of birth for the foreign-born population - Burma (%)
Place of birth for the foreign-born population - Cambodia (%)
Place of birth for the foreign-born population - Indonesia (%)
Place of birth for the foreign-born population - Laos (%)
Place of birth for the foreign-born population - Malaysia (%)
Place of birth for the foreign-born population - Philippines (%)
Place of birth for the foreign-born population - Singapore (%)
Place of birth for the foreign-born population - Thailand (%)
Place of birth for the foreign-born population - Vietnam (%)
Place of birth for the foreign-born population - Other South Eastern Asia (%)
Place of birth for the foreign-born population - Armenia (%)
Place of birth for the foreign-born population - Iraq (%)
Place of birth for the foreign-born population - Israel (%)
Place of birth for the foreign-born population - Jordan (%)
Place of birth for the foreign-born population - Kuwait (%)
Place of birth for the foreign-born population - Lebanon (%)
Place of birth for the foreign-born population - Saudi Arabia (%)
Place of birth for the foreign-born population - Syria (%)
Place of birth for the foreign-born population - Turkey (%)
Place of birth for the foreign-born population - Yemen (%)
Place of birth for the foreign-born population - Other Western Asia (%)
Place of birth for the foreign-born population - Eritrea (%)
Place of birth for the foreign-born population - Ethiopia (%)
Place of birth for the foreign-born population - Kenya (%)
Place of birth for the foreign-born population - Somalia (%)
Place of birth for the foreign-born population - Uganda (%)
Place of birth for the foreign-born population - Zimbabwe (%)
Place of birth for the foreign-born population - Other Eastern Africa (%)
Place of birth for the foreign-born population - Cameroon (%)
Place of birth for the foreign-born population - Congo (%)
Place of birth for the foreign-born population - Democratic Republic of Congo (Zaire) (%)
Place of birth for the foreign-born population - Other Middle Africa (%)
Place of birth for the foreign-born population - Egypt (%)
Place of birth for the foreign-born population - Morocco (%)
Place of birth for the foreign-born population - Sudan (%)
Place of birth for the foreign-born population - Other Northern Africa (%)
Place of birth for the foreign-born population - South Africa (%)
Place of birth for the foreign-born population - Other Southern Africa (%)
Place of birth for the foreign-born population - Cabo Verde (%)
Place of birth for the foreign-born population - Ghana (%)
Place of birth for the foreign-born population - Liberia (%)
Place of birth for the foreign-born population - Nigeria (%)
Place of birth for the foreign-born population - Senegal (%)
Place of birth for the foreign-born population - Sierra Leone (%)
Place of birth for the foreign-born population - Other Western Africa (%)
Place of birth for the foreign-born population - Australia (%)
Place of birth for the foreign-born population - New Zealand (%)
Place of birth for the foreign-born population - Fiji (%)
Place of birth for the foreign-born population - Micronesia (%)
Place of birth for the foreign-born population - Bahamas (%)
Place of birth for the foreign-born population - Barbados (%)
Place of birth for the foreign-born population - Cuba (%)
Place of birth for the foreign-born population - Dominica (%)
Place of birth for the foreign-born population - Dominican Republic (%)
Place of birth for the foreign-born population - Grenada (%)
Place of birth for the foreign-born population - Haiti (%)
Place of birth for the foreign-born population - Jamaica (%)
Place of birth for the foreign-born population - St. Vincent and the Grenadines (%)
Place of birth for the foreign-born population - Trinidad and Tobago (%)
Place of birth for the foreign-born population - West Indies (%)
Place of birth for the foreign-born population - Other Caribbean (%)
Place of birth for the foreign-born population - Belize (%)
Place of birth for the foreign-born population - Costa Rica (%)
Place of birth for the foreign-born population - El Salvador (%)
Place of birth for the foreign-born population - Guatemala (%)
Place of birth for the foreign-born population - Honduras (%)
Place of birth for the foreign-born population - Mexico (%)
Place of birth for the foreign-born population - Nicaragua (%)
Place of birth for the foreign-born population - Panama (%)
Place of birth for the foreign-born population - Other Central America (%)
Place of birth for the foreign-born population - Argentina (%)
Place of birth for the foreign-born population - Bolivia (%)
Place of birth for the foreign-born population - Brazil (%)
Place of birth for the foreign-born population - Chile (%)
Place of birth for the foreign-born population - Colombia (%)
Place of birth for the foreign-born population - Ecuador (%)
Place of birth for the foreign-born population - Guyana (%)
Place of birth for the foreign-born population - Peru (%)
Place of birth for the foreign-born population - Uruguay (%)
Place of birth for the foreign-born population - Venezuela (%)
Place of birth for the foreign-born population - Other South America (%)
Place of birth for the foreign-born population - Canada (%)
Place of birth for the foreign-born population - Other Northern America (%)
Place of birth for the foreign-born population - Other (%)
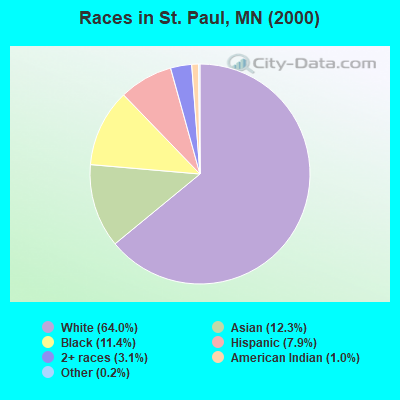
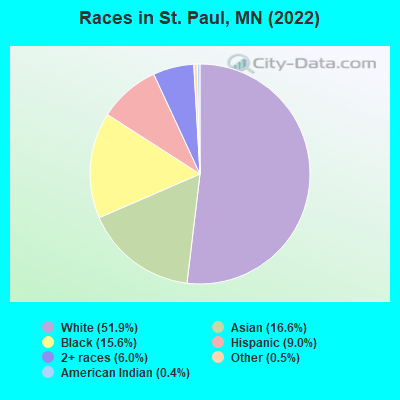
According to 2022 data, the most numerous races in St. Paul, MN are White alone (157,267 residents), Black alone (47,211 residents), and Hispanic (27,298 residents). 73.5% of St. Paul residents speak English at home. 19.9% of St. Paul, MN residents are foreign-born (9.8% born in Asia, 4.8% born in Africa, 3.0% born in Latin America), which is 59.8% greater than the foreign-born rate of 8.0% across the entire state of Minnesota.
Race distribution in St. Paul
2000 2022
183,898 64.0% White alone 35,311 12.3% Asian alone 32,818 11.4% Black alone 22,715 7.9% Hispanic 8,853 3.1% Two or more races 2,806 1.0% American Indian alone 572 0.2% Other race alone 178 0.06% Native Hawaiian and Other
157,267 51.9% White alone 50,382 16.6% Asian alone 47,211 15.6% Black alone 27,298 9.0% Hispanic 18,333 6.0% Two or more races 1,404 0.5% Other race alone 1,227 0.4% American Indian alone 38 0.01% Native Hawaiian and Other
2000 2022
4,337,143 88.2% White alone 168,813 3.4% Black alone 143,382 2.9% Hispanic 141,083 2.9% Asian alone 70,304 1.4% Two or more races 52,009 1.1% American Indian alone 5,031 0.1% Other race alone 1,714 0.03% Native Hawaiian and Other
4,356,347 76.2% White alone 395,179 6.9% Black alone 333,830 5.8% Hispanic 294,800 5.2% Asian alone 259,649 4.5% Two or more races 42,125 0.7% American Indian alone 32,976 0.6% Other race alone 2,278 0.04% Native Hawaiian and Other
Income and house value in St. Paul Median household income in 2022 $79,300 White non-Hispanic householders$36,928 Black householders$32,183 American Indian and Alaska Native householders$69,878 Asian householders$59,776 Some other race householders$47,478 Two or more races householders$51,788 Hispanic or Latino race householdersMedian 2022 house value $299,377 White Non-Hispanic householders$241,584 Black or African American householders$244,049 American Indian or Alaska Native householders $250,075 Asian householders$232,819 Native Hawaiian and other Pacific Islander householders$246,514 Some other race householders$228,984 Two or more races householders$242,679 Hispanic or Latino householders
Median age by race in St. Paul
41.4 Median age for White residents40.0 43.3 29.0 Median age for Black or African American residents28.2 31.1 43.1 Median age for American Indian / Alaska Native residents45.2 37.4 26.9 Median age for Asian residents25.6 28.2 -666,666,666.0 Median age for Native Hawaiian / Pacific Islander residents-666,666,666.0 -666,666,666.0 24.2 Median age for Other race residents24.6 23.9 23.2 Median age for Two or more races residents22.1 26.4 41.7 Median age for White alone residents40.0 43.4 28.1 Median age for Hispanic or Latino residents27.7 29.1
Owner/renter occupied households by race in St. Paul
House owners and renters - White residents 50,517 62.5% Owner occupied30,346 37.5% Renter occupiedHouse owners and renters - Black or African American residents 3,420 18.1% Owner occupied15,516 81.9% Renter occupiedHouse owners and renters - American Indian / Alaska Native residents 350 35.4% Owner occupied640 64.6% Renter occupiedHouse owners and renters - Asian residents 7,939 61.0% Owner occupied5,082 39.0% Renter occupiedHouse owners and renters - Native Hawaiian / Pacific Islander residents 20 28.7% Owner occupied50 71.3% Renter occupiedHouse owners and renters - Other race residents 1,652 40.7% Owner occupied2,407 59.3% Renter occupiedHouse owners and renters - Two or more races residents 4,182 47.8% Owner occupied4,565 52.2% Renter occupiedHouse owners and renters - White alone residents 49,543 62.6% Owner occupied29,640 37.4% Renter occupiedHouse owners and renters - Hispanic or Latino residents 3,656 38.5% Owner occupied5,846 61.5% Renter occupied
Language usage in St. Paul
English speakers - Total 73.5% of residents of St. Paul speak English at home.
6.9% of residents speak Spanish at home 11,791 60.3% Speak English very well7,770 39.7% Speak English less than very well19.7% of residents speak other language at home 27,431 49.0% Speak English very well28,541 51.0% Speak English less than very well
English speakers - Born in the United States 89.9% of residents of St. Paul speak English at home.
4.2% of residents speak Spanish at home 2,983 91.2% Speak English very well289 8.8% Speak English less than very well5.8% of residents speak other language at home 3,837 84.9% Speak English very well680 15.1% Speak English less than very well
English speakers - Native, born elsewhere 56.6% of residents of St. Paul speak English at home.
12.3% of residents speak Spanish at home 355 85.7% Speak English very well59 14.3% Speak English less than very well31.1% of residents speak other language at home 984 94.4% Speak English very well58 5.6% Speak English less than very well
English speakers - Foreign-born 13.9% of residents of St. Paul speak English at home.
17.0% of residents speak Spanish at home 2,529 27.6% Speak English very well6,634 72.4% Speak English less than very well69.1% of residents speak other language at home 13,813 37.0% Speak English very well23,486 63.0% Speak English less than very well
White (Caucasian) - Speak only English Native:
97.2% (146,615)Foreign-born:
42.9% (1,638)
White (Caucasian) - Speak another language Native:
2.8% (4,247)Foreign-born:
57.1% (2,177)
Black or African American - Speak only English Native:
88.6% (26,799)Foreign-born:
11.8% (1,584)
Black or African American - Speak another language Native:
11.4% (3,464)Foreign-born:
88.2% (11,817)
American Indian / Alaska Native - Speak only English Native:
76.6% (1,480)Foreign-born:
4.1% (16)
American Indian / Alaska Native - Speak another language Native:
20.5% (396)Foreign-born:
63.3% (244)
Asian - Speak only English Native:
30.0% (5,812)Foreign-born:
11.5% (3,031)
Asian - Speak another language Native:
70.0% (13,561)Foreign-born:
88.5% (23,343)
Other race - Speak only English Native:
41.7% (3,196)Foreign-born:
12.0% (874)
Other race - Speak another language Native:
58.3% (4,474)Foreign-born:
88.0% (6,381)
Two or more races - Speak only English Native:
85.3% (17,751)Foreign-born:
13.0% (364)
Two or more races - Speak another language Native:
14.7% (3,051)Foreign-born:
87.0% (2,436)
White alone - Speak only English Native:
97.8% (145,209)Foreign-born:
48.9% (1,638)
White alone - Speak another language Native:
2.2% (3,244)Foreign-born:
51.1% (1,711)
Hispanic or Latino - Speak only English Native:
46.8% (7,010)Foreign-born:
10.4% (1,045)
Hispanic or Latino - Speak another language Native:
53.2% (7,970)Foreign-born:
89.6% (9,048)
Foreign-born residents in St. Paul 60,185 residents are foreign born (9.8% Asia , 4.8% Africa , 3.0% Latin America ).
This city:
19.9%Minnesota:
8.5%
Marital status for residents in St. Paul Marital status - White (Caucasian) population 15 years and over
Males 42.4% Never married43.2% Now married1.4% Separated2.0% Widowed11.1% DivorcedFemales 40.0% Never married40.5% Now married0.7% Separated5.9% Widowed12.9% DivorcedWomen who gave birth in the past 12 months Now married:
83.8% (976)Unmarried:
16.2% (189)
Women who did not give birth in the past 12 months Now married:
32.4% (12,836)Unmarried:
67.6% (26,779)
Marital status - Black or African American population 15 years and over
Males 60.2% Never married24.9% Now married3.1% Separated0.7% Widowed11.1% DivorcedFemales 53.2% Never married24.3% Now married1.3% Separated4.2% Widowed17.2% DivorcedWomen who gave birth in the past 12 months Now married:
14.5% (86)Unmarried:
85.5% (507)
Women who did not give birth in the past 12 months Now married:
25.3% (2,841)Unmarried:
74.7% (8,387)
Marital status - American Indian / Alaska Native population 15 years and over
Males 59.5% Never married25.4% Now married2.7% Separated2.6% Widowed9.9% DivorcedFemales 47.3% Never married26.7% Now married0.0% Separated4.6% Widowed21.4% DivorcedWomen who gave birth in the past 12 months Now married:
56.5% (36)Unmarried:
43.5% (28)
Women who did not give birth in the past 12 months Now married:
23.2% (124)Unmarried:
76.8% (409)
Marital status - Asian population 15 years and over
Males 54.9% Never married39.9% Now married1.6% Separated0.7% Widowed3.1% DivorcedFemales 44.5% Never married41.4% Now married2.9% Separated4.8% Widowed6.4% DivorcedWomen who gave birth in the past 12 months Now married:
68.8% (877)Unmarried:
31.2% (397)
Women who did not give birth in the past 12 months Now married:
37.0% (4,580)Unmarried:
63.0% (7,786)
Marital status - Native Hawaiian / Pacific Islander population 15 years and over
Males 38.9% Never married0.0% Now married0.0% Separated31.5% Widowed29.6% DivorcedFemales 36.8% Never married63.2% Now married0.0% Separated0.0% Widowed0.0% DivorcedWomen who did not give birth in the past 12 months Now married:
100.0% (17)Unmarried:
0.0% (0)
Marital status - Other race population 15 years and over
Males 44.3% Never married48.8% Now married3.7% Separated0.0% Widowed3.2% DivorcedFemales 53.6% Never married35.1% Now married1.4% Separated6.3% Widowed3.7% DivorcedWomen who gave birth in the past 12 months Now married:
37.8% (94)Unmarried:
62.2% (155)
Women who did not give birth in the past 12 months Now married:
26.8% (1,373)Unmarried:
73.2% (3,743)
Marital status - Two or more races population 15 years and over
Males 63.0% Never married27.8% Now married0.6% Separated1.2% Widowed7.4% DivorcedFemales 58.4% Never married25.9% Now married6.6% Separated1.3% Widowed7.8% DivorcedWomen who gave birth in the past 12 months Now married:
53.8% (523)Unmarried:
46.2% (450)
Women who did not give birth in the past 12 months Now married:
22.6% (1,368)Unmarried:
77.4% (4,679)
Marital status - White alone, not Hispanic / Latino population 15 years and over
Males 41.6% Never married43.6% Now married1.5% Separated2.0% Widowed11.3% DivorcedFemales 39.8% Never married40.5% Now married0.7% Separated6.0% Widowed13.0% DivorcedWomen who gave birth in the past 12 months Now married:
83.8% (976)Unmarried:
16.2% (189)
Women who did not give birth in the past 12 months Now married:
32.5% (12,631)Unmarried:
67.5% (26,285)
Marital status - Hispanic or Latino population 15 years and over
Males 54.6% Never married39.7% Now married1.5% Separated0.0% Widowed4.2% DivorcedFemales 51.4% Never married34.9% Now married6.0% Separated4.2% Widowed3.6% DivorcedWomen who gave birth in the past 12 months Now married:
66.3% (305)Unmarried:
33.7% (155)
Women who did not give birth in the past 12 months Now married:
30.4% (2,164)Unmarried:
69.6% (4,952)
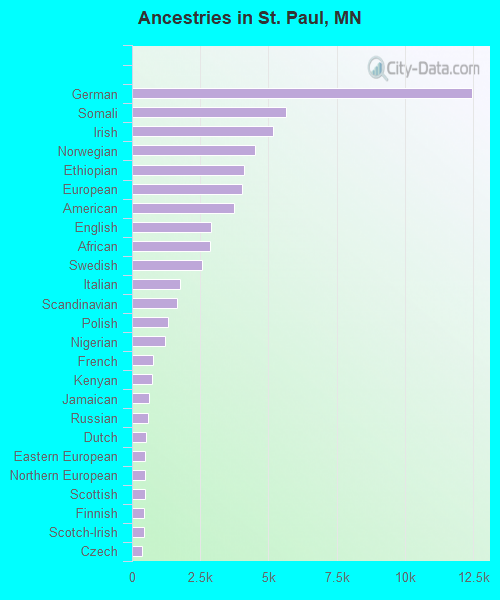
Ancestries in St. Paul
12,458 8.5% German5,655 3.9% Somali5,156 3.5% Irish4,506 3.1% Norwegian4,116 2.8% Ethiopian4,019 2.7% European3,720 2.5% American2,888 2.0% English2,845 1.9% African2,548 1.7% Swedish1,751 1.2% Italian1,643 1.1% Scandinavian1,331 0.9% Polish1,197 0.8% Nigerian781 0.5% French732 0.5% Kenyan614 0.4% Jamaican568 0.4% Russian499 0.3% Dutch480 0.3% Eastern European469 0.3% Northern European467 0.3% Scottish457 0.3% Finnish423 0.3% Scotch-Irish366 0.2% Czech355 0.2% Danish353 0.2% British309 0.2% Liberian251 0.2% Hungarian249 0.2% French Canadian239 0.2% Ukrainian217 0.1% Austrian185 0.1% Iranian147 0.1% Slovak144 0.10% Lebanese131 0.09% Afghan117 0.08% Egyptian114 0.08% Swiss109 0.07% Greek100 0.07% Luxembourger93 0.06% Romanian89 0.06% Canadian69 0.05% Lithuanian68 0.05% Turkish53 0.04% Slovene53 0.04% Czechoslovakian50 0.03% Haitian48 0.03% Welsh48 0.03% West Indian45 0.03% Croatian45 0.03% Brazilian43 0.03% Guyanese41 0.03% Moroccan39 0.03% Armenian39 0.03% Albanian38 0.03% Bulgarian38 0.03% Latvian38 0.03% Israeli34 0.02% Ghanaian31 0.02% Trinidadian and Tobagonian30 0.02% Palestinian30 0.02% Zimbabwean29 0.02% Sudanese27 0.02% Belgian22 0.02% Arab21 0.01% Basque19 0.01% German Russian19 0.01% Yugoslavian18 0.01% Estonian16 0.01% Maltese15 0.01% Serbian15 0.01% Barbadian12 0.01% Iraqi12 0.01% Pennsylvania German10 0.01% Syrian10 0.01% Macedonian9 0.01% Jordanian8 0.01% Slavic
Geographical mobility in St. Paul Same house 1 year ago 130,015 81.7% White (Caucasian)38,208 80.3% Black or African American1,557 71.5% American Indian / Alaska Native42,603 86.2% Asian76 98.3% Native Hawaiian / Pacific Islander13,189 81.9% Other race20,269 80.2% Two or more races127,464 81.6% White alone, not Hispanic / Latino21,388 80.2% Hispanic or LatinoMoved within same county 13,148 8.3% White / Caucasian3,285 6.9% Black or African American174 8.0% American Indian / Alaska Native3,563 7.2% Asian1,286 8.0% Other race1,950 7.7% Two or more races13,077 8.4% White alone, not Hispanic / Latino2,856 10.7% Hispanic or LatinoMoved within same state 10,319 6.5% White / Caucasian2,142 4.5% Black or African American294 13.5% American Indian / Alaska Native1,784 3.6% Asian683 4.2% Other race1,466 5.8% Two or more races10,203 6.5% White alone, not Hispanic / Latino949 3.6% Hispanic or LatinoMoved from different state 5,194 3.3% White / Caucasian2,170 4.6% Black or African American126 5.8% American Indian / Alaska Native418 0.8% Asian2 2.7% Native Hawaiian / Pacific Islander250 1.6% Other race1,398 5.5% Two or more races4,948 3.2% White alone, not Hispanic / Latino755 2.8% Hispanic or LatinoMoved from abroad 525 0.3% White1,783 3.7% Black or African American1,064 2.2% Asian704 4.4% Other race192 0.8% Two or more races525 0.3% White alone, not Hispanic / Latino704 2.6% Hispanic or Latino
Children Nativity (place of birth) in St. Paul
Children under 6 years - Living with two parents Both parents native 6,026 100.0% NativeBoth parents foreign-born 3,806 91.5% Native353 8.5% Foreign-bornOne native, one foreign-born parent 1,721 95.1% Native88 4.9% Foreign-bornChildren under 6 years - Living with one parent Native parent 5,920 100.0% NativeForeign-born parent 2,474 87.4% Native356 12.6% Foreign-bornChildren 6 to 17 years - Living with two parents Both parents native 10,048 100.0% NativeBoth parents foreign-born 6,630 67.7% Native3,165 32.3% Foreign-bornOne native, one foreign-born parent 2,186 100.0% NativeChildren 6 to 17 years - Living with one parent Native parent 11,486 100.0% NativeForeign-born parent 7,208 57.3% Native5,370 42.7% Foreign-born
Place of birth for residents in St. Paul 31,420 Asia25,735 South Eastern Asia15,428 Africa11,899 Eastern Africa10,624 Americas9,697 Latin America7,969 Central America2,998 Eastern Asia2,483 Europe2,363 South Central Asia2,115 Western Africa1,848 China1,280 South America993 Eastern Europe926 Northern America714 Middle Africa668 Western Europe622 Northern Europe448 Caribbean313 Western Asia311 Northern Africa228 Oceania218 Australia and New Zealand Subregion176 Southern Europe66 Southern Africa8,485 Thailand8,414 Laos5,936 Burma (Myanmar)5,319 Mexico4,815 Ethiopia3,819 Somalia1,917 El Salvador1,748 China1,723 Vietnam1,465 Kenya1,155 Eritrea971 Korea928 India912 Canada828 Nigeria671 Philippines563 Nepal508 Liberia456 Bhutan412 Cameroon398 Cambodia394 Germany374 Colombia372 Ghana319 Ukraine253 England245 Russia210 Australia210 Guatemala209 United Kingdom197 Honduras191 Peru187 Nicaragua178 Japan176 Democratic Republic of Congo (Zaire)166 Guyana161 Jamaica149 Ecuador148 Venezuela145 Uganda144 France139 Afghanistan138 Togo129 Sudan129 Dominican Republic125 Spain124 Congo116 Iran99 Poland90 Ivory Coast86 Egypt85 Costa Rica84 Argentina82 Sweden78 Morocco76 Ireland74 Malaysia73 Sierra Leone72 Lebanon67 Pakistan66 Taiwan62 Uruguay58 Hungary56 Israel51 South Africa51 Czechoslovakia50 Belize47 Romania47 Brazil45 Austria45 Turkey45 Haiti40 Zimbabwe39 Bulgaria38 Bangladesh38 Moldova37 Netherlands37 Yemen36 Georgia34 Sri Lanka34 Hong Kong32 Barbados32 Cuba30 Belarus28 Bahamas26 Albania23 Belgium23 Indonesia22 Switzerland20 Jordan20 Saudi Arabia19 Iraq18 Trinidad and Tobago18 Kazakhstan17 Chile16 Algeria15 Portugal14 Bolivia11 North Macedonia (Macedonia)10 Fiji9 Greece8 Croatia8 Italy8 New Zealand7 Singapore6 Senegal4 Armenia
Grandparents responsible for own grandchildren in St. Paul
Grandparents (30 to 59 years) White / Caucasian 50 13.2% Responsible for grandchildren328 86.8% Not responsible for grandchildrenBlack or African American 101 46.2% Responsible for grandchildren118 53.8% Not responsible for grandchildrenAmerican Indian / Alaska Native 22 100.0% Responsible for grandchildrenAsian 240 39.4% Responsible for grandchildren369 60.6% Not responsible for grandchildrenOther race 60 23.2% Responsible for grandchildren197 76.8% Not responsible for grandchildrenTwo or more races 106 72.8% Responsible for grandchildren40 27.2% Not responsible for grandchildrenWhite alone, not Hispanic / Latino 48 23.0% Responsible for grandchildren160 77.0% Not responsible for grandchildrenHispanic or Latino 69 20.5% Responsible for grandchildren269 79.5% Not responsible for grandchildrenGrandparents (60 years and over) White / Caucasian 217 22.6% Responsible for grandchildren742 77.4% Not responsible for grandchildrenBlack or African American 47 29.5% Responsible for grandchildren113 70.5% Not responsible for grandchildrenAmerican Indian / Alaska Native 16 100.0% Not responsible for grandchildrenAsian 184 19.3% Responsible for grandchildren771 80.7% Not responsible for grandchildrenOther race 77 100.0% Not responsible for grandchildrenTwo or more races 24 17.7% Responsible for grandchildren110 82.3% Not responsible for grandchildrenWhite alone, not Hispanic / Latino 250 25.9% Responsible for grandchildren713 74.1% Not responsible for grandchildrenHispanic or Latino 4 2.5% Responsible for grandchildren172 97.5% Not responsible for grandchildren