Races in Sudley, Virginia (VA) Detailed Stats
Data:
Races - White alone (%)
Races - White alone (% change since 2000)
Races - Black alone (%)
Races - Black alone (% change since 2000)
Races - American Indian alone (%)
Races - American Indian alone (% change since 2000)
Races - Asian alone (%)
Races - Asian alone (% change since 2000)
Races - Hispanic (%)
Races - Hispanic (% change since 2000)
Races - Native Hawaiian and Other Pacific Islander alone (%)
Races - Native Hawaiian and Other Pacific Islander alone (% change since 2000)
Races - Two or more races(%)
Races - Two or more races(% change since 2000)
Races - Other race alone (%)
Races - Other race alone (% change since 2000)
Racial diversity
Place of birth - Born in state of residence (%)
Place of birth - Born in state of residence (%) - White
Place of birth - Born in state of residence (%) - Black or African American
Place of birth - Born in state of residence (%) - Asian
Place of birth - Born in state of residence (%) - Hispanic or Latino
Place of birth - Born in state of residence (%) - American Indian and Alaska Native
Place of birth - Born in state of residence (%) - Multirace
Place of birth - Born in state of residence (%) - Other Race
Place of birth - Born in other state (%)
Place of birth - Born in other state (%) - White
Place of birth - Born in other state (%) - Black or African American
Place of birth - Born in other state (%) - Asian
Place of birth - Born in other state (%) - Hispanic or Latino
Place of birth - Born in other state (%) - American Indian and Alaska Native
Place of birth - Born in other state (%) - Multirace
Place of birth - Born in other state (%) - Other Race
Place of birth - Native, outside of US (%)
Place of birth - Native, outside of US (%) - White
Place of birth - Native, outside of US (%) - Black or African American
Place of birth - Native, outside of US (%) - Asian
Place of birth - Native, outside of US (%) - Hispanic or Latino
Place of birth - Native, outside of US (%) - American Indian and Alaska Native
Place of birth - Native, outside of US (%) - Multirace
Place of birth - Native, outside of US (%) - Other Race
Place of birth - Foreign born (%)
Place of birth - Foreign born (%) - White
Place of birth - Foreign born (%) - Black or African American
Place of birth - Foreign born (%) - Asian
Place of birth - Foreign born (%) - Hispanic or Latino
Place of birth - Foreign born (%) - American Indian and Alaska Native
Place of birth - Foreign born (%) - Multirace
Place of birth - Foreign born (%) - Other Race
Residents speaking English at home (%)
Residents speaking English at home - Born in the United States (%)
Residents speaking English at home - Native, born elsewhere (%)
Residents speaking English at home - Foreign born (%)
Residents speaking Spanish at home (%)
Residents speaking Spanish at home - Born in the United States (%)
Residents speaking Spanish at home - Native, born elsewhere (%)
Residents speaking Spanish at home - Foreign born (%)
Residents speaking other language at home (%)
Residents speaking other language at home - Born in the United States (%)
Residents speaking other language at home - Native, born elsewhere (%)
Residents speaking other language at home - Foreign born (%)
Marital status - Never married (%)
Marital status - Now married (%)
Marital status - Separated (%)
Marital status - Widowed (%)
Marital status - Divorced (%)
Ancestries Reported - Arab (%)
Ancestries Reported - Czech (%)
Ancestries Reported - Danish (%)
Ancestries Reported - Dutch (%)
Ancestries Reported - English (%)
Ancestries Reported - French (%)
Ancestries Reported - French Canadian (%)
Ancestries Reported - German (%)
Ancestries Reported - Greek (%)
Ancestries Reported - Hungarian (%)
Ancestries Reported - Irish (%)
Ancestries Reported - Italian (%)
Ancestries Reported - Lithuanian (%)
Ancestries Reported - Norwegian (%)
Ancestries Reported - Polish (%)
Ancestries Reported - Portuguese (%)
Ancestries Reported - Russian (%)
Ancestries Reported - Scotch-Irish (%)
Ancestries Reported - Scottish (%)
Ancestries Reported - Slovak (%)
Ancestries Reported - Subsaharan African (%)
Ancestries Reported - Swedish (%)
Ancestries Reported - Swiss (%)
Ancestries Reported - Ukrainian (%)
Ancestries Reported - United States (%)
Ancestries Reported - Welsh (%)
Ancestries Reported - West Indian (%)
Ancestries Reported - Other (%)
Geographical mobility - Same house 1 year ago (%)
Geographical mobility - Same house 1 year ago (%) - White
Geographical mobility - Same house 1 year ago (%) - Black or African American
Geographical mobility - Same house 1 year ago (%) - Asian
Geographical mobility - Same house 1 year ago (%) - Hispanic or Latino
Geographical mobility - Same house 1 year ago (%) - American Indian and Alaska Native
Geographical mobility - Same house 1 year ago (%) - Multirace
Geographical mobility - Same house 1 year ago (%) - Other Race
Geographical mobility - Moved within same county (%)
Geographical mobility - Moved within same county (%) - White
Geographical mobility - Moved within same county (%) - Black or African American
Geographical mobility - Moved within same county (%) - Asian
Geographical mobility - Moved within same county (%) - Hispanic or Latino
Geographical mobility - Moved within same county (%) - American Indian and Alaska Native
Geographical mobility - Moved within same county (%) - Multirace
Geographical mobility - Moved within same county (%) - Other Race
Geographical mobility - Moved from different county within same state (%)
Geographical mobility - Moved from different county within same state (%) - White
Geographical mobility - Moved from different county within same state (%) - Black or African American
Geographical mobility - Moved from different county within same state (%) - Asian
Geographical mobility - Moved from different county within same state (%) - Hispanic or Latino
Geographical mobility - Moved from different county within same state (%) - American Indian and Alaska Native
Geographical mobility - Moved from different county within same state (%) - Multirace
Geographical mobility - Moved from different county within same state (%) - Other Race
Geographical mobility - Moved from different state (%)
Geographical mobility - Moved from different state (%) - White
Geographical mobility - Moved from different state (%) - Black or African American
Geographical mobility - Moved from different state (%) - Asian
Geographical mobility - Moved from different state (%) - Hispanic or Latino
Geographical mobility - Moved from different state (%) - American Indian and Alaska Native
Geographical mobility - Moved from different state (%) - Multirace
Geographical mobility - Moved from different state (%) - Other Race
Geographical mobility - Moved from abroad (%)
Geographical mobility - Moved from abroad (%) - White
Geographical mobility - Moved from abroad (%) - Black or African American
Geographical mobility - Moved from abroad (%) - Asian
Geographical mobility - Moved from abroad (%) - Hispanic or Latino
Geographical mobility - Moved from abroad (%) - American Indian and Alaska Native
Geographical mobility - Moved from abroad (%) - Multirace
Geographical mobility - Moved from abroad (%) - Other Race
Place of birth for the foreign-born population - Ireland (%)
Place of birth for the foreign-born population - Denmark (%)
Place of birth for the foreign-born population - Norway (%)
Place of birth for the foreign-born population - Sweden (%)
Place of birth for the foreign-born population - United Kingdom (%)
Place of birth for the foreign-born population - England (%)
Place of birth for the foreign-born population - Scotland (%)
Place of birth for the foreign-born population - Other Northern Europe (%)
Place of birth for the foreign-born population - Austria (%)
Place of birth for the foreign-born population - Belgium (%)
Place of birth for the foreign-born population - France (%)
Place of birth for the foreign-born population - Germany (%)
Place of birth for the foreign-born population - Netherlands (%)
Place of birth for the foreign-born population - Switzerland (%)
Place of birth for the foreign-born population - Other Western Europe (%)
Place of birth for the foreign-born population - Greece (%)
Place of birth for the foreign-born population - Italy (%)
Place of birth for the foreign-born population - Portugal (%)
Place of birth for the foreign-born population - Spain (%)
Place of birth for the foreign-born population - Other Southern Europe (%)
Place of birth for the foreign-born population - Albania (%)
Place of birth for the foreign-born population - Belarus (%)
Place of birth for the foreign-born population - Bosnia and Herzegovina (%)
Place of birth for the foreign-born population - Bulgaria (%)
Place of birth for the foreign-born population - Croatia (%)
Place of birth for the foreign-born population - Czechoslovakia (%)
Place of birth for the foreign-born population - Hungary (%)
Place of birth for the foreign-born population - Latvia (%)
Place of birth for the foreign-born population - Lithuania (%)
Place of birth for the foreign-born population - North Macedonia (Macedonia) (%)
Place of birth for the foreign-born population - Moldova (%)
Place of birth for the foreign-born population - Poland (%)
Place of birth for the foreign-born population - Romania (%)
Place of birth for the foreign-born population - Russia (%)
Place of birth for the foreign-born population - Serbia (%)
Place of birth for the foreign-born population - Ukraine (%)
Place of birth for the foreign-born population - Other Eastern Europe (%)
Place of birth for the foreign-born population - China (%)
Place of birth for the foreign-born population - Hong Kong (%)
Place of birth for the foreign-born population - Taiwan (%)
Place of birth for the foreign-born population - Japan (%)
Place of birth for the foreign-born population - Korea (%)
Place of birth for the foreign-born population - Other Eastern Asia (%)
Place of birth for the foreign-born population - Afghanistan (%)
Place of birth for the foreign-born population - Bangladesh (%)
Place of birth for the foreign-born population - India (%)
Place of birth for the foreign-born population - Iran (%)
Place of birth for the foreign-born population - Kazakhstan (%)
Place of birth for the foreign-born population - Nepal (%)
Place of birth for the foreign-born population - Pakistan (%)
Place of birth for the foreign-born population - Sri Lanka (%)
Place of birth for the foreign-born population - Uzbekistan (%)
Place of birth for the foreign-born population - Other South Central Asia (%)
Place of birth for the foreign-born population - Burma (%)
Place of birth for the foreign-born population - Cambodia (%)
Place of birth for the foreign-born population - Indonesia (%)
Place of birth for the foreign-born population - Laos (%)
Place of birth for the foreign-born population - Malaysia (%)
Place of birth for the foreign-born population - Philippines (%)
Place of birth for the foreign-born population - Singapore (%)
Place of birth for the foreign-born population - Thailand (%)
Place of birth for the foreign-born population - Vietnam (%)
Place of birth for the foreign-born population - Other South Eastern Asia (%)
Place of birth for the foreign-born population - Armenia (%)
Place of birth for the foreign-born population - Iraq (%)
Place of birth for the foreign-born population - Israel (%)
Place of birth for the foreign-born population - Jordan (%)
Place of birth for the foreign-born population - Kuwait (%)
Place of birth for the foreign-born population - Lebanon (%)
Place of birth for the foreign-born population - Saudi Arabia (%)
Place of birth for the foreign-born population - Syria (%)
Place of birth for the foreign-born population - Turkey (%)
Place of birth for the foreign-born population - Yemen (%)
Place of birth for the foreign-born population - Other Western Asia (%)
Place of birth for the foreign-born population - Eritrea (%)
Place of birth for the foreign-born population - Ethiopia (%)
Place of birth for the foreign-born population - Kenya (%)
Place of birth for the foreign-born population - Somalia (%)
Place of birth for the foreign-born population - Uganda (%)
Place of birth for the foreign-born population - Zimbabwe (%)
Place of birth for the foreign-born population - Other Eastern Africa (%)
Place of birth for the foreign-born population - Cameroon (%)
Place of birth for the foreign-born population - Congo (%)
Place of birth for the foreign-born population - Democratic Republic of Congo (Zaire) (%)
Place of birth for the foreign-born population - Other Middle Africa (%)
Place of birth for the foreign-born population - Egypt (%)
Place of birth for the foreign-born population - Morocco (%)
Place of birth for the foreign-born population - Sudan (%)
Place of birth for the foreign-born population - Other Northern Africa (%)
Place of birth for the foreign-born population - South Africa (%)
Place of birth for the foreign-born population - Other Southern Africa (%)
Place of birth for the foreign-born population - Cabo Verde (%)
Place of birth for the foreign-born population - Ghana (%)
Place of birth for the foreign-born population - Liberia (%)
Place of birth for the foreign-born population - Nigeria (%)
Place of birth for the foreign-born population - Senegal (%)
Place of birth for the foreign-born population - Sierra Leone (%)
Place of birth for the foreign-born population - Other Western Africa (%)
Place of birth for the foreign-born population - Australia (%)
Place of birth for the foreign-born population - New Zealand (%)
Place of birth for the foreign-born population - Fiji (%)
Place of birth for the foreign-born population - Micronesia (%)
Place of birth for the foreign-born population - Bahamas (%)
Place of birth for the foreign-born population - Barbados (%)
Place of birth for the foreign-born population - Cuba (%)
Place of birth for the foreign-born population - Dominica (%)
Place of birth for the foreign-born population - Dominican Republic (%)
Place of birth for the foreign-born population - Grenada (%)
Place of birth for the foreign-born population - Haiti (%)
Place of birth for the foreign-born population - Jamaica (%)
Place of birth for the foreign-born population - St. Vincent and the Grenadines (%)
Place of birth for the foreign-born population - Trinidad and Tobago (%)
Place of birth for the foreign-born population - West Indies (%)
Place of birth for the foreign-born population - Other Caribbean (%)
Place of birth for the foreign-born population - Belize (%)
Place of birth for the foreign-born population - Costa Rica (%)
Place of birth for the foreign-born population - El Salvador (%)
Place of birth for the foreign-born population - Guatemala (%)
Place of birth for the foreign-born population - Honduras (%)
Place of birth for the foreign-born population - Mexico (%)
Place of birth for the foreign-born population - Nicaragua (%)
Place of birth for the foreign-born population - Panama (%)
Place of birth for the foreign-born population - Other Central America (%)
Place of birth for the foreign-born population - Argentina (%)
Place of birth for the foreign-born population - Bolivia (%)
Place of birth for the foreign-born population - Brazil (%)
Place of birth for the foreign-born population - Chile (%)
Place of birth for the foreign-born population - Colombia (%)
Place of birth for the foreign-born population - Ecuador (%)
Place of birth for the foreign-born population - Guyana (%)
Place of birth for the foreign-born population - Peru (%)
Place of birth for the foreign-born population - Uruguay (%)
Place of birth for the foreign-born population - Venezuela (%)
Place of birth for the foreign-born population - Other South America (%)
Place of birth for the foreign-born population - Canada (%)
Place of birth for the foreign-born population - Other Northern America (%)
Place of birth for the foreign-born population - Other (%)
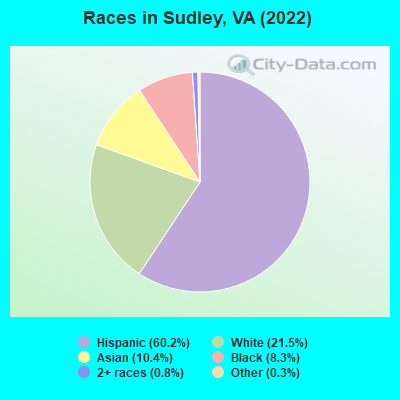
According to 2022 data, the most numerous races in Sudley, VA are White alone (4,205 residents), Black alone (1,618 residents), and Hispanic (11,761 residents). 34.5% of Sudley residents speak English at home. 48.7% of Sudley, VA residents are foreign-born (32.9% born in Latin America, 11.2% born in Asia), which is 75.4% greater than the foreign-born rate of 12.0% across the entire state of Virginia.
Race distribution in Sudley
2000 2022
4,965,637 70.2% White alone 1,376,378 19.4% Black alone 329,540 4.7% Hispanic 259,277 3.7% Asian alone 114,022 1.6% Two or more races 18,596 0.3% American Indian alone 11,685 0.2% Other race alone 3,380 0.05% Native Hawaiian and Other
5,095,130 58.7% White alone 1,594,785 18.4% Black alone 905,750 10.4% Hispanic 602,881 6.9% Asian alone 406,047 4.7% Two or more races 60,419 0.7% Other race alone 11,738 0.1% American Indian alone 6,869 0.08% Native Hawaiian and Other
Income and house value in Sudley Median household income in 2022 $79,985 White non-Hispanic householders$45,985 Black householders$123,508 Asian householders$85,533 Some other race householders$80,210 Two or more races householders$96,126 Hispanic or Latino race householdersMedian 2022 house value $435,245 White Non-Hispanic householders$374,614 Black or African American householders$407,404 American Indian or Alaska Native householders $415,756 Asian householders$369,974 Some other race householders$472,366 Two or more races householders$376,470 Hispanic or Latino householders
Median age by race in Sudley
34.7 Median age for White residents33.9 35.3 36.9 Median age for Black or African American residents35.7 37.6 -633,911,367.4 Median age for American Indian / Alaska Native residents-649,621,211.5 -670,886,075.3 36.3 Median age for Asian residents37.1 33.5 -611,955,419.9 Median age for Native Hawaiian / Pacific Islander residents-541,531,822.5 -714,150,046.8 30.9 Median age for Other race residents38.4 15.7 25.5 Median age for Two or more races residents24.8 26.1 40.4 Median age for White alone residents38.5 46.3 27.9 Median age for Hispanic or Latino residents30.2 26.7
Owner/renter occupied households by race in Sudley
House owners and renters - White residents 1,719 59.2% Owner occupied1,185 40.8% Renter occupiedHouse owners and renters - Black or African American residents 389 52.9% Owner occupied347 47.1% Renter occupiedHouse owners and renters - American Indian / Alaska Native residents 8 100.0% Renter occupiedHouse owners and renters - Asian residents 465 87.1% Owner occupied69 12.9% Renter occupiedHouse owners and renters - Other race residents 343 49.8% Owner occupied346 50.2% Renter occupiedHouse owners and renters - Two or more races residents 405 58.3% Owner occupied290 41.7% Renter occupiedHouse owners and renters - White alone residents 1,215 63.7% Owner occupied691 36.3% Renter occupiedHouse owners and renters - Hispanic or Latino residents 1,238 52.9% Owner occupied1,102 47.1% Renter occupied
Language usage in Sudley
English speakers - Total 34.5% of residents of Sudley speak English at home.
47.6% of residents speak Spanish at home 4,478 52.8% Speak English very well4,006 47.2% Speak English less than very well17.8% of residents speak other language at home 1,738 54.9% Speak English very well1,430 45.1% Speak English less than very well
English speakers - Born in the United States 83.7% of residents of Sudley speak English at home.
14.5% of residents speak Spanish at home 506 100.0% Speak English very well1.8% of residents speak other language at home 63 100.0% Speak English very well
English speakers - Native, born elsewhere 23.4% of residents of Sudley speak English at home.
64.3% of residents speak Spanish at home 288 95.4% Speak English very well14 4.6% Speak English less than very well22.6% of residents speak other language at home 106 100.0% Speak English very well
English speakers - Foreign-born 9.6% of residents of Sudley speak English at home.
61.8% of residents speak Spanish at home 1,761 31.3% Speak English very well3,873 68.7% Speak English less than very well28.7% of residents speak other language at home 1,236 47.2% Speak English very well1,384 52.8% Speak English less than very well
White (Caucasian) - Speak only English Native:
63.8% (3,000)Foreign-born:
7.0% (164)
White (Caucasian) - Speak another language Native:
25.5% (1,201)Foreign-born:
92.4% (2,167)
Black or African American - Speak only English Native:
99.2% (1,216)Foreign-born:
26.3% (92)
Black or African American - Speak another language Native:
0.4% (5)Foreign-born:
64.1% (224)
Asian - Speak only English Native:
32.1% (92)Foreign-born:
4.4% (66)
Asian - Speak another language Native:
69.9% (200)Foreign-born:
95.8% (1,443)
Other race - Speak only English Native:
4.2% (37)Foreign-born:
39.6% (694)
Other race - Speak another language Native:
96.2% (863)Foreign-born:
71.0% (1,244)
Two or more races - Speak only English Native:
57.3% (878)Foreign-born:
8.5% (178)
Two or more races - Speak another language Native:
46.7% (716)Foreign-born:
91.1% (1,898)
White alone - Speak only English Native:
92.8% (2,845)Foreign-born:
18.0% (166)
White alone - Speak another language Native:
6.6% (203)Foreign-born:
82.6% (760)
Hispanic or Latino - Speak only English Native:
24.6% (961)Foreign-born:
11.7% (747)
Hispanic or Latino - Speak another language Native:
74.5% (2,909)Foreign-born:
89.5% (5,726)
Foreign-born residents in Sudley 9,514 residents are foreign born (32.9% Latin America , 11.2% Asia ).
This city:
48.7%Virginia:
12.6%
Marital status for residents in Sudley Marital status - White (Caucasian) population 15 years and over
Males 45.0% Never married44.1% Now married4.5% Separated1.1% Widowed5.3% DivorcedFemales 38.3% Never married42.3% Now married4.1% Separated8.2% Widowed7.1% DivorcedWomen who gave birth in the past 12 months Now married:
45.4% (77)Unmarried:
54.6% (93)
Women who did not give birth in the past 12 months Now married:
42.7% (813)Unmarried:
57.3% (1,094)
Marital status - Black or African American population 15 years and over
Males 32.4% Never married58.1% Now married1.5% Separated0.0% Widowed8.1% DivorcedFemales 36.2% Never married52.2% Now married0.0% Separated0.0% Widowed11.6% DivorcedWomen who gave birth in the past 12 months Now married:
0.0% (0)Unmarried:
100.0% (19)
Women who did not give birth in the past 12 months Now married:
69.2% (277)Unmarried:
30.8% (124)
Marital status - Asian population 15 years and over
Males 26.6% Never married60.2% Now married0.0% Separated0.0% Widowed13.2% DivorcedFemales 6.3% Never married89.2% Now married4.5% Separated0.0% Widowed0.0% DivorcedWomen who gave birth in the past 12 months Now married:
100.0% (10)Unmarried:
0.0% (0)
Women who did not give birth in the past 12 months Now married:
88.3% (308)Unmarried:
11.7% (41)
Marital status - Other race population 15 years and over
Males 30.1% Never married65.6% Now married1.3% Separated2.9% Widowed0.0% DivorcedFemales 35.6% Never married47.5% Now married2.8% Separated11.7% Widowed2.4% DivorcedWomen who gave birth in the past 12 months Now married:
80.0% (154)Unmarried:
20.0% (39)
Women who did not give birth in the past 12 months Now married:
45.7% (182)Unmarried:
54.3% (217)
Marital status - Two or more races population 15 years and over
Males 42.0% Never married39.2% Now married0.0% Separated18.7% Widowed0.0% DivorcedFemales 41.0% Never married50.1% Now married0.0% Separated0.0% Widowed8.9% DivorcedWomen who did not give birth in the past 12 months Now married:
42.3% (422)Unmarried:
57.7% (574)
Marital status - White alone, not Hispanic / Latino population 15 years and over
Males 33.7% Never married53.1% Now married1.2% Separated2.5% Widowed9.5% DivorcedFemales 26.4% Never married48.4% Now married0.0% Separated14.4% Widowed10.9% DivorcedWomen who gave birth in the past 12 months Now married:
100.0% (90)Unmarried:
0.0% (0)
Women who did not give birth in the past 12 months Now married:
42.6% (373)Unmarried:
57.4% (502)
Marital status - Hispanic or Latino population 15 years and over
Males 46.9% Never married42.6% Now married4.7% Separated4.4% Widowed1.5% DivorcedFemales 45.4% Never married41.6% Now married5.3% Separated3.2% Widowed4.4% DivorcedWomen who gave birth in the past 12 months Now married:
45.0% (121)Unmarried:
55.0% (148)
Women who did not give birth in the past 12 months Now married:
43.2% (1,048)Unmarried:
56.8% (1,380)
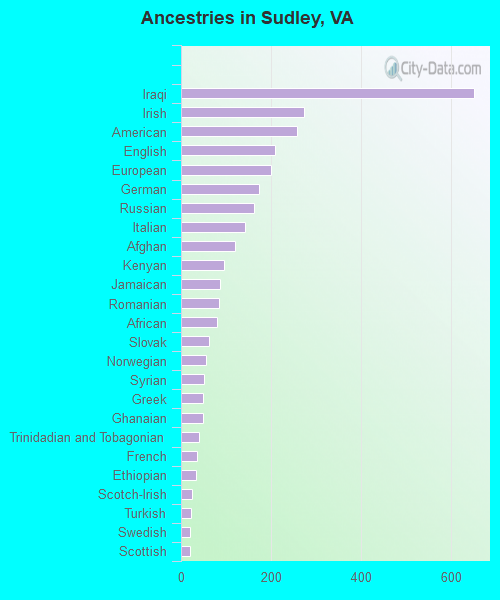
Ancestries in Sudley
651 4.9% Iraqi274 2.1% Irish257 1.9% American208 1.6% English200 1.5% European172 1.3% German161 1.2% Russian141 1.1% Italian120 0.9% Afghan95 0.7% Kenyan87 0.7% Jamaican85 0.6% Romanian80 0.6% African63 0.5% Slovak56 0.4% Norwegian51 0.4% Syrian48 0.4% Greek48 0.4% Ghanaian41 0.3% Trinidadian and Tobagonian35 0.3% French34 0.3% Ethiopian25 0.2% Scotch-Irish23 0.2% Turkish21 0.2% Swedish19 0.1% Scottish15 0.1% British West Indian13 0.10% Sudanese10 0.08% Jordanian7 0.05% Polish
Geographical mobility in Sudley Same house 1 year ago 7,171 78.6% White (Caucasian)1,387 87.1% Black or African American5 96.1% American Indian / Alaska Native1,815 90.5% Asian1,947 63.8% Other race3,323 91.2% Two or more races3,581 85.4% White alone, not Hispanic / Latino8,637 75.5% Hispanic or LatinoMoved within same county 929 10.2% White / Caucasian140 8.8% Black or African American461 15.1% Other race172 4.1% White alone, not Hispanic / Latino1,207 10.6% Hispanic or LatinoMoved within same state 811 8.9% White / Caucasian68 4.3% Black or African American141 7.0% Asian48 1.6% Other race131 3.6% Two or more races365 8.7% White alone, not Hispanic / Latino825 7.2% Hispanic or LatinoMoved from different state 309 3.4% White / Caucasian27 1.4% Asian129 4.2% Other race197 5.4% Two or more races49 1.2% White alone, not Hispanic / Latino657 5.7% Hispanic or LatinoMoved from abroad 55 0.6% White97 3.2% Other race48 1.1% White alone, not Hispanic / Latino87 0.8% Hispanic or Latino
Children Nativity (place of birth) in Sudley
Children under 6 years - Living with two parents Both parents native 227 98.7% Native3 1.3% Foreign-bornBoth parents foreign-born 821 83.0% Native168 17.0% Foreign-bornOne native, one foreign-born parent 12 100.0% NativeChildren under 6 years - Living with one parent Native parent 319 100.0% NativeForeign-born parent 168 85.3% Native29 14.7% Foreign-bornChildren 6 to 17 years - Living with two parents Both parents native 313 100.0% NativeBoth parents foreign-born 872 66.2% Native446 33.8% Foreign-bornOne native, one foreign-born parent 84 100.0% NativeChildren 6 to 17 years - Living with one parent Foreign-born parent 1,327 53.3% Native1,163 46.7% Foreign-born
Grandparents responsible for own grandchildren in Sudley
Grandparents (30 to 59 years) White / Caucasian 238 100.0% Not responsible for grandchildrenOther race 189 66.8% Responsible for grandchildren94 33.2% Not responsible for grandchildrenWhite alone, not Hispanic / Latino 71 100.0% Not responsible for grandchildrenHispanic or Latino 161 40.1% Responsible for grandchildren240 59.9% Not responsible for grandchildrenGrandparents (60 years and over) White / Caucasian 11 11.0% Responsible for grandchildren87 89.0% Not responsible for grandchildrenOther race 27 10.1% Responsible for grandchildren241 89.9% Not responsible for grandchildrenWhite alone, not Hispanic / Latino 12 31.2% Responsible for grandchildren27 68.8% Not responsible for grandchildrenHispanic or Latino 14 6.2% Responsible for grandchildren206 93.8% Not responsible for grandchildren