Races in The Dalles, Oregon (OR) Detailed Stats
Ancestries, Foreign-born residents, place of birth

Data:
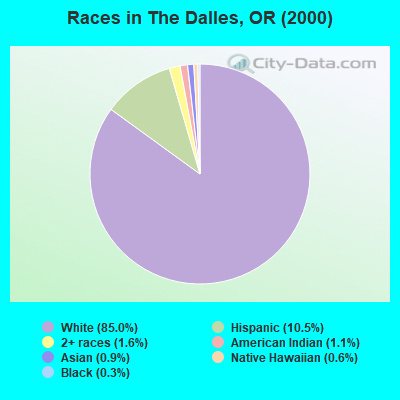
Race distribution in The Dalles

- 16,64785.0%White alone
- 2,05210.5%Hispanic
- 3071.6%Two or more races
- 2251.1%American Indian alone
- 1700.9%Asian alone
- 1080.6%Native Hawaiian and Other
Pacific Islander alone
- 610.3%Black alone
- 170.09%Other race alone
2000
2022
-
- 2,857,61683.5%White alone
- 275,3148.0%Hispanic
- 100,3332.9%Asian alone
- 82,7332.4%Two or more races
- 53,3251.6%Black alone
- 40,1301.2%American Indian alone
- 7,3980.2%Native Hawaiian and Other
Pacific Islander alone
- 4,5500.1%Other race alone
-
- 3,037,57171.6%White alone
- 609,53814.4%Hispanic
- 252,7446.0%Two or more races
- 191,2834.5%Asian alone
- 78,2281.8%Black alone
- 29,3990.7%American Indian alone
- 25,7310.6%Other race alone
- 15,6430.4%Native Hawaiian and Other
Pacific Islander alone
Income and house value in The Dalles
- Median household income in 2022
- $68,312White non-Hispanic householders
- $133,798Black householders
- $34,473American Indian and Alaska Native householders
- $88,952Asian householders
- $110,520Native Hawaiian and other Pacific Islander householders
- $61,177Some other race householders
- $55,750Two or more races householders
- $60,383Hispanic or Latino race householders
- Median 2022 house value
- $361,114White Non-Hispanic householders
- $293,010Black or African American householders
- $293,343American Indian or Alaska Native householders
- $456,791Asian householders
- $285,037Some other race householders
- $355,799Two or more races householders
- $301,316Hispanic or Latino householders