Races in Tualatin, Oregon (OR) Detailed Stats
Data:
Races - White alone (%)
Races - White alone (% change since 2000)
Races - Black alone (%)
Races - Black alone (% change since 2000)
Races - American Indian alone (%)
Races - American Indian alone (% change since 2000)
Races - Asian alone (%)
Races - Asian alone (% change since 2000)
Races - Hispanic (%)
Races - Hispanic (% change since 2000)
Races - Native Hawaiian and Other Pacific Islander alone (%)
Races - Native Hawaiian and Other Pacific Islander alone (% change since 2000)
Races - Two or more races(%)
Races - Two or more races(% change since 2000)
Races - Other race alone (%)
Races - Other race alone (% change since 2000)
Racial diversity
Place of birth - Born in state of residence (%)
Place of birth - Born in state of residence (%) - White
Place of birth - Born in state of residence (%) - Black or African American
Place of birth - Born in state of residence (%) - Asian
Place of birth - Born in state of residence (%) - Hispanic or Latino
Place of birth - Born in state of residence (%) - American Indian and Alaska Native
Place of birth - Born in state of residence (%) - Multirace
Place of birth - Born in state of residence (%) - Other Race
Place of birth - Born in other state (%)
Place of birth - Born in other state (%) - White
Place of birth - Born in other state (%) - Black or African American
Place of birth - Born in other state (%) - Asian
Place of birth - Born in other state (%) - Hispanic or Latino
Place of birth - Born in other state (%) - American Indian and Alaska Native
Place of birth - Born in other state (%) - Multirace
Place of birth - Born in other state (%) - Other Race
Place of birth - Native, outside of US (%)
Place of birth - Native, outside of US (%) - White
Place of birth - Native, outside of US (%) - Black or African American
Place of birth - Native, outside of US (%) - Asian
Place of birth - Native, outside of US (%) - Hispanic or Latino
Place of birth - Native, outside of US (%) - American Indian and Alaska Native
Place of birth - Native, outside of US (%) - Multirace
Place of birth - Native, outside of US (%) - Other Race
Place of birth - Foreign born (%)
Place of birth - Foreign born (%) - White
Place of birth - Foreign born (%) - Black or African American
Place of birth - Foreign born (%) - Asian
Place of birth - Foreign born (%) - Hispanic or Latino
Place of birth - Foreign born (%) - American Indian and Alaska Native
Place of birth - Foreign born (%) - Multirace
Place of birth - Foreign born (%) - Other Race
Residents speaking English at home (%)
Residents speaking English at home - Born in the United States (%)
Residents speaking English at home - Native, born elsewhere (%)
Residents speaking English at home - Foreign born (%)
Residents speaking Spanish at home (%)
Residents speaking Spanish at home - Born in the United States (%)
Residents speaking Spanish at home - Native, born elsewhere (%)
Residents speaking Spanish at home - Foreign born (%)
Residents speaking other language at home (%)
Residents speaking other language at home - Born in the United States (%)
Residents speaking other language at home - Native, born elsewhere (%)
Residents speaking other language at home - Foreign born (%)
Marital status - Never married (%)
Marital status - Now married (%)
Marital status - Separated (%)
Marital status - Widowed (%)
Marital status - Divorced (%)
Ancestries Reported - Arab (%)
Ancestries Reported - Czech (%)
Ancestries Reported - Danish (%)
Ancestries Reported - Dutch (%)
Ancestries Reported - English (%)
Ancestries Reported - French (%)
Ancestries Reported - French Canadian (%)
Ancestries Reported - German (%)
Ancestries Reported - Greek (%)
Ancestries Reported - Hungarian (%)
Ancestries Reported - Irish (%)
Ancestries Reported - Italian (%)
Ancestries Reported - Lithuanian (%)
Ancestries Reported - Norwegian (%)
Ancestries Reported - Polish (%)
Ancestries Reported - Portuguese (%)
Ancestries Reported - Russian (%)
Ancestries Reported - Scotch-Irish (%)
Ancestries Reported - Scottish (%)
Ancestries Reported - Slovak (%)
Ancestries Reported - Subsaharan African (%)
Ancestries Reported - Swedish (%)
Ancestries Reported - Swiss (%)
Ancestries Reported - Ukrainian (%)
Ancestries Reported - United States (%)
Ancestries Reported - Welsh (%)
Ancestries Reported - West Indian (%)
Ancestries Reported - Other (%)
Geographical mobility - Same house 1 year ago (%)
Geographical mobility - Same house 1 year ago (%) - White
Geographical mobility - Same house 1 year ago (%) - Black or African American
Geographical mobility - Same house 1 year ago (%) - Asian
Geographical mobility - Same house 1 year ago (%) - Hispanic or Latino
Geographical mobility - Same house 1 year ago (%) - American Indian and Alaska Native
Geographical mobility - Same house 1 year ago (%) - Multirace
Geographical mobility - Same house 1 year ago (%) - Other Race
Geographical mobility - Moved within same county (%)
Geographical mobility - Moved within same county (%) - White
Geographical mobility - Moved within same county (%) - Black or African American
Geographical mobility - Moved within same county (%) - Asian
Geographical mobility - Moved within same county (%) - Hispanic or Latino
Geographical mobility - Moved within same county (%) - American Indian and Alaska Native
Geographical mobility - Moved within same county (%) - Multirace
Geographical mobility - Moved within same county (%) - Other Race
Geographical mobility - Moved from different county within same state (%)
Geographical mobility - Moved from different county within same state (%) - White
Geographical mobility - Moved from different county within same state (%) - Black or African American
Geographical mobility - Moved from different county within same state (%) - Asian
Geographical mobility - Moved from different county within same state (%) - Hispanic or Latino
Geographical mobility - Moved from different county within same state (%) - American Indian and Alaska Native
Geographical mobility - Moved from different county within same state (%) - Multirace
Geographical mobility - Moved from different county within same state (%) - Other Race
Geographical mobility - Moved from different state (%)
Geographical mobility - Moved from different state (%) - White
Geographical mobility - Moved from different state (%) - Black or African American
Geographical mobility - Moved from different state (%) - Asian
Geographical mobility - Moved from different state (%) - Hispanic or Latino
Geographical mobility - Moved from different state (%) - American Indian and Alaska Native
Geographical mobility - Moved from different state (%) - Multirace
Geographical mobility - Moved from different state (%) - Other Race
Geographical mobility - Moved from abroad (%)
Geographical mobility - Moved from abroad (%) - White
Geographical mobility - Moved from abroad (%) - Black or African American
Geographical mobility - Moved from abroad (%) - Asian
Geographical mobility - Moved from abroad (%) - Hispanic or Latino
Geographical mobility - Moved from abroad (%) - American Indian and Alaska Native
Geographical mobility - Moved from abroad (%) - Multirace
Geographical mobility - Moved from abroad (%) - Other Race
Place of birth for the foreign-born population - Ireland (%)
Place of birth for the foreign-born population - Denmark (%)
Place of birth for the foreign-born population - Norway (%)
Place of birth for the foreign-born population - Sweden (%)
Place of birth for the foreign-born population - United Kingdom (%)
Place of birth for the foreign-born population - England (%)
Place of birth for the foreign-born population - Scotland (%)
Place of birth for the foreign-born population - Other Northern Europe (%)
Place of birth for the foreign-born population - Austria (%)
Place of birth for the foreign-born population - Belgium (%)
Place of birth for the foreign-born population - France (%)
Place of birth for the foreign-born population - Germany (%)
Place of birth for the foreign-born population - Netherlands (%)
Place of birth for the foreign-born population - Switzerland (%)
Place of birth for the foreign-born population - Other Western Europe (%)
Place of birth for the foreign-born population - Greece (%)
Place of birth for the foreign-born population - Italy (%)
Place of birth for the foreign-born population - Portugal (%)
Place of birth for the foreign-born population - Spain (%)
Place of birth for the foreign-born population - Other Southern Europe (%)
Place of birth for the foreign-born population - Albania (%)
Place of birth for the foreign-born population - Belarus (%)
Place of birth for the foreign-born population - Bosnia and Herzegovina (%)
Place of birth for the foreign-born population - Bulgaria (%)
Place of birth for the foreign-born population - Croatia (%)
Place of birth for the foreign-born population - Czechoslovakia (%)
Place of birth for the foreign-born population - Hungary (%)
Place of birth for the foreign-born population - Latvia (%)
Place of birth for the foreign-born population - Lithuania (%)
Place of birth for the foreign-born population - North Macedonia (Macedonia) (%)
Place of birth for the foreign-born population - Moldova (%)
Place of birth for the foreign-born population - Poland (%)
Place of birth for the foreign-born population - Romania (%)
Place of birth for the foreign-born population - Russia (%)
Place of birth for the foreign-born population - Serbia (%)
Place of birth for the foreign-born population - Ukraine (%)
Place of birth for the foreign-born population - Other Eastern Europe (%)
Place of birth for the foreign-born population - China (%)
Place of birth for the foreign-born population - Hong Kong (%)
Place of birth for the foreign-born population - Taiwan (%)
Place of birth for the foreign-born population - Japan (%)
Place of birth for the foreign-born population - Korea (%)
Place of birth for the foreign-born population - Other Eastern Asia (%)
Place of birth for the foreign-born population - Afghanistan (%)
Place of birth for the foreign-born population - Bangladesh (%)
Place of birth for the foreign-born population - India (%)
Place of birth for the foreign-born population - Iran (%)
Place of birth for the foreign-born population - Kazakhstan (%)
Place of birth for the foreign-born population - Nepal (%)
Place of birth for the foreign-born population - Pakistan (%)
Place of birth for the foreign-born population - Sri Lanka (%)
Place of birth for the foreign-born population - Uzbekistan (%)
Place of birth for the foreign-born population - Other South Central Asia (%)
Place of birth for the foreign-born population - Burma (%)
Place of birth for the foreign-born population - Cambodia (%)
Place of birth for the foreign-born population - Indonesia (%)
Place of birth for the foreign-born population - Laos (%)
Place of birth for the foreign-born population - Malaysia (%)
Place of birth for the foreign-born population - Philippines (%)
Place of birth for the foreign-born population - Singapore (%)
Place of birth for the foreign-born population - Thailand (%)
Place of birth for the foreign-born population - Vietnam (%)
Place of birth for the foreign-born population - Other South Eastern Asia (%)
Place of birth for the foreign-born population - Armenia (%)
Place of birth for the foreign-born population - Iraq (%)
Place of birth for the foreign-born population - Israel (%)
Place of birth for the foreign-born population - Jordan (%)
Place of birth for the foreign-born population - Kuwait (%)
Place of birth for the foreign-born population - Lebanon (%)
Place of birth for the foreign-born population - Saudi Arabia (%)
Place of birth for the foreign-born population - Syria (%)
Place of birth for the foreign-born population - Turkey (%)
Place of birth for the foreign-born population - Yemen (%)
Place of birth for the foreign-born population - Other Western Asia (%)
Place of birth for the foreign-born population - Eritrea (%)
Place of birth for the foreign-born population - Ethiopia (%)
Place of birth for the foreign-born population - Kenya (%)
Place of birth for the foreign-born population - Somalia (%)
Place of birth for the foreign-born population - Uganda (%)
Place of birth for the foreign-born population - Zimbabwe (%)
Place of birth for the foreign-born population - Other Eastern Africa (%)
Place of birth for the foreign-born population - Cameroon (%)
Place of birth for the foreign-born population - Congo (%)
Place of birth for the foreign-born population - Democratic Republic of Congo (Zaire) (%)
Place of birth for the foreign-born population - Other Middle Africa (%)
Place of birth for the foreign-born population - Egypt (%)
Place of birth for the foreign-born population - Morocco (%)
Place of birth for the foreign-born population - Sudan (%)
Place of birth for the foreign-born population - Other Northern Africa (%)
Place of birth for the foreign-born population - South Africa (%)
Place of birth for the foreign-born population - Other Southern Africa (%)
Place of birth for the foreign-born population - Cabo Verde (%)
Place of birth for the foreign-born population - Ghana (%)
Place of birth for the foreign-born population - Liberia (%)
Place of birth for the foreign-born population - Nigeria (%)
Place of birth for the foreign-born population - Senegal (%)
Place of birth for the foreign-born population - Sierra Leone (%)
Place of birth for the foreign-born population - Other Western Africa (%)
Place of birth for the foreign-born population - Australia (%)
Place of birth for the foreign-born population - New Zealand (%)
Place of birth for the foreign-born population - Fiji (%)
Place of birth for the foreign-born population - Micronesia (%)
Place of birth for the foreign-born population - Bahamas (%)
Place of birth for the foreign-born population - Barbados (%)
Place of birth for the foreign-born population - Cuba (%)
Place of birth for the foreign-born population - Dominica (%)
Place of birth for the foreign-born population - Dominican Republic (%)
Place of birth for the foreign-born population - Grenada (%)
Place of birth for the foreign-born population - Haiti (%)
Place of birth for the foreign-born population - Jamaica (%)
Place of birth for the foreign-born population - St. Vincent and the Grenadines (%)
Place of birth for the foreign-born population - Trinidad and Tobago (%)
Place of birth for the foreign-born population - West Indies (%)
Place of birth for the foreign-born population - Other Caribbean (%)
Place of birth for the foreign-born population - Belize (%)
Place of birth for the foreign-born population - Costa Rica (%)
Place of birth for the foreign-born population - El Salvador (%)
Place of birth for the foreign-born population - Guatemala (%)
Place of birth for the foreign-born population - Honduras (%)
Place of birth for the foreign-born population - Mexico (%)
Place of birth for the foreign-born population - Nicaragua (%)
Place of birth for the foreign-born population - Panama (%)
Place of birth for the foreign-born population - Other Central America (%)
Place of birth for the foreign-born population - Argentina (%)
Place of birth for the foreign-born population - Bolivia (%)
Place of birth for the foreign-born population - Brazil (%)
Place of birth for the foreign-born population - Chile (%)
Place of birth for the foreign-born population - Colombia (%)
Place of birth for the foreign-born population - Ecuador (%)
Place of birth for the foreign-born population - Guyana (%)
Place of birth for the foreign-born population - Peru (%)
Place of birth for the foreign-born population - Uruguay (%)
Place of birth for the foreign-born population - Venezuela (%)
Place of birth for the foreign-born population - Other South America (%)
Place of birth for the foreign-born population - Canada (%)
Place of birth for the foreign-born population - Other Northern America (%)
Place of birth for the foreign-born population - Other (%)
Latest news about races in Tualatin, OR collected exclusively by city-data.com from local newspapers, TV, and radio stations
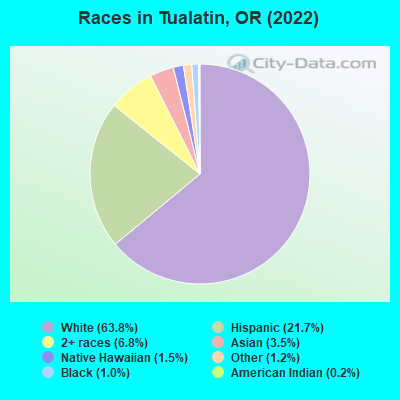
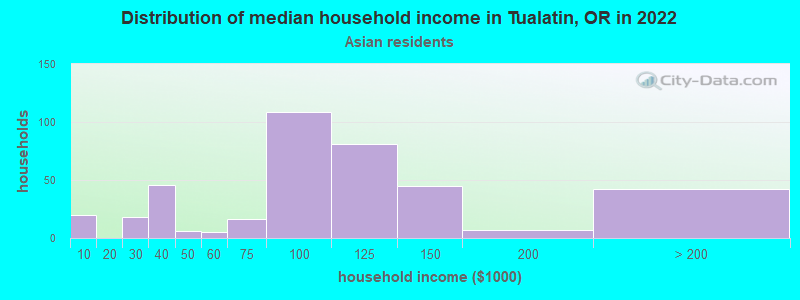
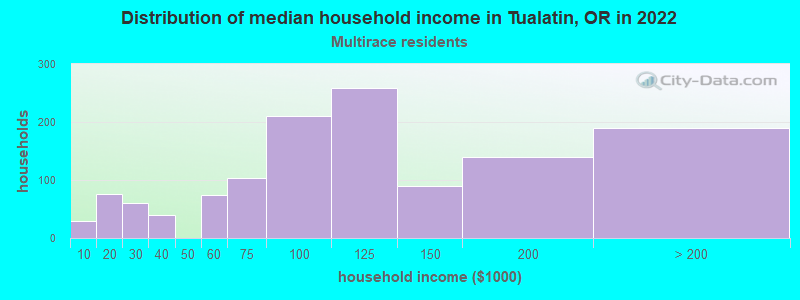
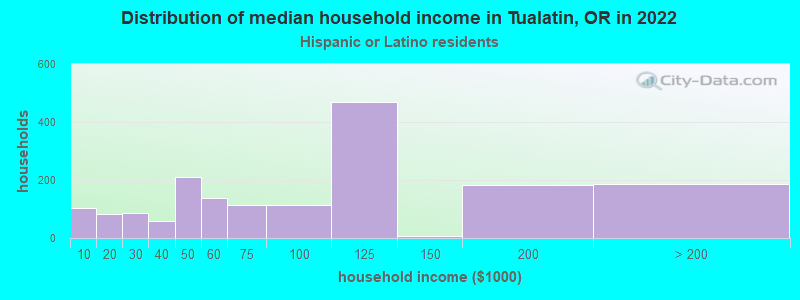
According to 2022 data, the most numerous races in Tualatin, OR are White alone (17,763 residents), Hispanic (6,037 residents), and Two or more races (1,892 residents). 75.7% of Tualatin residents speak English at home. 12.0% of Tualatin, OR residents are foreign-born (6.9% born in Latin America, 3.1% born in Asia), which is 25.0% greater than the foreign-born rate of 9.0% across the entire state of Oregon.
Race distribution in Tualatin
2000 2022
2,857,616 83.5% White alone 275,314 8.0% Hispanic 100,333 2.9% Asian alone 82,733 2.4% Two or more races 53,325 1.6% Black alone 40,130 1.2% American Indian alone 7,398 0.2% Native Hawaiian and Other 4,550 0.1% Other race alone
3,037,571 71.6% White alone 609,538 14.4% Hispanic 252,744 6.0% Two or more races 191,283 4.5% Asian alone 78,228 1.8% Black alone 29,399 0.7% American Indian alone 25,731 0.6% Other race alone 15,643 0.4% Native Hawaiian and Other
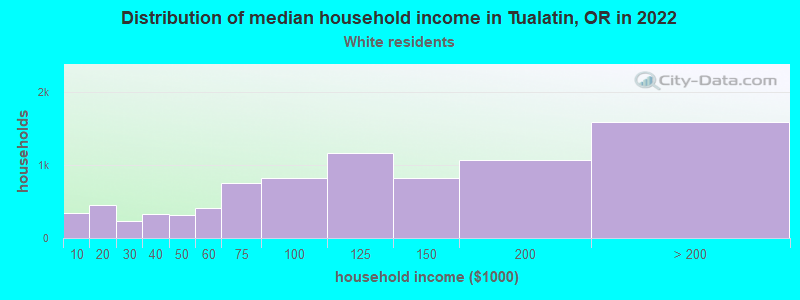
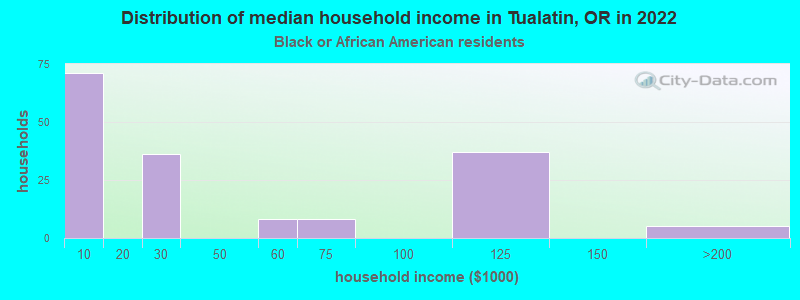
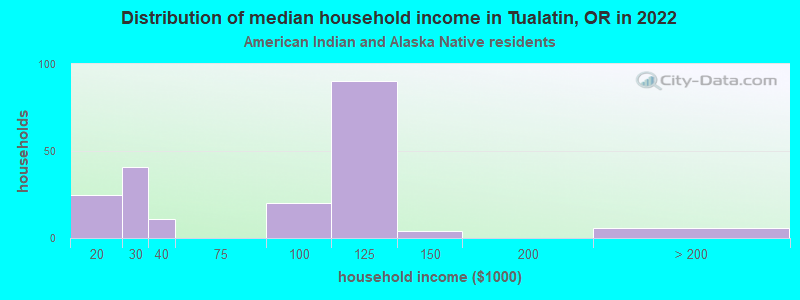
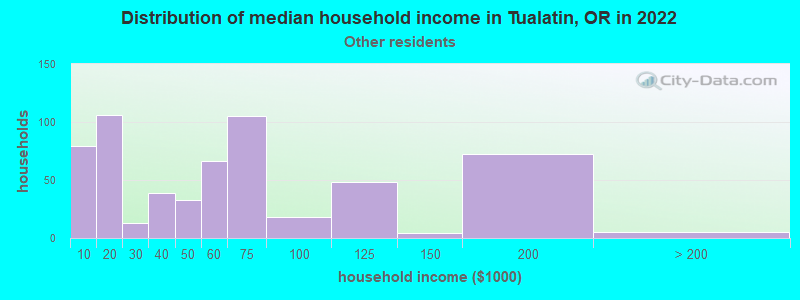
Income and house value in Tualatin Median household income in 2022 $111,828 White non-Hispanic householders$85,661 Asian householders$51,100 Some other race householders$102,218 Two or more races householders$82,507 Hispanic or Latino race householdersMedian 2022 house value $664,702 White Non-Hispanic householders$461,132 Black or African American householders$377,290 American Indian or Alaska Native householders $618,085 Asian householders$610,707 Some other race householders$861,563 Two or more races householders$661,683 Hispanic or Latino householders
Median age by race in Tualatin
41.3 Median age for White residents39.5 43.1 35.5 Median age for Black or African American residents35.3 40.2 48.0 Median age for American Indian / Alaska Native residents62.1 22.8 45.3 Median age for Asian residents47.3 42.4 18.2 Median age for Native Hawaiian / Pacific Islander residents12.9 37.1 26.1 Median age for Other race residents27.6 25.1 29.7 Median age for Two or more races residents31.2 28.8 41.6 Median age for White alone residents40.0 43.5 30.2 Median age for Hispanic or Latino residents33.0 27.8
Owner/renter occupied households by race in Tualatin
House owners and renters - White residents 5,131 61.8% Owner occupied3,172 38.2% Renter occupiedHouse owners and renters - Black or African American residents 13 7.6% Owner occupied165 92.4% Renter occupiedHouse owners and renters - American Indian / Alaska Native residents 14 7.3% Owner occupied177 92.7% Renter occupiedHouse owners and renters - Asian residents 241 60.1% Owner occupied160 39.9% Renter occupiedHouse owners and renters - Native Hawaiian / Pacific Islander residents 51 24.8% Owner occupied154 75.2% Renter occupiedHouse owners and renters - Other race residents 97 16.9% Owner occupied476 83.1% Renter occupiedHouse owners and renters - Two or more races residents 563 40.2% Owner occupied838 59.8% Renter occupiedHouse owners and renters - White alone residents 5,096 62.4% Owner occupied3,073 37.6% Renter occupiedHouse owners and renters - Hispanic or Latino residents 427 24.1% Owner occupied1,342 75.9% Renter occupied
Language usage in Tualatin
English speakers - Total 75.7% of residents of Tualatin speak English at home.
16.9% of residents speak Spanish at home 3,640 81.1% Speak English very well846 18.9% Speak English less than very well7.4% of residents speak other language at home 1,317 66.9% Speak English very well652 33.1% Speak English less than very well
English speakers - Born in the United States 86.6% of residents of Tualatin speak English at home.
9.6% of residents speak Spanish at home 1,030 86.7% Speak English very well158 13.3% Speak English less than very well4.7% of residents speak other language at home 389 67.1% Speak English very well191 32.9% Speak English less than very well
English speakers - Native, born elsewhere 57.0% of residents of Tualatin speak English at home.
12.2% of residents speak Spanish at home 52 76.5% Speak English very well16 23.5% Speak English less than very well44.6% of residents speak other language at home 248 100.0% Speak English very well
English speakers - Foreign-born 13.7% of residents of Tualatin speak English at home.
62.6% of residents speak Spanish at home 1,475 70.7% Speak English very well611 29.3% Speak English less than very well30.2% of residents speak other language at home 509 50.6% Speak English very well497 49.4% Speak English less than very well
White (Caucasian) - Speak only English Native:
95.9% (16,332)Foreign-born:
35.4% (216)
White (Caucasian) - Speak another language Native:
4.2% (708)Foreign-born:
65.8% (403)
Black or African American - Speak another language Native:
48.4% (194)Foreign-born:
100.0% (37)
American Indian / Alaska Native - Speak only English Native:
24.3% (48)Foreign-born:
31.6% (37)
American Indian / Alaska Native - Speak another language Native:
64.2% (126)Foreign-born:
81.8% (96)
Asian - Speak only English Native:
68.8% (226)Foreign-born:
14.1% (95)
Asian - Speak another language Native:
28.6% (94)Foreign-born:
85.5% (579)
Native Hawaiian / Pacific Islander - Speak another language Native:
69.3% (344)Foreign-born:
96.9% (28)
Other race - Speak only English Native:
38.8% (549)Foreign-born:
8.7% (90)
Other race - Speak another language Native:
60.8% (861)Foreign-born:
90.9% (940)
Two or more races - Speak only English Native:
62.0% (2,059)Foreign-born:
2.9% (33)
Two or more races - Speak another language Native:
39.8% (1,322)Foreign-born:
97.3% (1,108)
White alone - Speak only English Native:
97.0% (16,193)Foreign-born:
42.3% (212)
White alone - Speak another language Native:
2.9% (480)Foreign-born:
57.9% (290)
Hispanic or Latino - Speak only English Native:
29.7% (993)Foreign-born:
7.1% (153)
Hispanic or Latino - Speak another language Native:
72.6% (2,427)Foreign-born:
92.6% (2,001)
Foreign-born residents in Tualatin 3,338 residents are foreign born (6.9% Latin America , 3.1% Asia ).
This city:
12.0%Oregon:
9.8%
Marital status for residents in Tualatin Marital status - White (Caucasian) population 15 years and over
Males 35.7% Never married54.9% Now married0.5% Separated1.1% Widowed7.7% DivorcedFemales 23.1% Never married54.6% Now married0.6% Separated5.8% Widowed15.9% DivorcedWomen who gave birth in the past 12 months Now married:
97.5% (215)Unmarried:
2.5% (5)
Women who did not give birth in the past 12 months Now married:
52.2% (2,107)Unmarried:
47.8% (1,928)
Marital status - Black or African American population 15 years and over
Males 49.7% Never married43.6% Now married0.0% Separated0.0% Widowed6.7% DivorcedFemales 41.5% Never married31.7% Now married0.0% Separated4.9% Widowed22.0% DivorcedWomen who gave birth in the past 12 months Now married:
100.0% (4)Unmarried:
0.0% (0)
Women who did not give birth in the past 12 months Now married:
28.4% (33)Unmarried:
71.6% (83)
Marital status - American Indian / Alaska Native population 15 years and over
Males 38.9% Never married39.4% Now married21.8% Separated0.0% Widowed0.0% DivorcedFemales 69.9% Never married30.1% Now married0.0% Separated0.0% Widowed0.0% DivorcedWomen who did not give birth in the past 12 months Now married:
28.0% (40)Unmarried:
72.0% (104)
Marital status - Asian population 15 years and over
Males 31.7% Never married62.0% Now married4.5% Separated0.0% Widowed1.8% DivorcedFemales 26.5% Never married54.0% Now married4.5% Separated1.1% Widowed13.8% DivorcedWomen who did not give birth in the past 12 months Now married:
54.4% (206)Unmarried:
45.6% (173)
Marital status - Native Hawaiian / Pacific Islander population 15 years and over
Males 47.0% Never married44.3% Now married0.0% Separated0.0% Widowed8.7% DivorcedFemales 88.5% Never married6.2% Now married0.0% Separated0.0% Widowed5.4% DivorcedWomen who gave birth in the past 12 months Now married:
100.0% (14)Unmarried:
0.0% (0)
Women who did not give birth in the past 12 months Now married:
1.2% (3)Unmarried:
98.8% (257)
Marital status - Other race population 15 years and over
Males 51.6% Never married48.4% Now married0.0% Separated0.0% Widowed0.0% DivorcedFemales 52.8% Never married35.9% Now married0.0% Separated1.1% Widowed10.2% DivorcedWomen who gave birth in the past 12 months Now married:
0.0% (0)Unmarried:
100.0% (26)
Women who did not give birth in the past 12 months Now married:
38.0% (228)Unmarried:
62.0% (372)
Marital status - Two or more races population 15 years and over
Males 40.5% Never married48.5% Now married4.9% Separated0.0% Widowed6.2% DivorcedFemales 37.1% Never married52.5% Now married0.7% Separated1.0% Widowed8.6% DivorcedWomen who gave birth in the past 12 months Now married:
100.0% (40)Unmarried:
0.0% (0)
Women who did not give birth in the past 12 months Now married:
40.1% (439)Unmarried:
59.9% (655)
Marital status - White alone, not Hispanic / Latino population 15 years and over
Males 35.6% Never married55.2% Now married0.6% Separated1.2% Widowed7.5% DivorcedFemales 22.3% Never married55.2% Now married0.6% Separated5.7% Widowed16.2% DivorcedWomen who gave birth in the past 12 months Now married:
97.5% (228)Unmarried:
2.5% (6)
Women who did not give birth in the past 12 months Now married:
52.9% (2,056)Unmarried:
47.1% (1,834)
Marital status - Hispanic or Latino population 15 years and over
Males 40.4% Never married52.6% Now married4.0% Separated0.0% Widowed3.0% DivorcedFemales 46.9% Never married46.2% Now married0.0% Separated2.0% Widowed4.9% DivorcedWomen who gave birth in the past 12 months Now married:
56.8% (26)Unmarried:
43.2% (20)
Women who did not give birth in the past 12 months Now married:
39.7% (607)Unmarried:
60.3% (922)
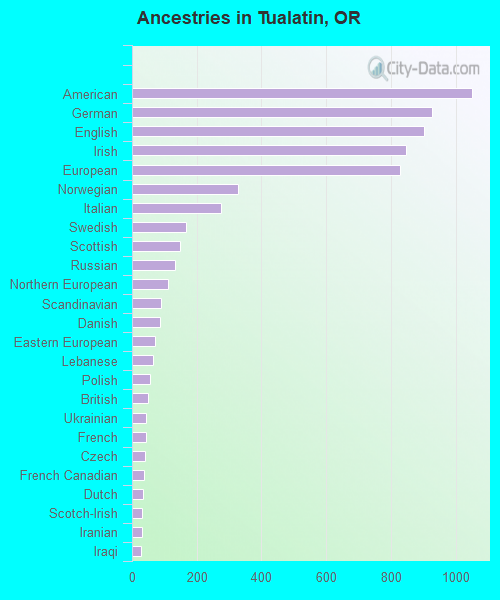
Ancestries in Tualatin
1,051 8.4% American928 7.4% German903 7.2% English846 6.8% Irish829 6.6% European327 2.6% Norwegian276 2.2% Italian167 1.3% Swedish147 1.2% Scottish132 1.1% Russian110 0.9% Northern European89 0.7% Scandinavian87 0.7% Danish72 0.6% Eastern European65 0.5% Lebanese57 0.5% Polish50 0.4% British44 0.4% Ukrainian43 0.3% French40 0.3% Czech37 0.3% French Canadian34 0.3% Dutch31 0.2% Scotch-Irish30 0.2% Iranian28 0.2% Iraqi27 0.2% Portuguese24 0.2% Estonian24 0.2% Hungarian19 0.2% Celtic17 0.1% Swiss16 0.1% Finnish15 0.1% Canadian14 0.1% Jamaican13 0.1% African12 0.10% Welsh11 0.09% Icelander10 0.08% Palestinian10 0.08% Serbian9 0.07% Pennsylvania German9 0.07% Moroccan8 0.06% Basque7 0.06% Slavic6 0.05% Australian5 0.04% Romanian5 0.04% Greek5 0.04% Israeli5 0.04% Lithuanian4 0.03% Brazilian3 0.02% Ethiopian
Geographical mobility in Tualatin Same house 1 year ago 15,262 84.8% White (Caucasian)436 100.0% Black or African American342 84.6% American Indian / Alaska Native968 93.4% Asian549 100.0% Native Hawaiian / Pacific Islander1,923 73.0% Other race3,825 82.6% Two or more races14,961 85.0% White alone, not Hispanic / Latino4,794 80.3% Hispanic or LatinoMoved within same county 762 4.2% White / Caucasian40 9.9% American Indian / Alaska Native21 2.0% Asian355 13.5% Other race249 5.4% Two or more races760 4.3% White alone, not Hispanic / Latino432 7.2% Hispanic or LatinoMoved within same state 1,571 8.7% White / Caucasian29 2.8% Asian234 8.9% Other race520 11.2% Two or more races1,470 8.4% White alone, not Hispanic / Latino385 6.4% Hispanic or LatinoMoved from different state 541 3.0% White / Caucasian19 4.5% Black or African American38 3.7% Asian46 1.0% Two or more races515 2.9% White alone, not Hispanic / Latino126 2.1% Hispanic or LatinoMoved from abroad 49 0.3% White5 0.5% Asian9 0.3% Other race18 0.4% Two or more races46 0.3% White alone, not Hispanic / Latino25 0.4% Hispanic or Latino
Children Nativity (place of birth) in Tualatin
Children under 6 years - Living with two parents Both parents native 972 100.0% NativeBoth parents foreign-born 108 100.0% NativeOne native, one foreign-born parent 182 100.0% NativeChildren under 6 years - Living with one parent Native parent 193 100.0% NativeForeign-born parent 18 100.0% NativeChildren 6 to 17 years - Living with two parents Both parents native 2,255 99.9% Native1 0.1% Foreign-bornBoth parents foreign-born 554 91.3% Native53 8.7% Foreign-bornOne native, one foreign-born parent 461 100.0% NativeChildren 6 to 17 years - Living with one parent Native parent 1,093 100.0% NativeForeign-born parent 34 55.3% Native28 44.7% Foreign-born
Grandparents responsible for own grandchildren in Tualatin
Grandparents (30 to 59 years) White / Caucasian 9 63.2% Responsible for grandchildren5 36.8% Not responsible for grandchildrenOther race 11 100.0% Not responsible for grandchildrenWhite alone, not Hispanic / Latino 9 59.1% Responsible for grandchildren6 40.9% Not responsible for grandchildrenHispanic or Latino 8 100.0% Not responsible for grandchildrenGrandparents (60 years and over) White / Caucasian 6 5.2% Responsible for grandchildren110 94.8% Not responsible for grandchildrenWhite alone, not Hispanic / Latino 6 6.1% Responsible for grandchildren86 93.9% Not responsible for grandchildrenHispanic or Latino 1 1.4% Responsible for grandchildren43 98.6% Not responsible for grandchildren