Races in Waimea, Hawaii (HI) Detailed Stats
Data:
Races - White alone (%)
Races - White alone (% change since 2000)
Races - Black alone (%)
Races - Black alone (% change since 2000)
Races - American Indian alone (%)
Races - American Indian alone (% change since 2000)
Races - Asian alone (%)
Races - Asian alone (% change since 2000)
Races - Hispanic (%)
Races - Hispanic (% change since 2000)
Races - Native Hawaiian and Other Pacific Islander alone (%)
Races - Native Hawaiian and Other Pacific Islander alone (% change since 2000)
Races - Two or more races(%)
Races - Two or more races(% change since 2000)
Races - Other race alone (%)
Races - Other race alone (% change since 2000)
Racial diversity
Place of birth - Born in state of residence (%)
Place of birth - Born in state of residence (%) - White
Place of birth - Born in state of residence (%) - Black or African American
Place of birth - Born in state of residence (%) - Asian
Place of birth - Born in state of residence (%) - Hispanic or Latino
Place of birth - Born in state of residence (%) - American Indian and Alaska Native
Place of birth - Born in state of residence (%) - Multirace
Place of birth - Born in state of residence (%) - Other Race
Place of birth - Born in other state (%)
Place of birth - Born in other state (%) - White
Place of birth - Born in other state (%) - Black or African American
Place of birth - Born in other state (%) - Asian
Place of birth - Born in other state (%) - Hispanic or Latino
Place of birth - Born in other state (%) - American Indian and Alaska Native
Place of birth - Born in other state (%) - Multirace
Place of birth - Born in other state (%) - Other Race
Place of birth - Native, outside of US (%)
Place of birth - Native, outside of US (%) - White
Place of birth - Native, outside of US (%) - Black or African American
Place of birth - Native, outside of US (%) - Asian
Place of birth - Native, outside of US (%) - Hispanic or Latino
Place of birth - Native, outside of US (%) - American Indian and Alaska Native
Place of birth - Native, outside of US (%) - Multirace
Place of birth - Native, outside of US (%) - Other Race
Place of birth - Foreign born (%)
Place of birth - Foreign born (%) - White
Place of birth - Foreign born (%) - Black or African American
Place of birth - Foreign born (%) - Asian
Place of birth - Foreign born (%) - Hispanic or Latino
Place of birth - Foreign born (%) - American Indian and Alaska Native
Place of birth - Foreign born (%) - Multirace
Place of birth - Foreign born (%) - Other Race
Residents speaking English at home (%)
Residents speaking English at home - Born in the United States (%)
Residents speaking English at home - Native, born elsewhere (%)
Residents speaking English at home - Foreign born (%)
Residents speaking Spanish at home (%)
Residents speaking Spanish at home - Born in the United States (%)
Residents speaking Spanish at home - Native, born elsewhere (%)
Residents speaking Spanish at home - Foreign born (%)
Residents speaking other language at home (%)
Residents speaking other language at home - Born in the United States (%)
Residents speaking other language at home - Native, born elsewhere (%)
Residents speaking other language at home - Foreign born (%)
Marital status - Never married (%)
Marital status - Now married (%)
Marital status - Separated (%)
Marital status - Widowed (%)
Marital status - Divorced (%)
Ancestries Reported - Arab (%)
Ancestries Reported - Czech (%)
Ancestries Reported - Danish (%)
Ancestries Reported - Dutch (%)
Ancestries Reported - English (%)
Ancestries Reported - French (%)
Ancestries Reported - French Canadian (%)
Ancestries Reported - German (%)
Ancestries Reported - Greek (%)
Ancestries Reported - Hungarian (%)
Ancestries Reported - Irish (%)
Ancestries Reported - Italian (%)
Ancestries Reported - Lithuanian (%)
Ancestries Reported - Norwegian (%)
Ancestries Reported - Polish (%)
Ancestries Reported - Portuguese (%)
Ancestries Reported - Russian (%)
Ancestries Reported - Scotch-Irish (%)
Ancestries Reported - Scottish (%)
Ancestries Reported - Slovak (%)
Ancestries Reported - Subsaharan African (%)
Ancestries Reported - Swedish (%)
Ancestries Reported - Swiss (%)
Ancestries Reported - Ukrainian (%)
Ancestries Reported - United States (%)
Ancestries Reported - Welsh (%)
Ancestries Reported - West Indian (%)
Ancestries Reported - Other (%)
Geographical mobility - Same house 1 year ago (%)
Geographical mobility - Same house 1 year ago (%) - White
Geographical mobility - Same house 1 year ago (%) - Black or African American
Geographical mobility - Same house 1 year ago (%) - Asian
Geographical mobility - Same house 1 year ago (%) - Hispanic or Latino
Geographical mobility - Same house 1 year ago (%) - American Indian and Alaska Native
Geographical mobility - Same house 1 year ago (%) - Multirace
Geographical mobility - Same house 1 year ago (%) - Other Race
Geographical mobility - Moved within same county (%)
Geographical mobility - Moved within same county (%) - White
Geographical mobility - Moved within same county (%) - Black or African American
Geographical mobility - Moved within same county (%) - Asian
Geographical mobility - Moved within same county (%) - Hispanic or Latino
Geographical mobility - Moved within same county (%) - American Indian and Alaska Native
Geographical mobility - Moved within same county (%) - Multirace
Geographical mobility - Moved within same county (%) - Other Race
Geographical mobility - Moved from different county within same state (%)
Geographical mobility - Moved from different county within same state (%) - White
Geographical mobility - Moved from different county within same state (%) - Black or African American
Geographical mobility - Moved from different county within same state (%) - Asian
Geographical mobility - Moved from different county within same state (%) - Hispanic or Latino
Geographical mobility - Moved from different county within same state (%) - American Indian and Alaska Native
Geographical mobility - Moved from different county within same state (%) - Multirace
Geographical mobility - Moved from different county within same state (%) - Other Race
Geographical mobility - Moved from different state (%)
Geographical mobility - Moved from different state (%) - White
Geographical mobility - Moved from different state (%) - Black or African American
Geographical mobility - Moved from different state (%) - Asian
Geographical mobility - Moved from different state (%) - Hispanic or Latino
Geographical mobility - Moved from different state (%) - American Indian and Alaska Native
Geographical mobility - Moved from different state (%) - Multirace
Geographical mobility - Moved from different state (%) - Other Race
Geographical mobility - Moved from abroad (%)
Geographical mobility - Moved from abroad (%) - White
Geographical mobility - Moved from abroad (%) - Black or African American
Geographical mobility - Moved from abroad (%) - Asian
Geographical mobility - Moved from abroad (%) - Hispanic or Latino
Geographical mobility - Moved from abroad (%) - American Indian and Alaska Native
Geographical mobility - Moved from abroad (%) - Multirace
Geographical mobility - Moved from abroad (%) - Other Race
Place of birth for the foreign-born population - Ireland (%)
Place of birth for the foreign-born population - Denmark (%)
Place of birth for the foreign-born population - Norway (%)
Place of birth for the foreign-born population - Sweden (%)
Place of birth for the foreign-born population - United Kingdom (%)
Place of birth for the foreign-born population - England (%)
Place of birth for the foreign-born population - Scotland (%)
Place of birth for the foreign-born population - Other Northern Europe (%)
Place of birth for the foreign-born population - Austria (%)
Place of birth for the foreign-born population - Belgium (%)
Place of birth for the foreign-born population - France (%)
Place of birth for the foreign-born population - Germany (%)
Place of birth for the foreign-born population - Netherlands (%)
Place of birth for the foreign-born population - Switzerland (%)
Place of birth for the foreign-born population - Other Western Europe (%)
Place of birth for the foreign-born population - Greece (%)
Place of birth for the foreign-born population - Italy (%)
Place of birth for the foreign-born population - Portugal (%)
Place of birth for the foreign-born population - Spain (%)
Place of birth for the foreign-born population - Other Southern Europe (%)
Place of birth for the foreign-born population - Albania (%)
Place of birth for the foreign-born population - Belarus (%)
Place of birth for the foreign-born population - Bosnia and Herzegovina (%)
Place of birth for the foreign-born population - Bulgaria (%)
Place of birth for the foreign-born population - Croatia (%)
Place of birth for the foreign-born population - Czechoslovakia (%)
Place of birth for the foreign-born population - Hungary (%)
Place of birth for the foreign-born population - Latvia (%)
Place of birth for the foreign-born population - Lithuania (%)
Place of birth for the foreign-born population - North Macedonia (Macedonia) (%)
Place of birth for the foreign-born population - Moldova (%)
Place of birth for the foreign-born population - Poland (%)
Place of birth for the foreign-born population - Romania (%)
Place of birth for the foreign-born population - Russia (%)
Place of birth for the foreign-born population - Serbia (%)
Place of birth for the foreign-born population - Ukraine (%)
Place of birth for the foreign-born population - Other Eastern Europe (%)
Place of birth for the foreign-born population - China (%)
Place of birth for the foreign-born population - Hong Kong (%)
Place of birth for the foreign-born population - Taiwan (%)
Place of birth for the foreign-born population - Japan (%)
Place of birth for the foreign-born population - Korea (%)
Place of birth for the foreign-born population - Other Eastern Asia (%)
Place of birth for the foreign-born population - Afghanistan (%)
Place of birth for the foreign-born population - Bangladesh (%)
Place of birth for the foreign-born population - India (%)
Place of birth for the foreign-born population - Iran (%)
Place of birth for the foreign-born population - Kazakhstan (%)
Place of birth for the foreign-born population - Nepal (%)
Place of birth for the foreign-born population - Pakistan (%)
Place of birth for the foreign-born population - Sri Lanka (%)
Place of birth for the foreign-born population - Uzbekistan (%)
Place of birth for the foreign-born population - Other South Central Asia (%)
Place of birth for the foreign-born population - Burma (%)
Place of birth for the foreign-born population - Cambodia (%)
Place of birth for the foreign-born population - Indonesia (%)
Place of birth for the foreign-born population - Laos (%)
Place of birth for the foreign-born population - Malaysia (%)
Place of birth for the foreign-born population - Philippines (%)
Place of birth for the foreign-born population - Singapore (%)
Place of birth for the foreign-born population - Thailand (%)
Place of birth for the foreign-born population - Vietnam (%)
Place of birth for the foreign-born population - Other South Eastern Asia (%)
Place of birth for the foreign-born population - Armenia (%)
Place of birth for the foreign-born population - Iraq (%)
Place of birth for the foreign-born population - Israel (%)
Place of birth for the foreign-born population - Jordan (%)
Place of birth for the foreign-born population - Kuwait (%)
Place of birth for the foreign-born population - Lebanon (%)
Place of birth for the foreign-born population - Saudi Arabia (%)
Place of birth for the foreign-born population - Syria (%)
Place of birth for the foreign-born population - Turkey (%)
Place of birth for the foreign-born population - Yemen (%)
Place of birth for the foreign-born population - Other Western Asia (%)
Place of birth for the foreign-born population - Eritrea (%)
Place of birth for the foreign-born population - Ethiopia (%)
Place of birth for the foreign-born population - Kenya (%)
Place of birth for the foreign-born population - Somalia (%)
Place of birth for the foreign-born population - Uganda (%)
Place of birth for the foreign-born population - Zimbabwe (%)
Place of birth for the foreign-born population - Other Eastern Africa (%)
Place of birth for the foreign-born population - Cameroon (%)
Place of birth for the foreign-born population - Congo (%)
Place of birth for the foreign-born population - Democratic Republic of Congo (Zaire) (%)
Place of birth for the foreign-born population - Other Middle Africa (%)
Place of birth for the foreign-born population - Egypt (%)
Place of birth for the foreign-born population - Morocco (%)
Place of birth for the foreign-born population - Sudan (%)
Place of birth for the foreign-born population - Other Northern Africa (%)
Place of birth for the foreign-born population - South Africa (%)
Place of birth for the foreign-born population - Other Southern Africa (%)
Place of birth for the foreign-born population - Cabo Verde (%)
Place of birth for the foreign-born population - Ghana (%)
Place of birth for the foreign-born population - Liberia (%)
Place of birth for the foreign-born population - Nigeria (%)
Place of birth for the foreign-born population - Senegal (%)
Place of birth for the foreign-born population - Sierra Leone (%)
Place of birth for the foreign-born population - Other Western Africa (%)
Place of birth for the foreign-born population - Australia (%)
Place of birth for the foreign-born population - New Zealand (%)
Place of birth for the foreign-born population - Fiji (%)
Place of birth for the foreign-born population - Micronesia (%)
Place of birth for the foreign-born population - Bahamas (%)
Place of birth for the foreign-born population - Barbados (%)
Place of birth for the foreign-born population - Cuba (%)
Place of birth for the foreign-born population - Dominica (%)
Place of birth for the foreign-born population - Dominican Republic (%)
Place of birth for the foreign-born population - Grenada (%)
Place of birth for the foreign-born population - Haiti (%)
Place of birth for the foreign-born population - Jamaica (%)
Place of birth for the foreign-born population - St. Vincent and the Grenadines (%)
Place of birth for the foreign-born population - Trinidad and Tobago (%)
Place of birth for the foreign-born population - West Indies (%)
Place of birth for the foreign-born population - Other Caribbean (%)
Place of birth for the foreign-born population - Belize (%)
Place of birth for the foreign-born population - Costa Rica (%)
Place of birth for the foreign-born population - El Salvador (%)
Place of birth for the foreign-born population - Guatemala (%)
Place of birth for the foreign-born population - Honduras (%)
Place of birth for the foreign-born population - Mexico (%)
Place of birth for the foreign-born population - Nicaragua (%)
Place of birth for the foreign-born population - Panama (%)
Place of birth for the foreign-born population - Other Central America (%)
Place of birth for the foreign-born population - Argentina (%)
Place of birth for the foreign-born population - Bolivia (%)
Place of birth for the foreign-born population - Brazil (%)
Place of birth for the foreign-born population - Chile (%)
Place of birth for the foreign-born population - Colombia (%)
Place of birth for the foreign-born population - Ecuador (%)
Place of birth for the foreign-born population - Guyana (%)
Place of birth for the foreign-born population - Peru (%)
Place of birth for the foreign-born population - Uruguay (%)
Place of birth for the foreign-born population - Venezuela (%)
Place of birth for the foreign-born population - Other South America (%)
Place of birth for the foreign-born population - Canada (%)
Place of birth for the foreign-born population - Other Northern America (%)
Place of birth for the foreign-born population - Other (%)
Latest news about races in Waimea, HI collected exclusively by city-data.com from local newspapers, TV, and radio stations
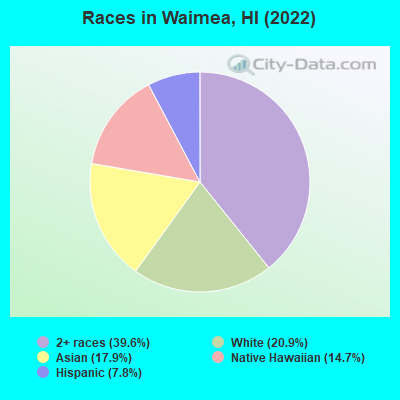
According to 2022 data, the most numerous races in Waimea, HI are Asian alone (1,913 residents), Two or more races (4,229 residents), and White alone (2,232 residents). 63.5% of Waimea residents speak English at home. 13.4% of Waimea, HI residents are foreign-born (9.6% born in Asia, 2.3% born in Europe), which is 34.7% less than the foreign-born rate of 18.0% across the entire state of Hawaii.
Race distribution in Waimea
2000 2022
494,149 40.8% Asian alone 277,091 22.9% White alone 218,700 18.1% Two or more races 108,441 9.0% Native Hawaiian and Other 87,699 7.2% Hispanic 20,829 1.7% Black alone 2,089 0.2% Other race alone 2,539 0.2% American Indian alone
498,125 34.6% Asian alone 318,574 22.1% Two or more races 297,937 20.7% White alone 160,103 11.1% Hispanic 134,567 9.3% Native Hawaiian and Other 23,682 1.6% Black alone 5,378 0.4% Other race alone 1,830 0.1% American Indian alone
Income and house value in Waimea Median household income in 2022 $110,456 White non-Hispanic householders$82,322 Asian householders$60,046 Native Hawaiian and other Pacific Islander householders$118,792 Two or more races householders$113,812 Hispanic or Latino race householdersMedian 2022 house value $869,301 White Non-Hispanic householders $718,787 Asian householders$588,918 Native Hawaiian and other Pacific Islander householders$721,039 Two or more races householders$639,214 Hispanic or Latino householders
Median age by race in Waimea
50.0 Median age for White residents48.6 51.7 -705,682,781.3 Median age for Black or African American residents-739,090,064.3 -646,651,269.6 -1,073,212,746.6 Median age for American Indian / Alaska Native residents-1,082,456,139.3 -1,051,217,463.3 50.7 Median age for Asian residents43.8 57.1 42.4 Median age for Native Hawaiian / Pacific Islander residents46.9 39.2 60.9 Median age for Other race residents-858,895,704.7 -661,246,611.8 31.5 Median age for Two or more races residents27.0 34.7 50.0 Median age for White alone residents48.5 51.4 40.0 Median age for Hispanic or Latino residents43.5 35.4
Owner/renter occupied households by race in Waimea
House owners and renters - White residents 652 75.4% Owner occupied213 24.6% Renter occupiedHouse owners and renters - Asian residents 615 80.2% Owner occupied152 19.8% Renter occupiedHouse owners and renters - Native Hawaiian / Pacific Islander residents 523 74.2% Owner occupied182 25.8% Renter occupiedHouse owners and renters - Other race residents 19 100.0% Owner occupiedHouse owners and renters - Two or more races residents 874 63.8% Owner occupied496 36.2% Renter occupiedHouse owners and renters - White alone residents 656 74.7% Owner occupied222 25.3% Renter occupiedHouse owners and renters - Hispanic or Latino residents 135 62.0% Owner occupied83 38.0% Renter occupied
Language usage in Waimea
English speakers - Total 63.5% of residents of Waimea speak English at home.
2.2% of residents speak Spanish at home 206 95.8% Speak English very well9 4.2% Speak English less than very well32.8% of residents speak other language at home 2,893 88.4% Speak English very well379 11.6% Speak English less than very well
English speakers - Born in the United States 78.2% of residents of Waimea speak English at home.
4.9% of residents speak Spanish at home 122 100.0% Speak English very well22.0% of residents speak other language at home 548 100.0% Speak English very well
English speakers - Native, born elsewhere 33.0% of residents of Waimea speak English at home.
100.0% of residents speak other language at home 91 100.0% Speak English very well
English speakers - Foreign-born 13.5% of residents of Waimea speak English at home.
8.5% of residents speak Spanish at home 107 91.5% Speak English very well10 8.5% Speak English less than very well79.8% of residents speak other language at home 769 70.1% Speak English very well328 29.9% Speak English less than very well
White (Caucasian) - Speak only English Native:
93.7% (1,694)Foreign-born:
27.8% (85)
White (Caucasian) - Speak another language Native:
6.2% (113)Foreign-born:
80.6% (245)
Asian - Speak only English Native:
71.5% (752)Foreign-born:
4.4% (32)
Asian - Speak another language Native:
21.9% (230)Foreign-born:
94.2% (680)
Native Hawaiian / Pacific Islander - Speak another language Native:
32.4% (508)Foreign-born:
96.7% (66)
Other race - Speak another language Native:
37.4% (8)Foreign-born:
77.7% (7)
Two or more races - Speak only English Native:
63.9% (2,808)Foreign-born:
20.3% (35)
Two or more races - Speak another language Native:
32.4% (1,426)Foreign-born:
79.0% (135)
White alone - Speak only English Native:
92.4% (1,698)Foreign-born:
27.9% (85)
White alone - Speak another language Native:
7.5% (137)Foreign-born:
81.4% (247)
Hispanic or Latino - Speak another language Native:
14.9% (103)Foreign-born:
70.4% (105)
Foreign-born residents in Waimea 1,426 residents are foreign born (9.6% Asia , 2.3% Europe ).
This city:
13.4%Hawaii:
18.0%
Marital status for residents in Waimea Marital status - White (Caucasian) population 15 years and over
Males 24.9% Never married55.8% Now married0.0% Separated0.0% Widowed19.3% DivorcedFemales 8.0% Never married58.6% Now married0.5% Separated5.2% Widowed27.8% DivorcedWomen who gave birth in the past 12 months Now married:
100.0% (43)Unmarried:
0.0% (0)
Women who did not give birth in the past 12 months Now married:
41.4% (167)Unmarried:
58.6% (236)
Marital status - Asian population 15 years and over
Males 31.6% Never married61.7% Now married0.0% Separated3.4% Widowed3.4% DivorcedFemales 27.8% Never married53.3% Now married0.8% Separated12.5% Widowed5.6% DivorcedWomen who gave birth in the past 12 months Now married:
77.8% (54)Unmarried:
22.2% (15)
Women who did not give birth in the past 12 months Now married:
40.3% (166)Unmarried:
59.7% (246)
Marital status - Native Hawaiian / Pacific Islander population 15 years and over
Males 36.3% Never married43.6% Now married0.0% Separated3.6% Widowed16.5% DivorcedFemales 38.4% Never married37.4% Now married0.8% Separated6.2% Widowed17.3% DivorcedWomen who did not give birth in the past 12 months Now married:
29.3% (104)Unmarried:
70.7% (252)
Marital status - Other race population 15 years and over
Males 0.0% Never married100.0% Now married0.0% Separated0.0% Widowed0.0% DivorcedFemales 50.0% Never married50.0% Now married0.0% Separated0.0% Widowed0.0% DivorcedWomen who did not give birth in the past 12 months Now married:
0.0% (0)Unmarried:
100.0% (8)
Marital status - Two or more races population 15 years and over
Males 36.6% Never married58.4% Now married0.5% Separated0.1% Widowed4.4% DivorcedFemales 38.6% Never married49.2% Now married0.8% Separated3.3% Widowed8.1% DivorcedWomen who gave birth in the past 12 months Now married:
98.3% (128)Unmarried:
1.7% (2)
Women who did not give birth in the past 12 months Now married:
39.3% (457)Unmarried:
60.7% (706)
Marital status - White alone, not Hispanic / Latino population 15 years and over
Males 22.9% Never married57.3% Now married0.0% Separated0.0% Widowed19.8% DivorcedFemales 8.0% Never married58.5% Now married0.5% Separated5.2% Widowed27.8% DivorcedWomen who gave birth in the past 12 months Now married:
100.0% (46)Unmarried:
0.0% (0)
Women who did not give birth in the past 12 months Now married:
41.3% (178)Unmarried:
58.7% (254)
Marital status - Hispanic or Latino population 15 years and over
Males 55.1% Never married44.6% Now married0.0% Separated0.0% Widowed0.3% DivorcedFemales 63.0% Never married35.4% Now married0.0% Separated0.8% Widowed0.8% DivorcedWomen who did not give birth in the past 12 months Now married:
15.9% (48)Unmarried:
84.1% (252)
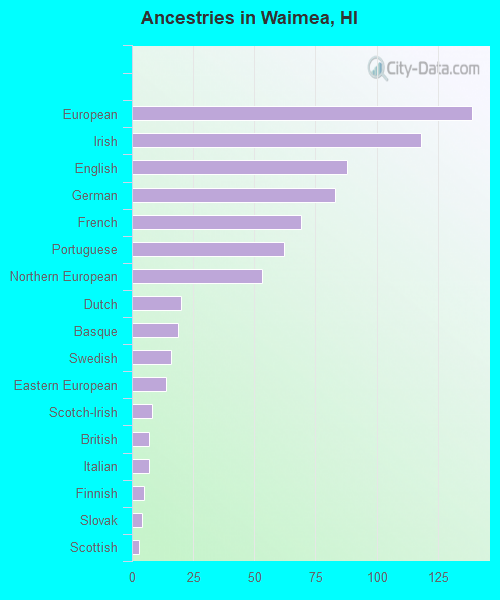
Ancestries in Waimea
139 3.0% European118 2.5% Irish88 1.9% English83 1.8% German69 1.5% French62 1.3% Portuguese53 1.1% Northern European20 0.4% Dutch19 0.4% Basque16 0.3% Swedish14 0.3% Eastern European8 0.2% Scotch-Irish7 0.2% British7 0.2% Italian5 0.1% Finnish4 0.09% Slovak3 0.06% Scottish1 0.02% Scandinavian
Children Nativity (place of birth) in Waimea
Children under 6 years - Living with two parents Both parents native 481 100.0% NativeOne native, one foreign-born parent 22 100.0% NativeChildren under 6 years - Living with one parent Native parent 94 100.0% NativeForeign-born parent 172 100.0% NativeChildren 6 to 17 years - Living with two parents Both parents native 1,101 100.0% NativeBoth parents foreign-born 153 64.8% Native83 35.2% Foreign-bornOne native, one foreign-born parent 27 100.0% NativeChildren 6 to 17 years - Living with one parent Native parent 437 100.0% NativeForeign-born parent 151 55.1% Native123 44.9% Foreign-born
Grandparents responsible for own grandchildren in Waimea
Grandparents (30 to 59 years) Asian 1 100.0% Not responsible for grandchildrenNative Hawaiian / Pacific Islander 2 100.0% Responsible for grandchildrenTwo or more races 3 32.2% Responsible for grandchildren7 67.8% Not responsible for grandchildrenHispanic or Latino 2 100.0% Responsible for grandchildrenGrandparents (60 years and over) Asian 72 100.0% Not responsible for grandchildrenNative Hawaiian / Pacific Islander 4 13.2% Responsible for grandchildren23 86.8% Not responsible for grandchildrenTwo or more races 4 2.3% Responsible for grandchildren181 97.7% Not responsible for grandchildrenHispanic or Latino 17 100.0% Not responsible for grandchildren