Estimated zip code population in 2022: 6,342 Zip code population in 2010: 5,814 Zip code population in 2000: 5,144
Houses and condos: 8,153 Renter-occupied apartments: 378
% of renters here:
12%
State:
37%
March 2022 cost of living index in zip code 97707: 94.9 (less than average, U.S. average is 100)
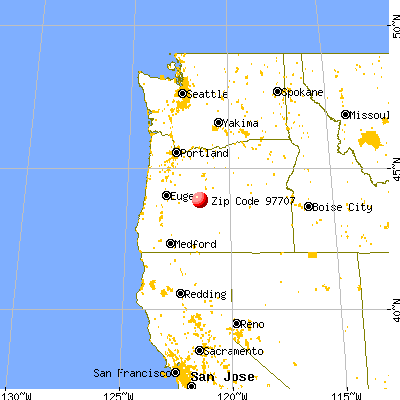
Land area: 58.4 sq. mi. Water area: 0.2 sq. mi.
Population density: 109 people per square mile
(very low).
OSM Map
General Map
Google Map
MSN Map
OSM Map
General Map
Google Map
MSN Map
OSM Map
General Map
Google Map
MSN Map
OSM Map
General Map
Google Map
MSN Map
Please wait while loading the map...
Real estate property taxes paid for housing units in 2022:
This zip code:
0.6% ($3,322)
Oregon:
0.8% ($3,646)
Median real estate property taxes paid for housing units with mortgages in 2022: $2,807 (0.6%) Median real estate property taxes paid for housing units with no mortgage in 2022: $4,524 (0.7%)
Business Search- 14 Million verified businesses
Males: 3,524
(55.6%)
Females: 2,818
(44.4%)
For population 25 years and over in 97707:
High school or higher: 97.7%
Bachelor's degree or higher: 51.7%
Graduate or professional degree: 18.4%
Unemployed: 5.7%
Mean travel time to work (commute): 24.0 minutes
For population 15 years and over in 97707:
Never married: 19.6%
Now married: 58.9%
Separated: 0.4%
Widowed: 4.3%
Divorced: 16.8%
Zip code 97707 compared to state average:
Black race population percentage significantly below state average.
Hispanic race population percentage significantly below state average.
Median age significantly above state average.
Foreign-born population percentage significantly below state average.
Renting percentage significantly below state average.
House age below state average.
Number of college students significantly below state average.
Percentage of population with a bachelor's degree or higher above state average.
Estimated median house/condo value in 2022: $552,825
97707:
$552,825
Oregon:
$475,600
According to our research of Oregon and other state lists, there were 2 registered sex offenders living in 97707 zip code as of June 02, 2024. The ratio of all residents to sex offenders in zip code 97707 is 3,240 to 1. The ratio of registered sex offenders to all residents in this zip code is lower than the state average.
Median resident age:
This zip code:
61.0 years
Oregon median age:
40.5 years
Average household size:
This zip code:
2.0 people
Oregon:
2.4 people
Averages for the 2020 tax year for zip code 97707, filed in 2021:
Average Adjusted Gross Income (AGI) in 2020: $105,900 (Individual Income Tax Returns)
Here:
$105,900
State:
$76,001
Salary/wage: $66,886 (reported on 67.7% of returns)
Here:
$66,886
State:
$61,959
(% of AGI for various income ranges: 1153.3% for AGIs below $25k, 3270.0% for AGIs $25k-50k, 6618.7% for AGIs $50k-75k, 8302.0% for AGIs $75k-100k, 15417.1% for AGIs $100k-200k, 75412.5% for AGIs over 200k)
Taxable interest for individuals: $2,895 (reported on 46.8% of returns)
This zip code:
$2,895
Oregon:
$1,628
(% of AGI for various income ranges: 28.9% for AGIs below $25k, 56.2% for AGIs $25k-50k, 153.3% for AGIs $50k-75k, 237.2% for AGIs $75k-100k, 315.9% for AGIs $100k-200k, 3406.2% for AGIs over 200k)
Ordinary dividends: $14,936 (reported on 31.8% of returns)
Here:
$14,936
State:
$7,165
(% of AGI for various income ranges: 91.2% for AGIs below $25k, 112.9% for AGIs $25k-50k, 315.3% for AGIs $50k-75k, 529.6% for AGIs $75k-100k, 856.5% for AGIs $100k-200k, 15433.8% for AGIs over 200k)
Net capital gain/loss in AGI: +$37,296 (reported on 30.5% of returns)
Here:
+$37,296
State:
+$23,403
(% of AGI for various income ranges: 15.3% for AGIs below $25k, 103.5% for AGIs $25k-50k, 326.7% for AGIs $50k-75k, 430.4% for AGIs $75k-100k, 1666.2% for AGIs $100k-200k, 45472.5% for AGIs over 200k)
Profit/loss from business: +$19,718 (reported on 19.6% of returns)
Here:
+$19,718
State:
+$16,511
(% of AGI for various income ranges: 134.4% for AGIs below $25k, 365.5% for AGIs $25k-50k, 532.7% for AGIs $50k-75k, 504.8% for AGIs $75k-100k, 794.4% for AGIs $100k-200k, 8557.5% for AGIs over 200k)
Taxable individual retirement arrangement distribution: $33,109 (reported on 18.8% of returns)
97707:
$33,109
Oregon:
$20,730
(% of AGI for various income ranges: 143.5% for AGIs below $25k, 189.8% for AGIs $25k-50k, 543.3% for AGIs $50k-75k, 882.4% for AGIs $75k-100k, 2817.1% for AGIs $100k-200k, 11531.2% for AGIs over 200k)
Self-employed (Keogh) retirement plans: $19,825 (reported on 1.0% of returns)
97707:
$19,825
Oregon:
$22,884
(% of AGI for various income ranges: 233.2% for AGIs $100k-200k)
Total itemized deductions: $34,874 (reported on 19.3% of returns)
Here:
$34,874
State:
$31,050
(% of AGI for various income ranges: 159.3% for AGIs below $25k, 336.9% for AGIs $25k-50k, 1028.7% for AGIs $50k-75k, 1231.2% for AGIs $75k-100k, 2244.1% for AGIs $100k-200k, 12436.2% for AGIs over 200k)
Charity contributions: $9,127 (reported on 15.8% of returns)
Here:
$9,127
State:
$8,791
(% of AGI for various income ranges: 6.3% for AGIs below $25k, 22.7% for AGIs $25k-50k, 84.7% for AGIs $50k-75k, 116.0% for AGIs $75k-100k, 380.6% for AGIs $100k-200k, 4575.0% for AGIs over 200k)
Taxes paid: $8,669 (reported on 19.1% of returns)
97707:
$8,669
State:
$8,487
(% of AGI for various income ranges: 30.4% for AGIs below $25k, 76.2% for AGIs $25k-50k, 207.0% for AGIs $50k-75k, 380.4% for AGIs $75k-100k, 681.8% for AGIs $100k-200k, 2525.0% for AGIs over 200k)
Earned income credit: $1,709 (reported on 8.9% of returns)
Here:
$1,709
State:
$1,977
(% of AGI for various income ranges: 61.9% for AGIs below $25k, 44.5% for AGIs $25k-50k)
Percentage of individuals using paid preparers for their 2020 taxes: 93.1%
Here:
93%
State:
93%
(% for various income ranges: 91.4% for AGIs below $25k, 92.6% for AGIs $25k-50k, 92.9% for AGIs $50k-75k, 93.6% for AGIs $75k-100k, 94.9% for AGIs $100k-200k, 94.7% for AGIs over 200k)
Averages for the 2012 tax year for zip code 97707, filed in 2013:
Average Adjusted Gross Income (AGI) in 2012: $71,748 (Individual Income Tax Returns)
Here:
$71,748
State:
$57,845
Salary/wage: $43,609 (reported on 68.1% of returns)
Here:
$43,609
State:
$47,723
(% of AGI for various income ranges: 64.3% for AGIs below $25k, 61.8% for AGIs $25k-50k, 52.2% for AGIs $50k-75k, 41.3% for AGIs $75k-100k, 43.9% for AGIs $100k-200k, 24.3% for AGIs over 200k)
Taxable interest for individuals: $3,403 (reported on 42.6% of returns)
This zip code:
$3,403
Oregon:
$1,848
(% of AGI for various income ranges: 2.9% for AGIs below $25k, 2.0% for AGIs $25k-50k, 1.1% for AGIs $50k-75k, 0.8% for AGIs $75k-100k, 1.9% for AGIs $100k-200k, 2.8% for AGIs over 200k)
Ordinary dividends: $11,883 (reported on 30.8% of returns)
Here:
$11,883
State:
$5,987
(% of AGI for various income ranges: 4.5% for AGIs below $25k, 2.4% for AGIs $25k-50k, 4.5% for AGIs $50k-75k, 3.6% for AGIs $75k-100k, 4.0% for AGIs $100k-200k, 7.8% for AGIs over 200k)
Net capital gain/loss in AGI: +$27,858 (reported on 28.9% of returns)
Here:
+$27,858
State:
+$13,095
(% of AGI for various income ranges: 0.3% for AGIs $25k-50k, 0.6% for AGIs $50k-75k, 1.5% for AGIs $75k-100k, 4.7% for AGIs $100k-200k, 30.3% for AGIs over 200k)
Profit/loss from business: +$12,623 (reported on 19.8% of returns)
Here:
+$12,623
State:
+$13,871
(% of AGI for various income ranges: 8.2% for AGIs below $25k, 4.6% for AGIs $25k-50k, 3.7% for AGIs $50k-75k, 4.1% for AGIs $75k-100k, 2.6% for AGIs $100k-200k, 2.6% for AGIs over 200k)
Taxable individual retirement arrangement distribution: $26,922 (reported on 22.4% of returns)
97707:
$26,922
Oregon:
$16,036
(% of AGI for various income ranges: 5.6% for AGIs below $25k, 7.4% for AGIs $25k-50k, 6.5% for AGIs $50k-75k, 10.0% for AGIs $75k-100k, 10.2% for AGIs $100k-200k, 7.9% for AGIs over 200k)
Total itemized deductions: $29,489 (27% of AGI, reported on 52.1% of returns)
Here:
$29,489
State:
$24,430
Here:
26.6% of AGI
State:
23.2% of AGI
(% of AGI for various income ranges: 26.7% for AGIs below $25k, 21.7% for AGIs $25k-50k, 20.6% for AGIs $50k-75k, 20.7% for AGIs $75k-100k, 22.1% for AGIs $100k-200k, 20.4% for AGIs over 200k)
Charity contributions: $3,614 (reported on 44.1% of returns)
Here:
$3,614
State:
$3,648
(% of AGI for various income ranges: 1.8% for AGIs below $25k, 1.9% for AGIs $25k-50k, 2.2% for AGIs $50k-75k, 2.4% for AGIs $75k-100k, 2.7% for AGIs $100k-200k, 2.0% for AGIs over 200k)
Taxes paid: $12,199 (reported on 51.7% of returns)
97707:
$12,199
State:
$10,269
(% of AGI for various income ranges: 4.6% for AGIs below $25k, 6.0% for AGIs $25k-50k, 6.6% for AGIs $50k-75k, 7.3% for AGIs $75k-100k, 8.9% for AGIs $100k-200k, 11.9% for AGIs over 200k)
Earned income credit: $1,921 (reported on 14.4% of returns)
Here:
$1,921
State:
$2,021
(% of AGI for various income ranges: 4.6% for AGIs below $25k, 1.0% for AGIs $25k-50k)
Percentage of individuals using paid preparers for their 2012 taxes: 55.1%
Here:
55%
State:
47%
(% for various income ranges: 44.7% for AGIs below $25k, 53.7% for AGIs $25k-50k, 59.5% for AGIs $50k-75k, 62.1% for AGIs $75k-100k, 67.6% for AGIs $100k-200k, 75.0% for AGIs over 200k)
Averages for the 2004 tax year for zip code 97707, filed in 2005:
Average Adjusted Gross Income (AGI) in 2004: $59,806 (Individual Income Tax Returns)
Here:
$59,806
State:
$46,788
Salary/wage: $37,428 (reported on 72.5% of returns)
Here:
$37,428
State:
$39,788
(% of AGI for various income ranges: 112.3% for AGIs below $10k, 65.2% for AGIs $10k-25k, 66.4% for AGIs $25k-50k, 57.8% for AGIs $50k-75k, 49.4% for AGIs $75k-100k, 30.5% for AGIs over 100k)
Taxable interest for individuals: $3,463 (reported on 50.7% of returns)
This zip code:
$3,463
Oregon:
$2,126
(% of AGI for various income ranges: 7.8% for AGIs below $10k, 3.6% for AGIs $10k-25k, 2.1% for AGIs $25k-50k, 2.8% for AGIs $50k-75k, 2.4% for AGIs $75k-100k, 3.2% for AGIs over 100k)
Taxable dividends: $6,788 (reported on 35.0% of returns)
Here:
$6,788
State:
$3,427
(% of AGI for various income ranges: 13.6% for AGIs below $10k, 2.0% for AGIs $10k-25k, 2.3% for AGIs $25k-50k, 3.2% for AGIs $50k-75k, 3.7% for AGIs $75k-100k, 4.8% for AGIs over 100k)
Net capital gain/loss: +$22,125 (reported on 33.3% of returns)
Here:
+$22,125
State:
+$12,447
(% of AGI for various income ranges: -3.7% for AGIs below $10k, 1.2% for AGIs $10k-25k, 1.5% for AGIs $25k-50k, 1.6% for AGIs $50k-75k, 4.9% for AGIs $75k-100k, 22.4% for AGIs over 100k)
Profit/loss from business: +$16,230 (reported on 22.1% of returns)
Here:
+$16,230
State:
+$11,682
(% of AGI for various income ranges: 7.5% for AGIs below $10k, 9.7% for AGIs $10k-25k, 6.6% for AGIs $25k-50k, 3.3% for AGIs $50k-75k, 6.4% for AGIs $75k-100k, 6.0% for AGIs over 100k)
IRA payment deduction: $3,589 (reported on 4.6% of returns)
97707:
$3,589
Oregon:
$3,035
(% of AGI for various income ranges: 0.4% for AGIs $10k-25k, 0.6% for AGIs $25k-50k, 0.3% for AGIs $50k-75k, 0.4% for AGIs $75k-100k, 0.2% for AGIs over 100k)
Self-employed pension: $28,378 (reported on 1.4% of returns)
Here:
$28,378
Oregon:
$14,224
Total itemized deductions: $22,461 (25% of AGI, reported on 55.3% of returns)
Here:
$22,461
State:
$20,209
Here:
24.9% of AGI
State:
24.7% of AGI
(% of AGI for various income ranges: 51.8% for AGIs below $10k, 21.5% for AGIs $10k-25k, 24.4% for AGIs $25k-50k, 25.4% for AGIs $50k-75k, 22.8% for AGIs $75k-100k, 17.1% for AGIs over 100k)
Charity contributions deductions: $3,237 (3% of AGI, reported on 47.1% of returns)
Here:
$3,237
State:
$3,145
Here:
3.3% of AGI
State:
3.6% of AGI
(% of AGI for various income ranges: 1.8% for AGIs below $10k, 1.7% for AGIs $10k-25k, 2.3% for AGIs $25k-50k, 2.6% for AGIs $50k-75k, 2.8% for AGIs $75k-100k, 2.7% for AGIs over 100k)
Total tax: $9,962 (reported on 77.3% of returns)
97707:
$9,962
State:
$7,148
(% of AGI for various income ranges: 4.1% for AGIs below $10k, 4.6% for AGIs $10k-25k, 6.1% for AGIs $25k-50k, 8.0% for AGIs $50k-75k, 10.1% for AGIs $75k-100k, 18.3% for AGIs over 100k)
Earned income credit: $1,712 (reported on 12.3% of returns)
Here:
$1,712
State:
$1,605
Percentage of individuals using paid preparers for their 2004 taxes: 61.6%
Here:
62%
State:
53%
(% for various income ranges: 51.0% for AGIs below $10k, 57.4% for AGIs $10k-25k, 59.8% for AGIs $25k-50k, 65.9% for AGIs $50k-75k, 64.1% for AGIs $75k-100k, 79.4% for AGIs over 100k)
Household received Food Stamps/SNAP in the past 12 months: 143 Household did not receive Food Stamps/SNAP in the past 12 months: 2,964
Women who had a birth in the past 12 months: 7 (7 now married, 0 unmarried) Women who did not have a birth in the past 12 months: 857 (494 now married, 353 unmarried)
Housing units in zip code 97707 with a mortgage: 1,506 (102 second mortgage, 36 both second mortgage and home equity loan) Houses without a mortgage: 12
Median monthly owner costs for units with a mortgage: $1,812 Median monthly owner costs for units without a mortgage: $657
Residents with income below the poverty level in 2022:
This zip code:
7.2%
Whole state:
12.1%
Residents with income below 50% of the poverty level in 2022:
This zip code:
2.1%
Whole state:
6.2%
Median number of rooms in houses and condos:
Here:
5.6
State:
6.2
Median number of rooms in apartments:
Here:
4.9
State:
4.0
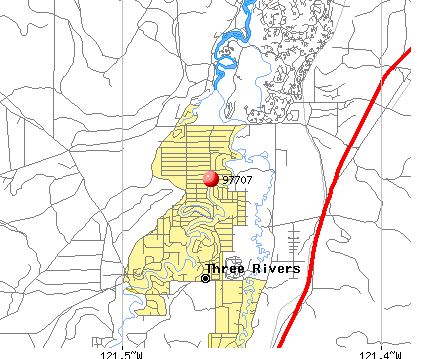
Notable locations in this zip code not listed on our city pages
Notable locations in zip code 97707: Bates Ranch (A), Besson Boating Site (B), Foster Ranch (C), Fall River Lodge (D), Fall River Guard Station (E), Fall River Recreation Site (F), Lava River Cave Recreation Site (G), Fall River Trailhead (H), Meadows Golf Course (I), Crosswater Golf Course (J), Fall River Fish Hatchery (K), Besson Camp Recreation Site (L), Big River Campground Boat Ramp (M), Besson Day Use Boat Launch (N), Harpers Bridge Boat Launch (O), Montgomery Ranch (P), Sunriver Resort Marina Boat Launch (Q), Sunriver Aquatic and Recreation Center Amphitheatre (R), Oregon Water Wonderland Unit II Sanitary District Lagoon (S), Sunriver Environmental (T). Display/hide their locations on the map
519 married couples with children.
58 single-parent households (58 women).
98.3% of residents of 97707 zip code speak English at home.
1.3% of residents speak Spanish at home (100% very well).
0.6% of residents speak other Indo-European language at home (50% very well, 42% well, 8% not well).
0.7% of residents speak Asian or Pacific Island language at home (37% very well, 63% well).
Foreign born population: 147 (2.3%) (83.8% of them are naturalized citizens)
This zip code:
2.3%
Whole state:
9.9%
21%Sweden
21%United Kingdom, excluding England and Scotland
16%Serbia
13%Japan
11%Malaysia
5%France
5%Germany
26%German
17%English
8%American
7%Irish
7%Italian
4%Norwegian
3%European
Year of entry for the foreign-born population
272010 or later
02000 to 2009
251990 to 1999
125Before 1990
Facilities with environmental interests located in this zip code:
CROSSROAD STATION (56896 VENTURE LANE in SUNRIVER, OR)
ENFORCEMENT/COMPLIANCE ACTIVITY (Integrated Compliance Information System) STATE MASTER (Oregon inspections and permits database) - OR-UST-BDGGB, LEAKING STORAGE TANK, OR-UST-BDGGC, OR-UST-BDGGD, OR-UST-BDGGE,
CENTRAL OREGON ENGINE EXCHANGE (17030 BAKERSFIELD ROAD in SUNRIVER, OR)
(Resource Conservation and Recovery Act (tracking hazardous waste))
CORNERSTONE PROPERTY MANAGEMENT (2100 W WYATT #204 in BEND, OR)
COMPLIANCE ACTIVITY (Tracking inspections of insecticide, fungicide, and rodenticide, and toxic substances)
Housing units lacking complete kitchen facilities: 0.5%
53.3%Electricity
23.7%Utility gas
17.3%Wood
4.2%Bottled, tank, or LP gas
0.9%Fuel oil, kerosene, etc.
Population in 1990: 2,881. Population change in the 1990s: +2,263 (+78.5%).
Place of birth for U.S.-born residents:
This state: 2,113
Northeast: 389
Midwest: 723
South: 654
West: 2,280
40% of the 97707 zip code residents lived in the same house 5 years ago. Out of people who lived in different houses, 27% lived in this county. Out of people who lived in different counties, 50% lived in Oregon.
92% of the 97707 zip code residents lived in the same house 1 year ago. Out of people who lived in different houses, 38% moved from this county. Out of people who lived in different houses, 30% moved from different county within same state. Out of people who lived in different houses, 34% moved from different state. Out of people who lived in different houses, 3% moved from abroad.
Private vs. public school enrollment:
Students in private schools in grades 1 to 8 (elementary and middle school):
Here:
0.0%
Oregon:
13.7%
Students in private schools in grades 9 to 12 (high school):
Here:
0.0%
Oregon:
8.8%
Students in private undergraduate colleges:
Here:
0.0%
Oregon:
17.7%
Occupation by median earnings in the past 12 months ($)
160,513Architecture and engineering occupations
85,526Computer and mathematical occupations
84,631Health diagnosing and treating practitioners and other technical occupations
77,920Management occupations
73,957Installation, maintenance, and repair occupations
68,888Production occupations
Companies with federal contracts located in this zip code:
RODNEY A JIPP (2 OCHOCO LANE in SUNRIVER, OR; small business)
$11,778 with Navy for ADP Support Equipment. Signed on 2005-01-31. Completion date: 2005-03-02.
Top industries in this zip code by the number of employees in 2005:
Accommodation and Food Services: Hotels (except Casino Hotels) and Motels (500-999 employees: 1 establishment)
Construction: All Other Specialty Trade Contractors (20-49: 1, 5-9: 1)
Other Services (except Public Administration): Other Similar Organizations (except Business, Professional, Labor, and Political Organizations) (20-49: 1, 1-4: 3)
People in group quarters in 2010:
5 people in group homes intended for adults
Fatal accident statistics in 2012:
Fatal accident count: 1
Vehicles involved in fatal accidents: 2
Fatal accidents caused by drunken drivers: 0
Fatalities: 1
Persons involved in fatal accidents: 3
Pedestrians involved in fatal accidents: 0
Fatal accident statistics in 2011:
Fatal accident count: 2
Vehicles involved in fatal accidents: 2
Fatal accidents caused by drunken drivers: 0
Fatalities: 2
Persons involved in fatal accidents: 2
Pedestrians involved in fatal accidents: 0
Home Mortgage Disclosure Act Aggregated Statistics For Year 2009 (Based on 4 partial tracts)
A) FHA, FSA/RHS & VA Home Purchase Loans
B) Conventional Home Purchase Loans
C) Refinancings
D) Home Improvement Loans
F) Non-occupant Loans on < 5 Family Dwellings (A B C & D)
G) Loans On Manufactured Home Dwelling (A B C & D)
Number
Average Value
Number
Average Value
Number
Average Value
Number
Average Value
Number
Average Value
Number
Average Value
LOANS ORIGINATED
65
$147,876
143
$251,523
501
$231,466
13
$129,464
337
$270,608
64
$125,114
APPLICATIONS APPROVED, NOT ACCEPTED
6
$143,875
17
$243,114
59
$209,993
2
$57,920
31
$238,657
15
$126,515
APPLICATIONS DENIED
22
$154,235
26
$204,995
252
$224,376
15
$111,490
93
$275,457
54
$136,854
APPLICATIONS WITHDRAWN
16
$139,659
21
$204,654
127
$225,593
6
$219,463
42
$292,451
32
$119,598
FILES CLOSED FOR INCOMPLETENESS
2
$132,495
6
$205,835
23
$200,368
1
$309,570
10
$250,127
7
$113,289
Aggregated Statistics For Year 2008 (Based on 4 partial tracts)
A) FHA, FSA/RHS & VA Home Purchase Loans
B) Conventional Home Purchase Loans
C) Refinancings
D) Home Improvement Loans
E) Loans on Dwellings For 5+ Families
F) Non-occupant Loans on < 5 Family Dwellings (A B C & D)
G) Loans On Manufactured Home Dwelling (A B C & D)
Number
Average Value
Number
Average Value
Number
Average Value
Number
Average Value
Number
Average Value
Number
Average Value
Number
Average Value
LOANS ORIGINATED
37
$173,594
139
$296,663
360
$236,651
41
$130,683
0
$0
193
$324,254
103
$139,137
APPLICATIONS APPROVED, NOT ACCEPTED
3
$143,857
17
$331,035
71
$222,215
9
$148,513
0
$0
25
$320,670
19
$143,188
APPLICATIONS DENIED
20
$141,128
37
$274,406
275
$209,204
39
$109,505
0
$0
50
$308,820
102
$139,749
APPLICATIONS WITHDRAWN
8
$184,658
28
$269,478
133
$219,454
14
$104,195
1
$635,400
29
$286,601
39
$159,501
FILES CLOSED FOR INCOMPLETENESS
4
$204,162
1
$569,690
27
$239,109
1
$33,120
0
$0
4
$348,305
6
$118,775
Aggregated Statistics For Year 2007 (Based on 4 partial tracts)
A) FHA, FSA/RHS & VA Home Purchase Loans
B) Conventional Home Purchase Loans
C) Refinancings
D) Home Improvement Loans
E) Loans on Dwellings For 5+ Families
F) Non-occupant Loans on < 5 Family Dwellings (A B C & D)
G) Loans On Manufactured Home Dwelling (A B C & D)
Number
Average Value
Number
Average Value
Number
Average Value
Number
Average Value
Number
Average Value
Number
Average Value
Number
Average Value
LOANS ORIGINATED
20
$184,924
324
$276,259
591
$234,857
91
$112,482
0
$0
328
$295,407
185
$140,495
APPLICATIONS APPROVED, NOT ACCEPTED
1
$144,290
44
$275,965
89
$235,453
10
$113,756
0
$0
47
$314,454
22
$140,826
APPLICATIONS DENIED
7
$178,320
67
$289,779
303
$235,228
82
$112,848
1
$187,390
72
$355,263
117
$132,258
APPLICATIONS WITHDRAWN
4
$211,832
32
$275,334
154
$213,450
32
$131,086
1
$227,140
39
$284,894
50
$138,209
FILES CLOSED FOR INCOMPLETENESS
0
$0
3
$183,593
62
$210,462
2
$72,770
0
$0
10
$281,156
21
$157,549
Aggregated Statistics For Year 2006 (Based on 4 partial tracts)
A) FHA, FSA/RHS & VA Home Purchase Loans
B) Conventional Home Purchase Loans
C) Refinancings
D) Home Improvement Loans
F) Non-occupant Loans on < 5 Family Dwellings (A B C & D)
G) Loans On Manufactured Home Dwelling (A B C & D)
Number
Average Value
Number
Average Value
Number
Average Value
Number
Average Value
Number
Average Value
Number
Average Value
LOANS ORIGINATED
19
$163,553
558
$230,763
708
$216,114
102
$113,051
413
$278,480
211
$130,752
APPLICATIONS APPROVED, NOT ACCEPTED
3
$126,187
85
$231,065
98
$208,529
11
$55,930
52
$302,495
33
$117,715
APPLICATIONS DENIED
4
$135,852
96
$215,818
285
$183,883
76
$95,777
64
$255,702
120
$116,842
APPLICATIONS WITHDRAWN
4
$145,775
43
$184,014
209
$196,527
32
$114,928
48
$262,937
45
$116,921
FILES CLOSED FOR INCOMPLETENESS
0
$0
10
$238,074
62
$167,180
3
$147,900
11
$246,605
13
$139,940
Aggregated Statistics For Year 2005 (Based on 4 partial tracts)
A) FHA, FSA/RHS & VA Home Purchase Loans
B) Conventional Home Purchase Loans
C) Refinancings
D) Home Improvement Loans
F) Non-occupant Loans on < 5 Family Dwellings (A B C & D)
G) Loans On Manufactured Home Dwelling (A B C & D)
Number
Average Value
Number
Average Value
Number
Average Value
Number
Average Value
Number
Average Value
Number
Average Value
LOANS ORIGINATED
31
$156,300
754
$196,573
628
$175,987
57
$120,612
504
$235,918
211
$109,671
APPLICATIONS APPROVED, NOT ACCEPTED
3
$118,243
77
$193,946
86
$183,939
9
$206,770
43
$291,440
23
$103,299
APPLICATIONS DENIED
17
$107,789
140
$160,332
351
$146,929
53
$64,000
56
$214,738
171
$103,114
APPLICATIONS WITHDRAWN
2
$197,800
67
$204,917
205
$150,713
27
$114,434
43
$211,020
46
$115,663
FILES CLOSED FOR INCOMPLETENESS
2
$116,880
13
$180,562
49
$179,857
2
$25,775
9
$200,674
9
$112,610
Aggregated Statistics For Year 2004 (Based on 4 partial tracts)
A) FHA, FSA/RHS & VA Home Purchase Loans
B) Conventional Home Purchase Loans
C) Refinancings
D) Home Improvement Loans
F) Non-occupant Loans on < 5 Family Dwellings (A B C & D)
G) Loans On Manufactured Home Dwelling (A B C & D)
Detailed PMIC statistics for the following Tracts:9904.00
, 9905.00
2002 - 2018 National Fire Incident Reporting System (NFIRS) incidents
Based on the data from the years 2002 - 2018 the average number of fires per year is 30. The highest number of reported fires - 55 took place in 2002, and the least - 1 in 2017. The data has a dropping trend.
When looking into fire subcategories, the most reports belonged to: Outside Fires (51.0%), and Structure Fires (32.3%).
Fire incident types reported to NFIRS in Zip Code 97707


 Nearest zip codes: 97739, 97702, 97701, 97737, 97756, 97760.


 Based on the data from the years 2002 - 2018 the average number of fires per year is 30. The highest number of reported fires - 55 took place in 2002, and the least - 1 in 2017. The data has a dropping trend.
 When looking into fire subcategories, the most reports belonged to: Outside Fires (51.0%), and Structure Fires (32.3%).