Fatal car crashes and road traffic accidents in Ocala, Florida
- Fatal car crash and road traffic accident statistics for 2021
- Fatal accident count18
- Vehicles involved in fatal accidents28
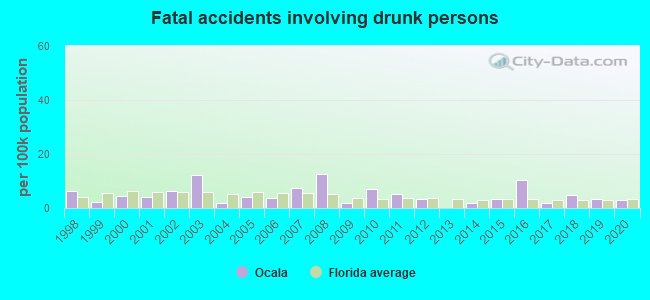
- Fatal accidents involving drunk persons0
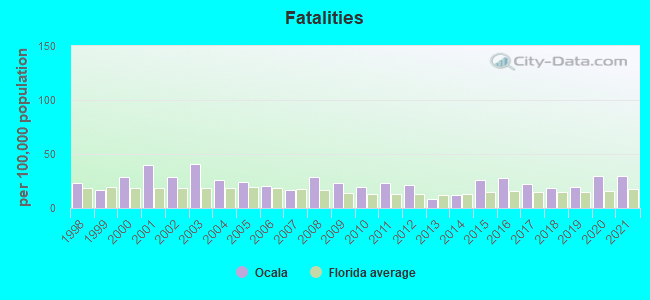
- Fatalities19
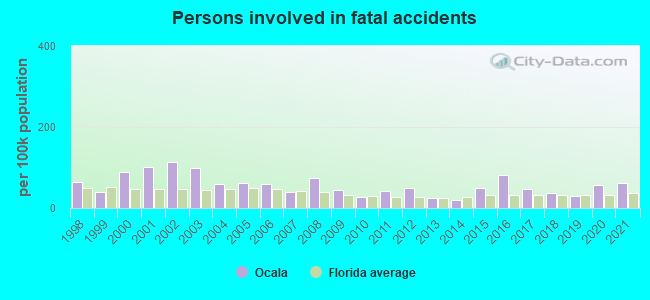
- Persons involved in fatal accidents39
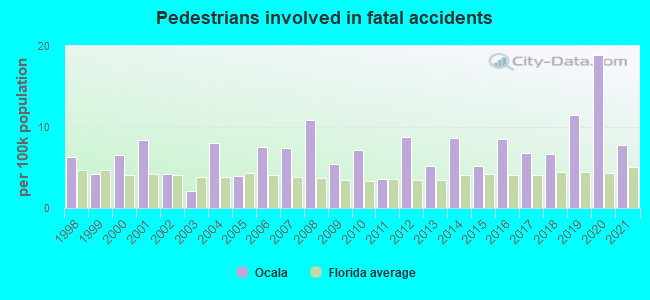
- Pedestrians involved in fatal accidents5
- Fatal car crash and road traffic accident statistics for 2020
- Fatal accident count19
- Vehicles involved in fatal accidents26
- Fatal accidents involving drunk persons2
- Fatalities19
- Persons involved in fatal accidents37
- Pedestrians involved in fatal accidents12
- Fatal car crash and road traffic accident statistics for 2019
- Fatal accident count11
- Vehicles involved in fatal accidents16
- Fatal accidents involving drunk persons2
- Fatalities12
- Persons involved in fatal accidents18
- Pedestrians involved in fatal accidents7
- Fatal car crash and road traffic accident statistics for 2018
- Fatal accident count9
- Vehicles involved in fatal accidents14
- Fatal accidents involving drunk persons3
- Fatalities11
- Persons involved in fatal accidents22
- Pedestrians involved in fatal accidents4
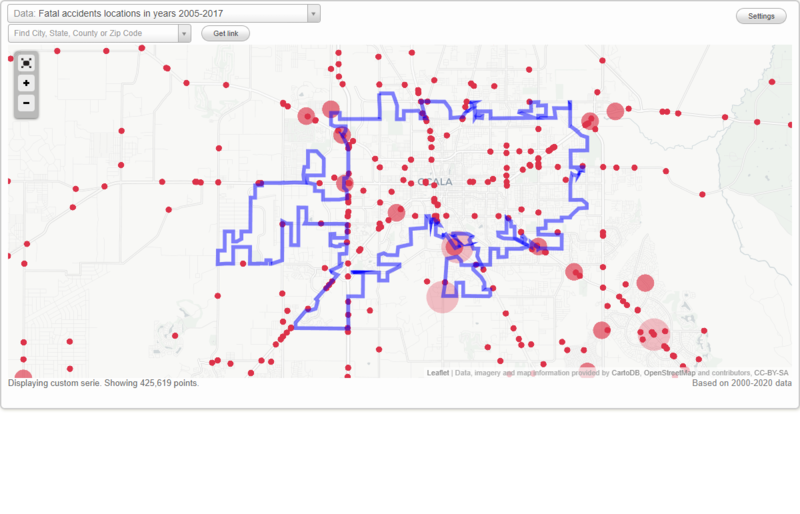
Data:
Latest news about accidents in Ocala, FL collected exclusively by city-data.com from local newspapers, TV, and radio stations
No street view available for this location
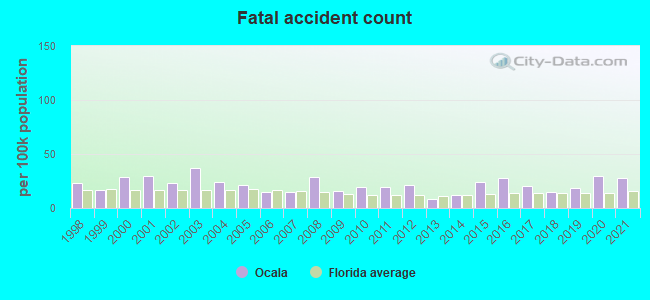
Ocala fatal accident statistics for 1998 - 2021
Average EMS response time
- Ocala(Based on 268 reports) 6.1 mins
- Marion County(Based on 1,606 reports) 9.5 mins
- Florida(Based on 60,636 reports) 7.4 mins
Average hospital transport time
- Ocala(Based on 7 reports) 187.7 mins
- Marion County(Based on 71 reports) 159.0 mins
- Florida(Based on 3,206 reports) 142.4 mins
Daylight
- Ocala(Based on 550 reports) 45.8%
- Marion County(Based on 2,960 reports) 45.2%
- Florida(Based on 120,166 reports) 41.9%
Dark - Lighted
- Ocala(Based on 550 reports) 30.0%
- Marion County(Based on 2,960 reports) 9.3%
- Florida(Based on 120,166 reports) 24.8%
Dark - Not Lighted
- Ocala(Based on 550 reports) 20.5%
- Marion County(Based on 2,960 reports) 41.0%
- Florida(Based on 120,166 reports) 29.0%
Dusk
- Ocala(Based on 550 reports) 2.2%
- Marion County(Based on 2,960 reports) 2.8%
- Florida(Based on 120,166 reports) 2.3%
Dawn
- Ocala(Based on 550 reports) 1.3%
- Marion County(Based on 2,960 reports) 1.6%
- Florida(Based on 120,166 reports) 1.7%
Dark - Unknown Lighting
- Ocala(Based on 550 reports) 0.2%
- Marion County(Based on 2,960 reports) 0.2%
- Florida(Based on 120,166 reports) 0.4%
Clear
- Ocala(Based on 551 reports) 84.2%
- Marion County(Based on 2,965 reports) 83.0%
- Florida(Based on 120,566 reports) 85.7%
Rain
- Ocala(Based on 551 reports) 7.6%
- Marion County(Based on 2,965 reports) 6.9%
- Florida(Based on 120,566 reports) 7.5%
Unknown
- Ocala(Based on 551 reports) 5.8%
- Marion County(Based on 2,965 reports) 6.3%
- Florida(Based on 120,566 reports) 4.6%
Fog, Smog, Smoke
- Ocala(Based on 551 reports) 2.0%
- Marion County(Based on 2,965 reports) 3.1%
- Florida(Based on 120,566 reports) 1.3%
Cloudy
- Ocala(Based on 551 reports) 0.4%
- Marion County(Based on 2,965 reports) 0.3%
- Florida(Based on 120,566 reports) 0.6%

Ocala fatal car crash and road traffic accident list for 2021
- Fatal accident count18
- Vehicles involved in fatal accidents28
- Fatalities19
- Persons involved in fatal accidents39
- Pedestrians involved in fatal accidents5
Daylight
- Ocala(Based on 18 reports) 55.6%
- Marion County(Based on 83 reports) 47.0%
- Florida(Based on 3,446 reports) 39.8%
Dark - Lighted
- Ocala(Based on 18 reports) 33.3%
- Marion County(Based on 83 reports) 13.3%
- Florida(Based on 3,446 reports) 31.5%
Dusk
- Ocala(Based on 18 reports) 5.6%
- Marion County(Based on 83 reports) 4.8%
- Florida(Based on 3,446 reports) 2.6%
Dawn
- Ocala(Based on 18 reports) 5.6%
- Marion County(Based on 83 reports) 1.2%
- Florida(Based on 3,446 reports) 1.9%
Clear
- Ocala(Based on 18 reports) 77.8%
- Marion County(Based on 84 reports) 65.5%
- Florida(Based on 3,450 reports) 77.4%
Unknown
- Ocala(Based on 18 reports) 22.2%
- Marion County(Based on 84 reports) 23.8%
- Florida(Based on 3,450 reports) 14.8%
| # | Date | Location | Vehicles | Drunk persons | Fatalites | Persons | Pedestrians |
|---|
| 1 | Jan 19, 2021 08:27 PM | I-75 | 2 | - | 2
| 4 | - |
| 2 | Jan 27, 2021 10:30 AM | Us-27, Sw Broadway St | 1 | - | 1
| 1 | 1 |
| 3 | Feb 25, 2021 01:30 PM | Us-301, Cr-200a | 2 | - | 1
| 2 | - |
| 4 | Apr 19, 2021 06:17 PM | 42nd St | 1 | - | 1
| 1 | - |
| 5 | May 1, 2021 12:58 AM | Sr-40, 33rd Ave | 2 | - | 1
| 3 | - |
| 6 | May 28, 2021 12:09 AM | Southeast 36th Avenue, Southeast 31st Street | 2 | - | 1
| 3 | - |
| 7 | May 15, 2021 08:35 PM | Us-301 | 1 | - | 1
| 1 | - |
| 8 | Jun 25, 2021 10:16 PM | Us-441 | 1 | - | 1
| 1 | 1 |
| 9 | May 23, 2021 10:20 AM | Nw 35th Ave Rd | 2 | - | 1
| 3 | - |
| 10 | Jul 2, 2021 07:00 PM | Sr-40, 12th Terr | 2 | - | 1
| 2 | - |
| 11 | Jul 20, 2021 09:40 PM | Ne 3rd St, Ne 10th Ave | 2 | - | 1
| 3 | - |
| 12 | Aug 5, 2021 09:05 PM | Sr-40 | 1 | - | 1
| 1 | 1 |
| 13 | Oct 12, 2021 06:56 PM | Sr- 200 | 3 | - | 1
| 5 | - |
| 14 | Nov 13, 2021 03:07 PM | Se 31st St | 1 | - | 1
| 1 | - |
| 15 | Sep 16, 2021 05:10 PM | Sr-464, Sw 16th Ave | 1 | - | 1
| 4 | 1 |
| 16 | Sep 24, 2021 07:02 AM | Sw 48th Avenue | 1 | - | 1
| 1 | - |
| 17 | Sep 30, 2021 09:28 AM | Us-441, Nw 35th St | 1 | - | 1
| 1 | 1 |
| 18 | Dec 1, 2021 06:07 PM | Us-441, Sr 200 | 2 | - | 1
| 2 | - |
Ocala fatal car crash and road traffic accident list for 2020
- Fatal accident count19
- Vehicles involved in fatal accidents26
- Fatal accidents involving drunk persons2
- Fatalities19
- Persons involved in fatal accidents37
- Pedestrians involved in fatal accidents12
Daylight
- Ocala(Based on 19 reports) 42.1%
- Marion County(Based on 93 reports) 47.3%
- Florida(Based on 3,091 reports) 39.8%
Dark - Not Lighted
- Ocala(Based on 19 reports) 26.3%
- Marion County(Based on 93 reports) 40.9%
- Florida(Based on 3,091 reports) 24.0%
Dark - Lighted
- Ocala(Based on 19 reports) 21.1%
- Marion County(Based on 93 reports) 5.4%
- Florida(Based on 3,091 reports) 30.0%
Dusk
- Ocala(Based on 19 reports) 5.3%
- Marion County(Based on 93 reports) 3.2%
- Florida(Based on 3,091 reports) 3.8%
Dark - Unknown Lighting
- Ocala(Based on 19 reports) 5.3%
- Marion County(Based on 93 reports) 1.1%
- Florida(Based on 3,091 reports) 0.7%
Clear
- Ocala(Based on 19 reports) 84.2%
- Marion County(Based on 93 reports) 71.0%
- Florida(Based on 3,089 reports) 76.6%
Unknown
- Ocala(Based on 19 reports) 10.5%
- Marion County(Based on 93 reports) 20.4%
- Florida(Based on 3,089 reports) 15.3%
Rain
- Ocala(Based on 19 reports) 5.3%
- Marion County(Based on 93 reports) 6.5%
- Florida(Based on 3,089 reports) 7.2%
| # | Date | Location | Vehicles | Drunk persons | Fatalites | Persons | Pedestrians |
|---|
| 1 | Feb 28, 2020 00:23 AM | Sr-200 | 2 | - | 1
| 2 | 1 |
| 2 | Mar 12, 2020 07:20 AM | I-75 | 3 | - | 1
| 3 | - |
| 3 | Apr 10, 2020 11:50 PM | Sr-40, Nw 27th Ave | 1 | - | 1
| 1 | 1 |
| 4 | May 4, 2020 09:13 PM | Sr-200, 46th Ct | 1 | - | 1
| 1 | 1 |
| 5 | Apr 26, 2020 02:00 AM | 28th St, 18th Ave | 1 | 1
| 1 | 2 | - |
| 6 | Jun 1, 2020 10:50 PM | I-75 | 1 | - | 1
| 3 | 1 |
| 7 | Jun 18, 2020 06:50 AM | Sr-40, Sw 27th Avenue | 2 | - | 1
| 2 | - |
| 8 | Jul 24, 2020 01:57 PM | Us-441 | 1 | - | 1
| 2 | 1 |
| 9 | Aug 11, 2020 09:30 PM | Ne 25th Avenue | 1 | - | 1
| 1 | 1 |
| 10 | Aug 18, 2020 08:55 PM | Sr-200, Sw 35th Terrace | 1 | - | 1
| 1 | 1 |
| 11 | Sep 6, 2020 03:19 PM | Us-441, Nw 22nd St | 2 | - | 1
| 5 | - |
| 12 | Oct 12, 2020 06:03 PM | 1st Ave, 2nd St | 2 | 1
| 1 | 2 | - |
| 13 | Nov 6, 2020 11:04 AM | Sr-200, Sw 43rd St Rd | 1 | - | 1
| 1 | 1 |
| 14 | Oct 11, 2020 08:23 PM | Sr-200, 38th Ct | 1 | - | 1
| 1 | 1 |
| 15 | Nov 12, 2020 05:04 PM | 28th St | 1 | - | 1
| 2 | - |
| 16 | Nov 24, 2020 09:17 AM | Sr-40, 8th Ave | 2 | - | 1
| 3 | - |
| 17 | Dec 30, 2020 10:50 PM | Sr-464 | 1 | - | 1
| 2 | 1 |
| 18 | May 13, 2020 05:48 AM | Sr-492 | 1 | - | 1
| 2 | 1 |
| 19 | Oct 16, 2020 09:20 PM | Cr-200a, N Magnolia Ave | 1 | - | 1
| 1 | 1 |
Ocala fatal car crash and road traffic accident list for 2019
- Fatal accident count11
- Vehicles involved in fatal accidents16
- Fatal accidents involving drunk persons2
- Fatalities12
- Persons involved in fatal accidents18
- Pedestrians involved in fatal accidents7
Dark - Lighted
- Ocala(Based on 11 reports) 54.5%
- Marion County(Based on 82 reports) 14.6%
- Florida(Based on 2,947 reports) 29.6%
Daylight
- Ocala(Based on 11 reports) 36.4%
- Marion County(Based on 82 reports) 37.8%
- Florida(Based on 2,947 reports) 40.1%
Dark - Not Lighted
- Ocala(Based on 11 reports) 9.1%
- Marion County(Based on 82 reports) 41.5%
- Florida(Based on 2,947 reports) 24.8%
Clear
- Ocala(Based on 11 reports) 72.7%
- Marion County(Based on 82 reports) 62.2%
- Florida(Based on 2,949 reports) 76.4%
Unknown
- Ocala(Based on 11 reports) 27.3%
- Marion County(Based on 82 reports) 30.5%
- Florida(Based on 2,949 reports) 16.3%
| # | Date | Location | Vehicles | Drunk persons | Fatalites | Persons | Pedestrians |
|---|
| 1 | Feb 17, 2019 02:58 AM | Sr-200, 48th Ave | 1 | - | 1
| 1 | 1 |
| 2 | May 7, 2019 12:16 AM | Sr-40, 2326 Sr-40 | 1 | - | 1
| 1 | 1 |
| 3 | Apr 24, 2019 07:44 AM | 3rd St | 1 | - | 1
| 1 | - |
| 4 | Jun 16, 2019 03:36 AM | Sr-492 | 1 | 1
| 2 | 2 | - |
| 5 | Jul 18, 2019 10:40 PM | Sr-40 | 2 | 1
| 1 | 1 | 3 |
| 6 | Jul 23, 2019 04:39 PM | Us-301-441 Sr-25 Pine Ave, Sw 5th St | 2 | - | 1
| 2 | - |
| 7 | Oct 24, 2019 02:11 PM | Us-441 | 2 | - | 1
| 2 | - |
| 8 | Nov 22, 2019 10:30 PM | Us-301-441 Sr-25 Pine Ave, Fort King St | 1 | - | 1
| 1 | 1 |
| 9 | Dec 2, 2019 00:38 AM | Sr-464 Sw 17th Ave | 1 | - | 1
| 1 | - |
| 10 | Nov 16, 2019 02:09 PM | N Magnolia Avenue | 1 | - | 1
| 2 | 1 |
| 11 | Nov 8, 2019 01:26 AM | Sr-40, Ne 25th Ave | 3 | - | 1
| 4 | - |
Ocala fatal car crash and road traffic accident list for 2018
- Fatal accident count9
- Vehicles involved in fatal accidents14
- Fatal accidents involving drunk persons3
- Fatalities11
- Persons involved in fatal accidents22
- Pedestrians involved in fatal accidents4
Daylight
- Ocala(Based on 9 reports) 55.6%
- Marion County(Based on 78 reports) 34.6%
- Florida(Based on 2,911 reports) 39.6%
Dark - Lighted
- Ocala(Based on 9 reports) 22.2%
- Marion County(Based on 78 reports) 5.1%
- Florida(Based on 2,911 reports) 29.3%
Dark - Not Lighted
- Ocala(Based on 9 reports) 22.2%
- Marion County(Based on 78 reports) 50.0%
- Florida(Based on 2,911 reports) 25.1%
Clear
- Ocala(Based on 9 reports) 77.8%
- Marion County(Based on 78 reports) 56.4%
- Florida(Based on 2,911 reports) 75.7%
Unknown
- Ocala(Based on 9 reports) 22.2%
- Marion County(Based on 78 reports) 30.8%
- Florida(Based on 2,911 reports) 16.5%
| # | Date | Location | Vehicles | Drunk persons | Fatalites | Persons | Pedestrians |
|---|
| 1 | Jan 13, 2018 11:30 PM | Sr-40, 1st Ave | 1 | 1
| 2 | 1 | 2 |
| 2 | Mar 8, 2018 01:50 AM | 24th St | 1 | 1
| 1 | 1 | 1 |
| 3 | Apr 17, 2018 02:00 AM | Cr-200a, 20th St | 1 | - | 1
| 1 | - |
| 4 | Aug 13, 2018 12:55 AM | I-75 | 4 | - | 2
| 8 | - |
| 5 | Sep 1, 2018 06:20 PM | 13th St | 1 | - | 1
| 1 | - |
| 6 | Oct 16, 2018 02:10 PM | 36th Ave | 3 | - | 1
| 6 | - |
| 7 | Nov 28, 2018 10:12 PM | 48th Ave | 1 | - | 1
| 1 | - |
| 8 | Dec 9, 2018 02:05 PM | Sr-40 | 1 | - | 1
| 1 | - |
| 9 | Sep 7, 2018 06:50 PM | 24th St | 1 | 1
| 1 | 2 | 1 |
Ocala fatal car crash and road traffic accident list for 2017
- Fatal accident count12
- Vehicles involved in fatal accidents19
- Fatal accidents involving drunk persons1
- Fatalities13
- Persons involved in fatal accidents27
- Pedestrians involved in fatal accidents4
Daylight
- Ocala(Based on 12 reports) 58.3%
- Marion County(Based on 83 reports) 41.0%
- Florida(Based on 2,919 reports) 40.7%
Dark - Lighted
- Ocala(Based on 12 reports) 25.0%
- Marion County(Based on 83 reports) 7.2%
- Florida(Based on 2,919 reports) 29.4%
Dark - Not Lighted
- Ocala(Based on 12 reports) 16.7%
- Marion County(Based on 83 reports) 44.6%
- Florida(Based on 2,919 reports) 23.9%
Clear
- Ocala(Based on 12 reports) 66.7%
- Marion County(Based on 83 reports) 71.1%
- Florida(Based on 2,919 reports) 77.4%
Unknown
- Ocala(Based on 12 reports) 25.0%
- Marion County(Based on 83 reports) 21.7%
- Florida(Based on 2,919 reports) 16.3%
Fog, Smog, Smoke
- Ocala(Based on 12 reports) 8.3%
- Marion County(Based on 83 reports) 2.4%
- Florida(Based on 2,919 reports) 1.1%
| # | Date | Location | Vehicles | Drunk persons | Fatalites | Persons | Pedestrians |
|---|
| 1 | Mar 25, 2017 05:05 PM | 19th Ave | 2 | - | 1
| 5 | - |
| 2 | May 7, 2017 08:35 PM | Sr-200 | 1 | - | 1
| 1 | 1 |
| 3 | Jul 2, 2017 06:22 PM | Us-27 | 1 | - | 1
| 1 | 1 |
| 4 | Jul 16, 2017 10:27 AM | Us-441, 20th St | 2 | - | 1
| 2 | - |
| 5 | Jul 8, 2017 01:36 PM | Sr-464 | 1 | - | 1
| 1 | - |
| 6 | Aug 16, 2017 06:21 AM | I-75 | 2 | - | 1
| 5 | - |
| 7 | Nov 3, 2017 07:29 PM | Us-441 | 1 | - | 1
| 1 | 1 |
| 8 | Nov 11, 2017 03:45 PM | I-75 | 1 | - | 1
| 2 | - |
| 9 | Nov 25, 2017 07:30 PM | Cr-200a | 2 | 1
| 1 | 2 | - |
| 10 | Dec 19, 2017 00:30 AM | Sr-200 | 1 | - | 1
| 1 | 1 |
| 11 | Dec 15, 2017 04:28 PM | Sr-492, 30 Avenue | 2 | - | 2
| 3 | - |
| 12 | Nov 17, 2017 02:14 PM | Us-441, Us-27 | 3 | - | 1
| 3 | - |
Ocala fatal car crash and road traffic accident list for 2016
- Fatal accident count16
- Vehicles involved in fatal accidents31
- Fatal accidents involving drunk persons6
- Fatalities16
- Persons involved in fatal accidents48
- Pedestrians involved in fatal accidents5
Daylight
- Ocala(Based on 16 reports) 37.5%
- Marion County(Based on 69 reports) 55.1%
- Florida(Based on 2,930 reports) 38.9%
Dark - Lighted
- Ocala(Based on 16 reports) 25.0%
- Marion County(Based on 69 reports) 7.2%
- Florida(Based on 2,930 reports) 30.8%
Dark - Not Lighted
- Ocala(Based on 16 reports) 18.8%
- Marion County(Based on 69 reports) 30.4%
- Florida(Based on 2,930 reports) 25.0%
Dusk
- Ocala(Based on 16 reports) 12.5%
- Marion County(Based on 69 reports) 5.8%
- Florida(Based on 2,930 reports) 3.3%
Dawn
- Ocala(Based on 16 reports) 6.3%
- Marion County(Based on 69 reports) 1.4%
- Florida(Based on 2,930 reports) 1.4%
Clear
- Ocala(Based on 16 reports) 75.0%
- Marion County(Based on 69 reports) 79.7%
- Florida(Based on 2,931 reports) 76.5%
Unknown
- Ocala(Based on 16 reports) 18.8%
- Marion County(Based on 69 reports) 15.9%
- Florida(Based on 2,931 reports) 16.0%
Fog, Smog, Smoke
- Ocala(Based on 16 reports) 6.3%
- Marion County(Based on 69 reports) 1.4%
- Florida(Based on 2,931 reports) 1.4%
| # | Date | Location | Vehicles | Drunk persons | Fatalites | Persons | Pedestrians |
|---|
| 1 | Feb 10, 2016 08:20 AM | 60th Ave, 20th St | 3 | - | 1
| 8 | - |
| 2 | Feb 25, 2016 07:22 AM | Cr-200a, 28 St | 2 | - | 1
| 3 | - |
| 3 | Feb 13, 2016 06:25 PM | Us-301-441 | 2 | 2
| 1 | 2 | - |
| 4 | Mar 13, 2016 03:37 PM | Sr-40 | 2 | 1
| 1 | 2 | - |
| 5 | Mar 6, 2016 10:06 PM | 8th Ave | 1 | 1
| 1 | 2 | 1 |
| 6 | Apr 18, 2016 07:44 AM | Sr-464 | 4 | - | 1
| 8 | - |
| 7 | May 21, 2016 00:00 AM | Us-301/441 / Sr-25 Pine Ave | 2 | - | 1
| 2 | - |
| 8 | Jun 14, 2016 12:12 AM | Sr-200, 44th Ct | 1 | - | 1
| 1 | 1 |
| 9 | Jul 12, 2016 08:08 PM | Sr-200, Sw 19th Ave | 2 | - | 1
| 6 | - |
| 10 | Jun 3, 2016 10:35 PM | Sr-464 | 2 | 2
| 1 | 3 | - |
| 11 | Sep 22, 2016 06:00 AM | Us-27 | 1 | - | 1
| 1 | 1 |
| 12 | Oct 20, 2016 02:58 PM | 30 Ave, 14 St | 2 | - | 1
| 3 | - |
| 13 | Oct 24, 2016 12:19 AM | 10th St, 27th Ave | 2 | - | 1
| 2 | - |
| 14 | Nov 17, 2016 00:53 AM | I-75 | 2 | - | 1
| 2 | - |
| 15 | Oct 3, 2016 07:02 AM | Us-441 | 2 | - | 1
| 2 | 1 |
| 16 | Dec 27, 2016 07:01 AM | Sr-464, 3rd Ave | 1 | - | 1
| 1 | 1 |
Ocala fatal car crash and road traffic accident list for 2015
- Fatal accident count14
- Vehicles involved in fatal accidents21
- Fatal accidents involving drunk persons2
- Fatalities15
- Persons involved in fatal accidents29
- Pedestrians involved in fatal accidents3
Daylight
- Ocala(Based on 14 reports) 57.1%
- Marion County(Based on 63 reports) 41.3%
- Florida(Based on 2,693 reports) 39.8%
Dark - Lighted
- Ocala(Based on 14 reports) 35.7%
- Marion County(Based on 63 reports) 12.7%
- Florida(Based on 2,693 reports) 30.2%
Dusk
- Ocala(Based on 14 reports) 7.1%
- Marion County(Based on 63 reports) 1.6%
- Florida(Based on 2,693 reports) 3.2%
Clear
- Ocala(Based on 14 reports) 50.0%
- Marion County(Based on 63 reports) 60.3%
- Florida(Based on 2,693 reports) 72.9%
Unknown
- Ocala(Based on 14 reports) 42.9%
- Marion County(Based on 63 reports) 33.3%
- Florida(Based on 2,693 reports) 21.0%
Rain
- Ocala(Based on 14 reports) 7.1%
- Marion County(Based on 63 reports) 4.8%
- Florida(Based on 2,693 reports) 5.1%
| # | Date | Location | Vehicles | Drunk persons | Fatalites | Persons | Pedestrians |
|---|
| 1 | Jan 21, 2015 01:24 PM | Us-441, Nw 22nd St | 2 | - | 1
| 2 | - |
| 2 | Jan 24, 2015 09:40 PM | I-75 | 1 | - | 1
| 2 | 1 |
| 3 | Jun 7, 2015 09:48 AM | Sr-464 | 2 | - | 2
| 3 | - |
| 4 | Jun 30, 2015 08:40 PM | I-75 | 1 | 1
| 1 | 1 | - |
| 5 | Jul 23, 2015 03:36 PM | Sr-40, Nw 16th Ave | 2 | - | 1
| 4 | - |
| 6 | Aug 19, 2015 07:30 AM | Sr-40, 8585 W Hwy 40 | 2 | - | 1
| 2 | - |
| 7 | Aug 22, 2015 02:26 PM | Ft. King St, 25th Ave | 2 | - | 1
| 2 | - |
| 8 | Oct 24, 2015 07:00 PM | I-75 | 1 | - | 1
| 3 | - |
| 9 | Dec 3, 2015 08:07 PM | Sr-40 | 1 | - | 1
| 2 | 1 |
| 10 | Apr 28, 2015 03:01 PM | Sr-40, 12th Terr | 2 | 1
| 1 | 3 | - |
| 11 | Sep 9, 2015 07:53 AM | Sr-200 | 2 | - | 1
| 2 | - |
| 12 | Nov 12, 2015 01:30 PM | 62nd Loop, 65th Loop | 1 | - | 1
| 1 | - |
| 13 | Dec 5, 2015 00:34 AM | Sr-40, Ne 25th Ave | 1 | - | 1
| 1 | - |
| 14 | Dec 15, 2015 06:15 PM | Sr-40, I-75 | 1 | - | 1
| 1 | 1 |
Ocala fatal car crash and road traffic accident list for 2014
- Fatal accident count7
- Vehicles involved in fatal accidents10
- Fatal accidents involving drunk persons1
- Fatalities7
- Persons involved in fatal accidents11
- Pedestrians involved in fatal accidents5
Dark - Not Lighted
- Ocala(Based on 7 reports) 57.1%
- Marion County(Based on 49 reports) 57.1%
- Florida(Based on 2,332 reports) 25.6%
Dark - Lighted
- Ocala(Based on 7 reports) 28.6%
- Marion County(Based on 49 reports) 8.2%
- Florida(Based on 2,332 reports) 29.4%
Daylight
- Ocala(Based on 7 reports) 14.3%
- Marion County(Based on 49 reports) 32.7%
- Florida(Based on 2,332 reports) 39.1%
Clear
- Ocala(Based on 7 reports) 71.4%
- Marion County(Based on 49 reports) 79.6%
- Florida(Based on 2,329 reports) 73.5%
Rain
- Ocala(Based on 7 reports) 14.3%
- Marion County(Based on 49 reports) 10.2%
- Florida(Based on 2,329 reports) 7.7%
Unknown
- Ocala(Based on 7 reports) 14.3%
- Marion County(Based on 49 reports) 10.2%
- Florida(Based on 2,329 reports) 18.0%
| # | Date | Location | Vehicles | Drunk persons | Fatalites | Persons | Pedestrians |
|---|
| 1 | Jan 19, 2014 07:45 PM | Us-27 | 1 | - | 1
| 2 | 1 |
| 2 | Jun 10, 2014 10:06 PM | Us-441, Sr-464 | 1 | - | 1
| 1 | 1 |
| 3 | Jun 2, 2014 01:21 PM | Sr-40, Ne 7th St | 3 | - | 1
| 3 | - |
| 4 | Apr 18, 2014 10:20 PM | Sr-200, Sw 27th Ave | 2 | 1
| 1 | 2 | - |
| 5 | Nov 1, 2014 02:35 AM | Ne 2nd St | 1 | - | 1
| 1 | 1 |
| 6 | Nov 8, 2014 01:40 AM | Us-441 | 1 | - | 1
| 1 | 1 |
| 7 | Dec 20, 2014 07:25 PM | Sr-326 | 1 | - | 1
| 1 | 1 |
Ocala fatal car crash and road traffic accident list for 2013
- Fatal accident count5
- Vehicles involved in fatal accidents10
- Fatalities5
- Persons involved in fatal accidents14
- Pedestrians involved in fatal accidents3
Daylight
- Ocala(Based on 5 reports) 80.0%
- Marion County(Based on 43 reports) 53.5%
- Florida(Based on 2,222 reports) 40.8%
Dark - Not Lighted
- Ocala(Based on 5 reports) 20.0%
- Marion County(Based on 43 reports) 34.9%
- Florida(Based on 2,222 reports) 24.9%
Clear
- Ocala(Based on 5 reports) 60.0%
- Marion County(Based on 43 reports) 65.1%
- Florida(Based on 2,221 reports) 71.9%
Rain
- Ocala(Based on 5 reports) 20.0%
- Marion County(Based on 43 reports) 9.3%
- Florida(Based on 2,221 reports) 6.6%
Unknown
- Ocala(Based on 5 reports) 20.0%
- Marion County(Based on 43 reports) 23.3%
- Florida(Based on 2,221 reports) 20.8%
Ocala fatal car crash and road traffic accident list for 2012
- Fatal accident count12
- Vehicles involved in fatal accidents20
- Fatal accidents involving drunk persons2
- Fatalities12
- Persons involved in fatal accidents28
- Pedestrians involved in fatal accidents5
Daylight
- Ocala(Based on 12 reports) 50.0%
- Marion County(Based on 60 reports) 41.7%
- Florida(Based on 2,249 reports) 40.1%
Dark - Lighted
- Ocala(Based on 12 reports) 41.7%
- Marion County(Based on 60 reports) 20.0%
- Florida(Based on 2,249 reports) 29.2%
Dusk
- Ocala(Based on 12 reports) 8.3%
- Marion County(Based on 60 reports) 6.7%
- Florida(Based on 2,249 reports) 2.9%
Clear
- Ocala(Based on 12 reports) 83.3%
- Marion County(Based on 60 reports) 71.7%
- Florida(Based on 2,244 reports) 74.9%
Unknown
- Ocala(Based on 12 reports) 16.7%
- Marion County(Based on 60 reports) 25.0%
- Florida(Based on 2,244 reports) 18.3%
| # | Date | Location | Vehicles | Drunk persons | Fatalites | Persons | Pedestrians |
|---|
| 1 | Feb 16, 2012 03:35 PM | I-75 | 2 | - | 1
| 1 | 1 |
| 2 | Apr 27, 2012 07:34 AM | Cr-200a | 2 | - | 1
| 1 | 2 |
| 3 | Jan 19, 2012 10:15 PM | 36th Ave | 2 | 2
| 1 | 3 | - |
| 4 | May 2, 2012 05:39 PM | Sw 19th Avenue Road | 2 | - | 1
| 2 | - |
| 5 | Jun 13, 2012 12:36 AM | Sw 20th St, 27th Ave | 1 | - | 1
| 4 | - |
| 6 | Jun 30, 2012 02:20 AM | 20th St | 1 | - | 1
| 1 | 1 |
| 7 | Aug 25, 2012 03:42 AM | Ne 7th St, Ne 41st Ave | 1 | - | 1
| 2 | - |
| 8 | Nov 22, 2012 01:10 AM | Us-441, Sr-200 | 1 | - | 1
| 1 | 1 |
| 9 | Nov 26, 2012 04:20 PM | 36th Ave, 7th St | 2 | - | 1
| 2 | - |
| 10 | Nov 28, 2012 04:33 PM | Sr-200, Sw 46th Ct | 2 | - | 1
| 3 | - |
| 11 | Nov 30, 2012 05:36 PM | Sr-40a, Sw 7th Ave | 2 | - | 1
| 6 | - |
| 12 | Oct 13, 2012 02:03 AM | Us-441 | 2 | - | 1
| 2 | - |
Ocala fatal car crash and road traffic accident list for 2011
- Fatal accident count11
- Vehicles involved in fatal accidents16
- Fatal accidents involving drunk persons3
- Fatalities13
- Persons involved in fatal accidents24
- Pedestrians involved in fatal accidents2
Dusk
- Ocala(Based on 10 reports) 30.0%
- Marion County(Based on 54 reports) 7.4%
- Florida(Based on 2,202 reports) 2.3%
Daylight
- Ocala(Based on 10 reports) 30.0%
- Marion County(Based on 54 reports) 38.9%
- Florida(Based on 2,202 reports) 40.7%
Dark - Lighted
- Ocala(Based on 10 reports) 20.0%
- Marion County(Based on 54 reports) 9.3%
- Florida(Based on 2,202 reports) 27.9%
Dark - Not Lighted
- Ocala(Based on 10 reports) 20.0%
- Marion County(Based on 54 reports) 42.6%
- Florida(Based on 2,202 reports) 26.4%
Clear
- Ocala(Based on 10 reports) 60.0%
- Marion County(Based on 54 reports) 72.2%
- Florida(Based on 2,203 reports) 75.3%
Unknown
- Ocala(Based on 10 reports) 30.0%
- Marion County(Based on 54 reports) 13.0%
- Florida(Based on 2,203 reports) 17.7%
Rain
- Ocala(Based on 10 reports) 10.0%
- Marion County(Based on 54 reports) 11.1%
- Florida(Based on 2,203 reports) 5.4%
| # | Date | Location | Vehicles | Drunk persons | Fatalites | Persons | Pedestrians |
|---|
| 1 | Jan 25, 2011 03:35 AM | Us-301 | 2 | - | 2
| 3 | - |
| 2 | Jan 25, 2011 05:02 PM | Se 36th Avenue | 1 | - | 1
| 3 | - |
| 3 | Mar 17, 2011 11:40 AM | Sr-40, I-75 | 2 | - | 1
| 5 | - |
| 4 | Jun 7, 2011 12:55 AM | Nw 35th Street, W Anthony Road | 2 | - | 1
| 2 | - |
| 5 | Jan 24, 2011 08:03 PM | Sr-40 | 1 | - | 1
| 1 | 1 |
| 6 | Jul 15, 2011 08:15 PM | 60th Avenue | 1 | 1
| 1 | 1 | - |
| 7 | Jul 10, 2011 05:02 AM | Nw 44th Avenue, Sr 500 | 1 | - | 2
| 2 | - |
| 8 | Aug 26, 2011 11:33 PM | Ne 36th Avenue | 1 | - | 1
| 2 | 1 |
| 9 | Oct 29, 2011 02:29 PM | Sr-40 | 2 | - | 1
| 2 | - |
| 10 | Nov 30, 2011 05:01 PM | 105th Street | 1 | - | 1
| 1 | - |
| 11 | Dec 10, 2011 11:14 PM | Sr-200, 17th Rd | 2 | 2
| 1 | 2 | - |
Ocala fatal car crash and road traffic accident list for 2010
- Fatal accident count11
- Vehicles involved in fatal accidents15
- Fatal accidents involving drunk persons4
- Fatalities11
- Persons involved in fatal accidents16
- Pedestrians involved in fatal accidents4
Average EMS response time
- Ocala(Based on 6 reports) 5.5 mins
- Marion County(Based on 48 reports) 8.1 mins
- Florida(Based on 1,596 reports) 7.3 mins
Dark - Not Lighted
- Ocala(Based on 11 reports) 45.5%
- Marion County(Based on 68 reports) 48.5%
- Florida(Based on 2,256 reports) 25.5%
Dark - Lighted
- Ocala(Based on 11 reports) 36.4%
- Marion County(Based on 68 reports) 10.3%
- Florida(Based on 2,256 reports) 29.2%
Daylight
- Ocala(Based on 11 reports) 18.2%
- Marion County(Based on 68 reports) 39.7%
- Florida(Based on 2,256 reports) 41.5%
Clear
- Ocala(Based on 11 reports) 72.7%
- Marion County(Based on 68 reports) 75.0%
- Florida(Based on 2,254 reports) 73.9%
Unknown
- Ocala(Based on 11 reports) 18.2%
- Marion County(Based on 68 reports) 19.1%
- Florida(Based on 2,254 reports) 19.1%
Rain
- Ocala(Based on 11 reports) 9.1%
- Marion County(Based on 68 reports) 5.9%
- Florida(Based on 2,254 reports) 6.2%
| # | Date | Location | Vehicles | Drunk persons | Fatalites | Persons | Pedestrians |
|---|
| 1 | Mar 20, 2010 03:48 AM | Cr-475 | 1 | 1
| 1 | 1 | - |
| 2 | Feb 4, 2010 10:14 PM | Ne 36th Ave, Ne 14th St | 2 | 1
| 1 | 2 | - |
| 3 | Feb 22, 2010 08:35 PM | Sw 19th Ave Rd, Sw24th Ave | 1 | - | 1
| 1 | 1 |
| 4 | Apr 21, 2010 10:30 PM | Sw 19th Ave | 1 | 1
| 1 | 1 | - |
| 5 | Apr 21, 2010 06:18 PM | Ne 25th Avenue, Ne 7th Street | 2 | - | 1
| 2 | - |
| 6 | May 12, 2010 08:53 PM | Sr-464, Se 3rd Ave | 2 | - | 1
| 3 | - |
| 7 | May 22, 2010 02:35 PM | Us-27 | 2 | - | 1
| 2 | - |
| 8 | Aug 21, 2010 10:29 PM | Sr-464 | 1 | - | 1
| 1 | 1 |
| 9 | Oct 29, 2010 00:31 AM | Sr-464 | 1 | 1
| 1 | 1 | - |
| 10 | Dec 2, 2010 10:18 PM | Cr-464 | 1 | - | 1
| 1 | 1 |
| 11 | Dec 15, 2010 11:52 PM | Ne 25th Avenue | 1 | - | 1
| 1 | 1 |
Ocala fatal car crash and road traffic accident list for 2009
- Fatal accident count9
- Vehicles involved in fatal accidents12
- Fatal accidents involving drunk persons1
- Fatalities13
- Persons involved in fatal accidents25
- Pedestrians involved in fatal accidents3
Average EMS response time
- Ocala(Based on 5 reports) 4.8 mins
- Marion County(Based on 43 reports) 8.5 mins
- Florida(Based on 1,759 reports) 7.2 mins
Dark - Lighted
- Ocala(Based on 9 reports) 55.6%
- Marion County(Based on 53 reports) 11.3%
- Florida(Based on 2,366 reports) 29.0%
Daylight
- Ocala(Based on 9 reports) 33.3%
- Marion County(Based on 53 reports) 50.9%
- Florida(Based on 2,366 reports) 40.4%
Dark - Not Lighted
- Ocala(Based on 9 reports) 11.1%
- Marion County(Based on 53 reports) 35.8%
- Florida(Based on 2,366 reports) 26.6%
Clear
- Ocala(Based on 9 reports) 100.0%
- Marion County(Based on 53 reports) 88.7%
- Florida(Based on 2,369 reports) 93.3%
| # | Date | Location | Vehicles | Drunk persons | Fatalites | Persons | Pedestrians |
|---|
| 1 | Mar 4, 2009 87:99 PM | Se 31st St, Se 5th Terr | 1 | - | 3
| 3 | - |
| 2 | Mar 12, 2009 11:10 AM | Sr-464, Se 36th Ave | 2 | - | 2
| 2 | - |
| 3 | Mar 20, 2009 02:33 AM | I-75, Cr-484 | 1 | - | 2
| 4 | - |
| 4 | May 8, 2009 11:58 AM | Sr-40, Ne 30th Ave | 2 | - | 1
| 4 | - |
| 5 | Jun 27, 2009 12:45 AM | I-75, Martin Rd | 2 | - | 1
| 3 | - |
| 6 | Jul 14, 2009 11:40 PM | I-75, Sr-40 | 1 | 1
| 1 | 2 | - |
| 7 | Jul 23, 2009 00:10 AM | Ne 36th Ave, Ne 7th St | 1 | - | 1
| 3 | 1 |
| 8 | Aug 18, 2009 10:02 PM | Us-441, Nw 28th St | 1 | - | 1
| 2 | 1 |
| 9 | Sep 4, 2009 09:45 PM | Sr-464, Se 36th Ave | 1 | - | 1
| 2 | 1 |
Ocala fatal car crash and road traffic accident list for 2008
- Fatal accident count16
- Vehicles involved in fatal accidents28
- Fatal accidents involving drunk persons7
- Fatalities16
- Persons involved in fatal accidents41
- Pedestrians involved in fatal accidents6
Average EMS response time
- Ocala(Based on 9 reports) 5.8 mins
- Marion County(Based on 64 reports) 6.5 mins
- Florida(Based on 2,108 reports) 7.1 mins
Average hospital transport time
- Ocala(Based on 2 reports) 230.5 mins
- Marion County(Based on 10 reports) 194.0 mins
- Florida(Based on 130 reports) 164.3 mins
Daylight
- Ocala(Based on 16 reports) 50.0%
- Marion County(Based on 83 reports) 50.6%
- Florida(Based on 2,753 reports) 40.9%
Dark - Lighted
- Ocala(Based on 16 reports) 43.8%
- Marion County(Based on 83 reports) 13.3%
- Florida(Based on 2,753 reports) 29.3%
Dark - Not Lighted
- Ocala(Based on 16 reports) 6.3%
- Marion County(Based on 83 reports) 33.7%
- Florida(Based on 2,753 reports) 25.5%
Clear
- Ocala(Based on 16 reports) 100.0%
- Marion County(Based on 83 reports) 96.4%
- Florida(Based on 2,760 reports) 92.8%
| # | Date | Location | Vehicles | Drunk persons | Fatalites | Persons | Pedestrians |
|---|
| 1 | Jan 30, 2008 07:34 PM | Sr-40, Ne 12th Terr | 1 | - | 1
| 2 | 1 |
| 2 | Feb 2, 2008 09:00 AM | Sr-492, Ne 33rd Ave | 2 | - | 1
| 2 | - |
| 3 | Feb 14, 2008 04:40 PM | I-75, Sr-40 | 3 | - | 1
| 3 | - |
| 4 | May 2, 2008 08:25 PM | I-75, Sr-40 | 2 | - | 1
| 3 | 1 |
| 5 | Apr 17, 2008 11:46 AM | Sr-492, Ne 30th Ave | 1 | - | 1
| 2 | 1 |
| 6 | Jul 18, 2008 01:33 PM | Sr-492, Ne 19 Avenue | 2 | - | 1
| 2 | - |
| 7 | Jul 20, 2008 07:05 PM | I-75, Sr-200 | 1 | - | 1
| 2 | - |
| 8 | Aug 26, 2008 12:40 AM | I-93, Sr-40 | 2 | 1
| 1 | 2 | 1 |
| 9 | Jan 5, 2008 09:56 PM | Sr-464, Se 24th Street | 2 | 2
| 1 | 2 | - |
| 10 | Aug 14, 2008 09:47 PM | Us-27, Sw 18th Street | 1 | - | 1
| 2 | 1 |
| 11 | Aug 19, 2008 07:31 PM | Ne 25th Ave, Ne 3rd St | 1 | - | 1
| 1 | - |
| 12 | Nov 10, 2008 11:13 PM | Sr-40, Se 19th Ave | 2 | 1
| 1 | 3 | 1 |
| 13 | Dec 23, 2008 08:20 PM | I-75, Sr-200 | 1 | 1
| 1 | 1 | - |
| 14 | Dec 1, 2008 02:02 PM | Sr-492, Sr-492 | 5 | - | 1
| 8 | - |
| 15 | Dec 20, 2008 09:40 PM | Nw 27th Ave, Nw 7th St | 1 | 1
| 1 | 2 | - |
| 16 | Dec 14, 2008 02:18 AM | Sw 48th Ave, Sr-200 | 1 | 1
| 1 | 4 | - |
Ocala fatal car crash and road traffic accident list for 2007
- Fatal accident count8
- Vehicles involved in fatal accidents13
- Fatal accidents involving drunk persons4
- Fatalities9
- Persons involved in fatal accidents21
- Pedestrians involved in fatal accidents4
Average EMS response time
- Ocala(Based on 6 reports) 5.3 mins
- Marion County(Based on 48 reports) 7.4 mins
- Florida(Based on 2,222 reports) 7.2 mins
Dark - Lighted
- Ocala(Based on 8 reports) 37.5%
- Marion County(Based on 61 reports) 8.2%
- Florida(Based on 2,935 reports) 26.9%
Daylight
- Ocala(Based on 8 reports) 37.5%
- Marion County(Based on 61 reports) 44.3%
- Florida(Based on 2,935 reports) 41.7%
Dark - Not Lighted
- Ocala(Based on 8 reports) 12.5%
- Marion County(Based on 61 reports) 41.0%
- Florida(Based on 2,935 reports) 27.5%
Dusk
- Ocala(Based on 8 reports) 12.5%
- Marion County(Based on 61 reports) 3.3%
- Florida(Based on 2,935 reports) 2.1%
Clear
- Ocala(Based on 8 reports) 87.5%
- Marion County(Based on 61 reports) 85.2%
- Florida(Based on 2,943 reports) 91.9%
Rain
- Ocala(Based on 8 reports) 12.5%
- Marion County(Based on 61 reports) 9.8%
- Florida(Based on 2,943 reports) 6.5%
| # | Date | Location | Vehicles | Drunk persons | Fatalites | Persons | Pedestrians |
|---|
| 1 | Jan 22, 2007 07:21 PM | Us-27, 38th Ave | 2 | 1
| 2 | 3 | - |
| 2 | Jan 11, 2007 07:21 PM | Sr-464, 27th St | 1 | - | 1
| 2 | 1 |
| 3 | Jan 16, 2007 09:02 PM | Sr-200, Sw 27th Ave | 1 | 1
| 1 | 2 | 1 |
| 4 | Mar 4, 2007 07:08 PM | Sr-40, 7th Ave | 1 | 1
| 1 | 2 | 1 |
| 5 | May 3, 2007 08:13 AM | I-75, Sr-200 | 2 | 1
| 1 | 3 | - |
| 6 | Feb 21, 2007 10:18 AM | Us-27, Fort King St | 2 | - | 1
| 2 | - |
| 7 | Jul 18, 2007 11:55 AM | I-75, Sr-200 | 3 | - | 1
| 5 | - |
| 8 | Oct 15, 2007 04:58 AM | 36th Ave, 21st St | 1 | - | 1
| 2 | 1 |
Ocala fatal car crash and road traffic accident list for 2006
- Fatal accident count8
- Vehicles involved in fatal accidents14
- Fatal accidents involving drunk persons2
- Fatalities11
- Persons involved in fatal accidents32
- Pedestrians involved in fatal accidents4
Average EMS response time
- Ocala(Based on 4 reports) 3.5 mins
- Marion County(Based on 45 reports) 8.0 mins
- Florida(Based on 2,375 reports) 7.3 mins
Daylight
- Ocala(Based on 8 reports) 50.0%
- Marion County(Based on 60 reports) 36.7%
- Florida(Based on 3,072 reports) 43.9%
Dark - Not Lighted
- Ocala(Based on 8 reports) 37.5%
- Marion County(Based on 60 reports) 43.3%
- Florida(Based on 3,072 reports) 26.7%
Dark - Lighted
- Ocala(Based on 8 reports) 12.5%
- Marion County(Based on 60 reports) 11.7%
- Florida(Based on 3,072 reports) 25.5%
Clear
- Ocala(Based on 8 reports) 100.0%
- Marion County(Based on 60 reports) 98.3%
- Florida(Based on 3,080 reports) 93.0%
| # | Date | Location | Vehicles | Drunk persons | Fatalites | Persons | Pedestrians |
|---|
| 1 | Jan 11, 2006 09:19 PM | 5th St, 23rd Ave | 2 | - | 1
| 4 | - |
| 2 | Mar 24, 2006 11:25 PM | Sr-40, 10th St | 1 | 1
| 1 | 3 | 1 |
| 3 | Mar 27, 2006 08:55 AM | Sr-40, I-75 | 2 | - | 2
| 5 | - |
| 4 | Apr 16, 2006 08:00 PM | Us-441, 30th St | 2 | - | 2
| 4 | 1 |
| 5 | Aug 23, 2006 12:32 AM | Sw 12th St, Sw 3rd Ave | 3 | - | 1
| 7 | - |
| 6 | Feb 9, 2006 01:57 PM | Cr- 200a, 28th St | 1 | 1
| 1 | 2 | 1 |
| 7 | Oct 8, 2006 12:10 AM | Sr-200, 17th St | 2 | - | 2
| 5 | - |
| 8 | May 24, 2006 08:55 PM | 38th Ave, 28th Pl | 1 | - | 1
| 2 | 1 |
Ocala fatal car crash and road traffic accident list for 2005
- Fatal accident count11
- Vehicles involved in fatal accidents17
- Fatal accidents involving drunk persons2
- Fatalities12
- Persons involved in fatal accidents31
- Pedestrians involved in fatal accidents2
Average EMS response time
- Ocala(Based on 6 reports) 7.2 mins
- Marion County(Based on 75 reports) 9.9 mins
- Florida(Based on 2,530 reports) 7.5 mins
Daylight
- Ocala(Based on 11 reports) 63.6%
- Marion County(Based on 88 reports) 45.5%
- Florida(Based on 3,162 reports) 44.6%
Dark - Lighted
- Ocala(Based on 11 reports) 18.2%
- Marion County(Based on 88 reports) 8.0%
- Florida(Based on 3,162 reports) 23.9%
Dark - Not Lighted
- Ocala(Based on 11 reports) 18.2%
- Marion County(Based on 88 reports) 42.0%
- Florida(Based on 3,162 reports) 27.2%
Clear
- Ocala(Based on 11 reports) 81.8%
- Marion County(Based on 88 reports) 89.8%
- Florida(Based on 3,176 reports) 90.6%
Rain
- Ocala(Based on 11 reports) 18.2%
- Marion County(Based on 88 reports) 8.0%
- Florida(Based on 3,176 reports) 7.8%
| # | Date | Location | Vehicles | Drunk persons | Fatalites | Persons | Pedestrians |
|---|
| 1 | Jan 4, 2005 05:26 PM | Sw 33 Ave, Sw 5th St | 2 | - | 1
| 2 | - |
| 2 | Jan 22, 2005 07:16 PM | Sr-40, Ne 42nd Ave | 1 | 1
| 1 | 2 | 1 |
| 3 | May 22, 2005 02:52 PM | Nw 7th St, Old Blitchton Rd | 1 | - | 1
| 1 | - |
| 4 | Jul 12, 2005 11:22 PM | I-75, Sr-200 | 1 | - | 1
| 1 | - |
| 5 | Sep 11, 2005 06:35 AM | Sr-200, Sw 34th Ave | 1 | - | 1
| 4 | 1 |
| 6 | Sep 22, 2005 03:35 AM | Sr-40, 14th St | 1 | - | 1
| 2 | - |
| 7 | Oct 15, 2005 10:55 AM | Cr-314, Cr-314a | 1 | 1
| 2 | 2 | - |
| 8 | Jun 18, 2005 09:59 AM | Sr-40, 7th St | 2 | - | 1
| 3 | - |
| 9 | Jun 26, 2005 12:13 AM | Us-27, 16th Ave | 2 | - | 1
| 5 | - |
| 10 | Jul 28, 2005 08:30 AM | Us-301, Magnolia Ave | 2 | - | 1
| 2 | - |
| 11 | Aug 7, 2005 12:41 AM | Us-27, 10th St | 3 | - | 1
| 7 | - |
Ocala fatal car crash and road traffic accident list for 2004
- Fatal accident count12
- Vehicles involved in fatal accidents17
- Fatal accidents involving drunk persons1
- Fatalities13
- Persons involved in fatal accidents30
- Pedestrians involved in fatal accidents4
Average EMS response time
- Ocala(Based on 8 reports) 4.0 mins
- Marion County(Based on 59 reports) 6.9 mins
- Florida(Based on 2,319 reports) 7.3 mins
Dark - Lighted
- Ocala(Based on 12 reports) 50.0%
- Marion County(Based on 76 reports) 9.2%
- Florida(Based on 2,920 reports) 24.7%
Daylight
- Ocala(Based on 12 reports) 50.0%
- Marion County(Based on 76 reports) 53.9%
- Florida(Based on 2,920 reports) 44.5%
Clear
- Ocala(Based on 12 reports) 100.0%
- Marion County(Based on 77 reports) 97.4%
- Florida(Based on 2,927 reports) 93.0%
| # | Date | Location | Vehicles | Drunk persons | Fatalites | Persons | Pedestrians |
|---|
| 1 | Mar 4, 2004 08:26 PM | Sr-40, Ne 22nd Ave | 1 | - | 1
| 2 | 1 |
| 2 | Mar 19, 2004 08:06 PM | Sr-464, 36th Ave | 2 | - | 1
| 2 | - |
| 3 | Apr 12, 2004 01:58 PM | Ne 36th Ave, Ne 14th St | 2 | - | 1
| 3 | - |
| 4 | Apr 28, 2004 06:03 AM | Sw 20th St, Sw 37th Ave | 1 | - | 1
| 2 | 1 |
| 5 | May 25, 2004 09:38 PM | Sr-40, 13th Ave | 1 | - | 1
| 2 | 1 |
| 6 | Jul 30, 2004 06:08 AM | Us-27, Sr-200 | 1 | 1
| 1 | 2 | 1 |
| 7 | Mar 14, 2004 01:15 PM | Sr-40, 40th Ave | 2 | - | 1
| 5 | - |
| 8 | Oct 21, 2004 10:57 AM | Sr-200, 46th Ave | 2 | - | 1
| 3 | - |
| 9 | Nov 15, 2004 04:21 PM | 16th Ave, 10th St | 1 | - | 1
| 2 | - |
| 10 | Oct 22, 2004 02:00 AM | Sr-40, 16th Ave | 1 | - | 1
| 3 | - |
| 11 | Dec 23, 2004 02:41 PM | Ne 9th St, Ne Watula Ave | 1 | - | 2
| 2 | - |
| 12 | Dec 30, 2004 04:36 PM | Sr-200, Sw 46th Ct | 2 | - | 1
| 2 | - |
Ocala fatal car crash and road traffic accident list for 2003
- Fatal accident count18
- Vehicles involved in fatal accidents31
- Fatal accidents involving drunk persons6
- Fatalities20
- Persons involved in fatal accidents48
- Pedestrians involved in fatal accidents1
Average EMS response time
- Ocala(Based on 12 reports) 4.9 mins
- Marion County(Based on 80 reports) 8.0 mins
- Florida(Based on 2,272 reports) 7.5 mins
Dark - Lighted
- Ocala(Based on 18 reports) 44.4%
- Marion County(Based on 95 reports) 13.7%
- Florida(Based on 2,869 reports) 24.0%
Daylight
- Ocala(Based on 18 reports) 38.9%
- Marion County(Based on 95 reports) 54.7%
- Florida(Based on 2,869 reports) 47.0%
Dark - Not Lighted
- Ocala(Based on 18 reports) 11.1%
- Marion County(Based on 95 reports) 27.4%
- Florida(Based on 2,869 reports) 25.8%
Dusk
- Ocala(Based on 18 reports) 5.6%
- Marion County(Based on 95 reports) 3.2%
- Florida(Based on 2,869 reports) 2.1%
Clear
- Ocala(Based on 18 reports) 88.9%
- Marion County(Based on 96 reports) 90.6%
- Florida(Based on 2,874 reports) 92.2%
Rain
- Ocala(Based on 18 reports) 11.1%
- Marion County(Based on 96 reports) 4.2%
- Florida(Based on 2,874 reports) 6.8%
| # | Date | Location | Vehicles | Drunk persons | Fatalites | Persons | Pedestrians |
|---|
| 1 | Feb 22, 2003 00:25 AM | I-75 | 3 | 1
| 3 | 5 | - |
| 2 | Feb 24, 2003 08:30 PM | Cr-475 | 2 | 1
| 1 | 2 | - |
| 3 | Mar 6, 2003 09:08 PM | Cr-326 | 2 | 1
| 1 | 2 | - |
| 4 | Feb 21, 2003 08:17 AM | Sw 2nd St | 1 | - | 1
| 2 | - |
| 5 | Apr 7, 2003 01:27 AM | Sr-464 | 1 | - | 1
| 1 | - |
| 6 | May 29, 2003 00:15 AM | 31st St | 2 | - | 1
| 2 | - |
| 7 | May 28, 2003 10:53 PM | Us-441 | 2 | - | 1
| 3 | - |
| 8 | Apr 17, 2003 08:33 AM | Nw 27th Ave | 2 | - | 1
| 5 | - |
| 9 | Mar 3, 2003 01:15 PM | Us-27 | 2 | - | 1
| 3 | - |
| 10 | Jul 16, 2003 03:22 PM | Sr-492 | 3 | - | 1
| 5 | - |
| 11 | Jul 19, 2003 01:29 AM | Se Ft. King Street | 1 | 1
| 1 | 1 | - |
| 12 | Jun 22, 2003 07:51 PM | Ne 36th Ave. | 1 | 1
| 1 | 1 | - |
| 13 | Aug 1, 2003 04:52 PM | Us-441 | 1 | - | 1
| 2 | - |
| 14 | Aug 30, 2003 03:24 AM | 19th Ave Rd | 1 | 1
| 1 | 1 | - |
| 15 | Jun 24, 2003 10:20 PM | 8th Ave | 2 | - | 1
| 3 | - |
| 16 | Nov 2, 2003 06:57 PM | Sr-40 | 1 | - | 1
| 3 | 1 |
| 17 | Nov 11, 2003 06:09 AM | Sr-464 | 2 | - | 1
| 4 | - |
| 18 | Dec 21, 2003 12:49 AM | Sr-40 | 2 | - | 1
| 3 | - |
Ocala fatal car crash and road traffic accident list for 2002
- Fatal accident count11
- Vehicles involved in fatal accidents23
- Fatal accidents involving drunk persons3
- Fatalities14
- Persons involved in fatal accidents55
- Pedestrians involved in fatal accidents2
Average EMS response time
- Ocala(Based on 7 reports) 4.1 mins
- Marion County(Based on 56 reports) 6.3 mins
- Florida(Based on 2,233 reports) 7.1 mins
Dark - Lighted
- Ocala(Based on 11 reports) 54.5%
- Marion County(Based on 72 reports) 13.9%
- Florida(Based on 2,806 reports) 22.5%
Daylight
- Ocala(Based on 11 reports) 36.4%
- Marion County(Based on 72 reports) 44.4%
- Florida(Based on 2,806 reports) 45.5%
Dark - Not Lighted
- Ocala(Based on 11 reports) 9.1%
- Marion County(Based on 72 reports) 36.1%
- Florida(Based on 2,806 reports) 27.4%
Clear
- Ocala(Based on 11 reports) 81.8%
- Marion County(Based on 72 reports) 93.1%
- Florida(Based on 2,810 reports) 92.4%
Rain
- Ocala(Based on 11 reports) 18.2%
- Marion County(Based on 72 reports) 5.6%
- Florida(Based on 2,810 reports) 6.2%
| # | Date | Location | Vehicles | Drunk persons | Fatalites | Persons | Pedestrians |
|---|
| 1 | Jan 2, 2002 10:49 AM | Sr-40 | 2 | - | 1
| 3 | - |
| 2 | Feb 8, 2002 05:19 AM | Sr-200 | 2 | - | 1
| 2 | - |
| 3 | May 12, 2002 01:19 AM | Sr-200 | 1 | - | 1
| 5 | - |
| 4 | Jun 1, 2002 09:24 PM | Sr-200 | 1 | - | 1
| 9 | 1 |
| 5 | Mar 30, 2002 05:10 PM | Sr-492 | 3 | - | 1
| 6 | - |
| 6 | Aug 4, 2002 06:10 PM | Us-27 | 4 | - | 1
| 10 | - |
| 7 | May 24, 2002 05:53 AM | Sr-40 | 1 | - | 1
| 2 | 1 |
| 8 | Oct 17, 2002 10:46 PM | Martin Luther King | 1 | 1
| 3 | 3 | - |
| 9 | Nov 7, 2002 01:49 PM | Shady Rd. | 3 | 1
| 1 | 4 | - |
| 10 | Dec 5, 2002 10:46 PM | Sr-200 | 2 | 1
| 2 | 6 | - |
| 11 | Dec 6, 2002 01:47 PM | Sr-200 | 3 | - | 1
| 5 | - |
Ocala fatal car crash and road traffic accident list for 2001
- Fatal accident count14
- Vehicles involved in fatal accidents25
- Fatal accidents involving drunk persons2
- Fatalities19
- Persons involved in fatal accidents48
- Pedestrians involved in fatal accidents4
Average EMS response time
- Ocala(Based on 8 reports) 4.9 mins
- Marion County(Based on 64 reports) 9.8 mins
- Florida(Based on 2,176 reports) 7.2 mins
Daylight
- Ocala(Based on 14 reports) 64.3%
- Marion County(Based on 75 reports) 50.7%
- Florida(Based on 2,713 reports) 47.6%
Dark - Lighted
- Ocala(Based on 14 reports) 35.7%
- Marion County(Based on 75 reports) 13.3%
- Florida(Based on 2,713 reports) 21.1%
Clear
- Ocala(Based on 14 reports) 100.0%
- Marion County(Based on 75 reports) 89.3%
- Florida(Based on 2,714 reports) 91.9%
| # | Date | Location | Vehicles | Drunk persons | Fatalites | Persons | Pedestrians |
|---|
| 1 | Jun 30, 2001 01:32 PM | Us-301 | 3 | - | 1
| 6 | - |
| 2 | Jul 14, 2001 01:42 PM | I-93 | 1 | - | 3
| 4 | - |
| 3 | Aug 17, 2001 10:17 PM | Sr-200 | 2 | - | 1
| 4 | - |
| 4 | Aug 21, 2001 06:03 AM | Sw 20th St | 2 | - | 2
| 5 | - |
| 5 | Sep 4, 2001 02:10 PM | Sr-40 | 2 | - | 1
| 2 | - |
| 6 | Mar 22, 2001 08:30 AM | Nw 1st Ave | 1 | - | 1
| 2 | - |
| 7 | Sep 26, 2001 12:17 AM | Sr-492 | 1 | - | 1
| 2 | 1 |
| 8 | Oct 14, 2001 09:45 AM | I-75 | 2 | - | 2
| 3 | - |
| 9 | Apr 4, 2001 02:52 PM | Us-27 | 3 | - | 1
| 4 | - |
| 10 | Nov 5, 2001 11:35 PM | I-75 | 1 | 1
| 1 | 2 | 1 |
| 11 | Dec 7, 2001 09:18 PM | Us-1 | 1 | 1
| 1 | 4 | 1 |
| 12 | Dec 13, 2001 04:35 PM | Us-27 | 1 | - | 1
| 2 | 1 |
| 13 | Dec 14, 2001 02:27 PM | Nw 20th St | 3 | - | 2
| 5 | - |
| 14 | Dec 19, 2001 08:44 PM | Sw 60th Ave | 2 | - | 1
| 3 | - |
Ocala fatal car crash and road traffic accident list for 2000
- Fatal accident count13
- Vehicles involved in fatal accidents23
- Fatal accidents involving drunk persons2
- Fatalities13
- Persons involved in fatal accidents41
- Pedestrians involved in fatal accidents3
Average EMS response time
- Ocala(Based on 9 reports) 4.8 mins
- Marion County(Based on 62 reports) 7.9 mins
- Florida(Based on 2,177 reports) 7.3 mins
Daylight
- Ocala(Based on 13 reports) 69.2%
- Marion County(Based on 74 reports) 55.4%
- Florida(Based on 2,732 reports) 47.5%
Dark - Lighted
- Ocala(Based on 13 reports) 15.4%
- Marion County(Based on 74 reports) 5.4%
- Florida(Based on 2,732 reports) 21.8%
Dark - Not Lighted
- Ocala(Based on 13 reports) 15.4%
- Marion County(Based on 74 reports) 37.8%
- Florida(Based on 2,732 reports) 26.7%
Clear
- Ocala(Based on 13 reports) 100.0%
- Marion County(Based on 74 reports) 97.3%
- Florida(Based on 2,733 reports) 94.1%
| # | Date | Location | Vehicles | Drunk persons | Fatalites | Persons | Pedestrians |
|---|
| 1 | Jan 26, 2000 12:56 AM | Ne 24th St | 1 | - | 1
| 2 | - |
| 2 | Mar 30, 2000 10:34 AM | Sr-40 | 2 | - | 1
| 3 | - |
| 3 | Jun 29, 2000 12:10 AM | Sw 19th Ave. | 1 | - | 1
| 2 | 1 |
| 4 | Jul 6, 2000 09:41 PM | Nw 27th Ave | 1 | - | 1
| 2 | 1 |
| 5 | Aug 6, 2000 02:02 AM | Ne 36th Ave | 2 | 1
| 1 | 2 | - |
| 6 | Sep 4, 2000 03:02 PM | Sr-200 | 2 | - | 1
| 5 | - |
| 7 | Sep 10, 2000 08:30 PM | Us-27 | 1 | 1
| 1 | 3 | 1 |
| 8 | Nov 27, 2000 09:52 AM | Sr-40 | 2 | - | 1
| 2 | - |
| 9 | Dec 10, 2000 05:55 PM | Cr-464 | 3 | - | 1
| 6 | - |
| 10 | Jun 13, 2000 08:31 AM | Sr-464 | 2 | - | 1
| 2 | - |
| 11 | Jun 16, 2000 11:09 AM | Se 5th St | 2 | - | 1
| 3 | - |
| 12 | Aug 5, 2000 04:14 PM | Us-27 | 2 | - | 1
| 2 | - |
| 13 | May 8, 2000 07:09 PM | Sw 33rd Ave | 2 | - | 1
| 7 | - |
Ocala fatal car crash and road traffic accident list for 1999
- Fatal accident count8
- Vehicles involved in fatal accidents11
- Fatal accidents involving drunk persons1
- Fatalities8
- Persons involved in fatal accidents19
- Pedestrians involved in fatal accidents2
Average EMS response time
- Ocala(Based on 4 reports) 5.0 mins
- Marion County(Based on 55 reports) 7.6 mins
- Florida(Based on 2,009 reports) 7.4 mins
Daylight
- Ocala(Based on 8 reports) 62.5%
- Marion County(Based on 64 reports) 62.5%
- Florida(Based on 2,625 reports) 46.1%
Dark - Not Lighted
- Ocala(Based on 8 reports) 25.0%
- Marion County(Based on 64 reports) 31.3%
- Florida(Based on 2,625 reports) 27.2%
Dark - Lighted
- Ocala(Based on 8 reports) 12.5%
- Marion County(Based on 64 reports) 4.7%
- Florida(Based on 2,625 reports) 21.8%
Clear
- Ocala(Based on 8 reports) 100.0%
- Marion County(Based on 64 reports) 90.6%
- Florida(Based on 2,629 reports) 92.2%
| # | Date | Location | Vehicles | Drunk persons | Fatalites | Persons | Pedestrians |
|---|
| 1 | Jan 30, 1999 01:00 PM | Ne 28th St | 1 | - | 1
| 2 | 1 |
| 2 | May 24, 1999 09:23 AM | Sr-464 | 1 | - | 1
| 1 | - |
| 3 | Apr 23, 1999 12:24 AM | Sw 20th St | 2 | - | 1
| 4 | - |
| 4 | Jul 3, 1999 09:39 AM | Ne 14th Street | 1 | - | 1
| 2 | - |
| 5 | Aug 28, 1999 07:38 PM | Nw 17th Pl. | 1 | - | 1
| 2 | 1 |
| 6 | Jul 16, 1999 01:14 AM | Ne 25th Ave | 1 | - | 1
| 1 | - |
| 7 | Nov 5, 1999 06:05 PM | Cr-464 | 2 | - | 1
| 4 | - |
| 8 | Dec 31, 1999 11:24 PM | Sw 23rd Ave | 2 | 1
| 1 | 3 | - |
Ocala fatal car crash and road traffic accident list for 1998
- Fatal accident count11
- Vehicles involved in fatal accidents19
- Fatal accidents involving drunk persons3
- Fatalities11
- Persons involved in fatal accidents30
- Pedestrians involved in fatal accidents3
Average EMS response time
- Ocala(Based on 8 reports) 5.6 mins
- Marion County(Based on 50 reports) 8.9 mins
- Florida(Based on 2,014 reports) 7.1 mins
Daylight
- Ocala(Based on 11 reports) 36.4%
- Marion County(Based on 58 reports) 51.7%
- Florida(Based on 2,545 reports) 46.8%
Dark - Lighted
- Ocala(Based on 11 reports) 27.3%
- Marion County(Based on 58 reports) 6.9%
- Florida(Based on 2,545 reports) 20.5%
Dark - Not Lighted
- Ocala(Based on 11 reports) 27.3%
- Marion County(Based on 58 reports) 37.9%
- Florida(Based on 2,545 reports) 27.8%
Dusk
- Ocala(Based on 11 reports) 9.1%
- Marion County(Based on 58 reports) 1.7%
- Florida(Based on 2,545 reports) 2.3%
Clear
- Ocala(Based on 11 reports) 100.0%
- Marion County(Based on 58 reports) 84.5%
- Florida(Based on 2,548 reports) 90.5%
| # | Date | Location | Vehicles | Drunk persons | Fatalites | Persons | Pedestrians |
|---|
| 1 | May 2, 1998 01:59 AM | Sr-40 | 2 | 1
| 1 | 2 | - |
| 2 | May 8, 1998 09:05 PM | Sw 38th Ave | 2 | 1
| 1 | 2 | - |
| 3 | Jun 22, 1998 01:15 AM | Se Lake Wier Ave | 1 | 1
| 1 | 1 | - |
| 4 | Mar 4, 1998 05:42 PM | Sr-464 | 2 | - | 1
| 2 | - |
| 5 | Mar 3, 1998 02:36 PM | Sr-200 | 2 | - | 1
| 3 | - |
| 6 | Oct 11, 1998 10:12 PM | Sr-40 | 1 | - | 1
| 2 | 1 |
| 7 | Nov 10, 1998 06:37 PM | Us-27 | 2 | - | 1
| 3 | - |
| 8 | Sep 17, 1998 12:07 AM | Sr-40 | 3 | - | 1
| 5 | - |
| 9 | Nov 3, 1998 06:23 PM | Sr-40 | 1 | - | 1
| 3 | 1 |
| 10 | Nov 25, 1998 01:03 PM | Sr-40 E | 1 | - | 1
| 3 | 1 |
| 11 | Dec 26, 1998 02:00 PM | Sw 19th Ave. | 2 | - | 1
| 4 | - |
Ocala fatal car crash and road traffic accident list for 1997
- Fatal accident count8
- Vehicles involved in fatal accidents15
- Fatalities8
- Persons involved in fatal accidents21
- Pedestrians involved in fatal accidents1
Average EMS response time
- Ocala(Based on 5 reports) 5.4 mins
- Marion County(Based on 59 reports) 8.4 mins
- Florida(Based on 1,988 reports) 7.3 mins
Daylight
- Ocala(Based on 8 reports) 62.5%
- Marion County(Based on 71 reports) 53.5%
- Florida(Based on 2,522 reports) 45.8%
Dark - Lighted
- Ocala(Based on 8 reports) 37.5%
- Marion County(Based on 71 reports) 5.6%
- Florida(Based on 2,522 reports) 22.0%
Clear
- Ocala(Based on 8 reports) 100.0%
- Marion County(Based on 71 reports) 91.5%
- Florida(Based on 2,528 reports) 90.7%
| # | Date | Location | Vehicles | Drunk persons | Fatalites | Persons | Pedestrians |
|---|
| 1 | Feb 18, 1997 10:14 AM | Sr 200 | 2 | - | 1
| 2 | - |
| 2 | Apr 1, 1997 07:42 PM | Nejackson | 1 | - | 1
| 3 | 1 |
| 3 | Apr 5, 1997 02:09 PM | Maricamprd | 2 | - | 1
| 2 | - |
| 4 | Apr 4, 1997 12:59 AM | Sr 492 | 2 | - | 1
| 2 | - |
| 5 | Apr 2, 1997 08:13 PM | Sr 200 | 2 | - | 1
| 4 | - |
| 6 | Jun 3, 1997 02:23 PM | Us 301 | 2 | - | 1
| 3 | - |
| 7 | Sep 26, 1997 08:23 AM | Sr-35 | 2 | - | 1
| 3 | - |
| 8 | Dec 4, 1997 05:55 PM | Us-27 | 2 | - | 1
| 2 | - |
Ocala fatal car crash and road traffic accident list for 1996
- Fatal accident count9
- Vehicles involved in fatal accidents16
- Fatal accidents involving drunk persons1
- Fatalities9
- Persons involved in fatal accidents29
- Pedestrians involved in fatal accidents3
Average EMS response time
- Ocala(Based on 4 reports) 5.3 mins
- Marion County(Based on 34 reports) 7.5 mins
- Florida(Based on 1,947 reports) 6.9 mins
Daylight
- Ocala(Based on 9 reports) 77.8%
- Marion County(Based on 47 reports) 48.9%
- Florida(Based on 2,490 reports) 46.3%
Dark - Lighted
- Ocala(Based on 9 reports) 11.1%
- Marion County(Based on 47 reports) 4.3%
- Florida(Based on 2,490 reports) 21.8%
Dark - Not Lighted
- Ocala(Based on 9 reports) 11.1%
- Marion County(Based on 47 reports) 40.4%
- Florida(Based on 2,490 reports) 28.0%
Clear
- Ocala(Based on 9 reports) 88.9%
- Marion County(Based on 47 reports) 89.4%
- Florida(Based on 2,496 reports) 92.0%
Rain
- Ocala(Based on 9 reports) 11.1%
- Marion County(Based on 47 reports) 6.4%
- Florida(Based on 2,496 reports) 5.8%
| # | Date | Location | Vehicles | Drunk persons | Fatalites | Persons | Pedestrians |
|---|
| 1 | Jan 8, 1996 03:28 PM | Se 36 Ave. | 3 | - | 1
| 3 | - |
| 2 | Jan 10, 1996 05:28 PM | I75 | 1 | - | 1
| 1 | - |
| 3 | May 3, 1996 12:10 AM | Nw Anthony | 2 | - | 1
| 2 | - |
| 4 | Apr 27, 1996 01:00 PM | Sr500 | 1 | - | 1
| 3 | 1 |
| 5 | Apr 10, 1996 03:26 PM | Sr 40 | 3 | - | 1
| 6 | - |
| 6 | Mar 16, 1996 01:18 AM | Ne 28th St | 1 | 1
| 1 | 2 | - |
| 7 | Jul 31, 1996 04:35 PM | Sr465 | 2 | - | 1
| 2 | - |
| 8 | Jan 30, 1996 09:30 AM | Sr 40 | 1 | - | 1
| 2 | 1 |
| 9 | Sep 20, 1996 09:19 PM | Sr 464 | 2 | - | 1
| 8 | 1 |
Ocala fatal car crash and road traffic accident list for 1995
- Fatal accident count9
- Vehicles involved in fatal accidents14
- Fatal accidents involving drunk persons3
- Fatalities10
- Persons involved in fatal accidents19
- Pedestrians involved in fatal accidents2
Average EMS response time
- Ocala(Based on 5 reports) 4.6 mins
- Marion County(Based on 59 reports) 9.3 mins
- Florida(Based on 2,034 reports) 7.1 mins
Dark - Lighted
- Ocala(Based on 9 reports) 33.3%
- Marion County(Based on 69 reports) 5.8%
- Florida(Based on 2,533 reports) 22.6%
Daylight
- Ocala(Based on 9 reports) 33.3%
- Marion County(Based on 69 reports) 37.7%
- Florida(Based on 2,533 reports) 43.7%
Dark - Not Lighted
- Ocala(Based on 9 reports) 22.2%
- Marion County(Based on 69 reports) 44.9%
- Florida(Based on 2,533 reports) 29.9%
Dawn
- Ocala(Based on 9 reports) 11.1%
- Marion County(Based on 69 reports) 4.3%
- Florida(Based on 2,533 reports) 1.5%
Clear
- Ocala(Based on 9 reports) 77.8%
- Marion County(Based on 69 reports) 84.1%
- Florida(Based on 2,546 reports) 90.7%
Fog, Smog, Smoke
- Ocala(Based on 9 reports) 11.1%
- Marion County(Based on 69 reports) 5.8%
- Florida(Based on 2,546 reports) 1.2%
Rain
- Ocala(Based on 9 reports) 11.1%
- Marion County(Based on 69 reports) 10.1%
- Florida(Based on 2,546 reports) 7.6%
| # | Date | Location | Vehicles | Drunk persons | Fatalites | Persons | Pedestrians |
|---|
| 1 | Jan 25, 1995 08:38 PM | Sr 500 | 1 | - | 2
| 3 | 2 |
| 2 | Jan 17, 1995 07:35 PM | Sr 25 | 3 | - | 1
| 5 | - |
| 3 | Apr 11, 1995 01:32 AM | Nw 28 St | 1 | 1
| 1 | 1 | - |
| 4 | Feb 12, 1995 11:57 AM | E Sr 40 | 2 | - | 1
| 2 | - |
| 5 | Jun 8, 1995 05:54 PM | Cr 475 | 1 | 1
| 1 | 1 | - |
| 6 | Oct 25, 1995 08:52 PM | Old Blitch | 2 | - | 1
| 3 | - |
| 7 | Oct 27, 1995 09:09 PM | Sr 200 | 1 | 1
| 1 | 1 | - |
| 8 | Oct 13, 1995 07:02 AM | E Sr 40 | 2 | - | 1
| 2 | - |
| 9 | Dec 19, 1995 11:47 AM | I75 | 1 | - | 1
| 1 | - |
Ocala fatal car crash and road traffic accident list for 1994
- Fatal accident count9
- Vehicles involved in fatal accidents13
- Fatal accidents involving drunk persons3
- Fatalities9
- Persons involved in fatal accidents27
- Pedestrians involved in fatal accidents6
Average EMS response time
- Ocala(Based on 7 reports) 4.0 mins
- Marion County(Based on 50 reports) 7.8 mins
- Florida(Based on 1,945 reports) 7.0 mins
Dark - Lighted
- Ocala(Based on 8 reports) 62.5%
- Marion County(Based on 53 reports) 15.1%
- Florida(Based on 2,408 reports) 22.6%
Daylight
- Ocala(Based on 8 reports) 25.0%
- Marion County(Based on 53 reports) 37.7%
- Florida(Based on 2,408 reports) 45.1%
Dawn
- Ocala(Based on 8 reports) 12.5%
- Marion County(Based on 53 reports) 1.9%
- Florida(Based on 2,408 reports) 2.1%
Clear
- Ocala(Based on 9 reports) 88.9%
- Marion County(Based on 54 reports) 90.7%
- Florida(Based on 2,419 reports) 90.3%
Fog, Smog, Smoke
- Ocala(Based on 9 reports) 11.1%
- Marion County(Based on 54 reports) 7.4%
- Florida(Based on 2,419 reports) 2.1%
| # | Date | Location | Vehicles | Drunk persons | Fatalites | Persons | Pedestrians |
|---|
| 1 | Feb 13, 1994 08:46 PM | Sr200 | 1 | 1
| 1 | 3 | 1 |
| 2 | May 4, 1994 09:48 PM | Sr40 | 1 | 1
| 1 | 2 | 1 |
| 3 | Jun 9, 1994 05:45 AM | Sr464 | 1 | 1
| 1 | 2 | 1 |
| 4 | May 5, 1994 03:11 PM | Cr464 | 2 | - | 1
| 5 | - |
| 5 | Oct 19, 1994 07:13 AM | Sr500 | 2 | - | 1
| 3 | - |
| 6 | Nov 27, 1994 10:38 AM | Sw 27 Ave | 2 | - | 1
| 3 | - |
| 7 | Nov 5, 1994 07:18 PM | Sr 200 | 1 | - | 1
| 3 | 2 |
| 8 | Dec 4, 1994 03:11 AM | Sr 25 | 1 | - | 1
| 2 | 1 |
| 9 | Dec 19, 1994 06:49 PM | Sr200 | 2 | - | 1
| 4 | - |
Ocala fatal car crash and road traffic accident list for 1993
- Fatal accident count7
- Vehicles involved in fatal accidents10
- Fatal accidents involving drunk persons1
- Fatalities7
- Persons involved in fatal accidents16
- Pedestrians involved in fatal accidents3
Average EMS response time
- Ocala(Based on 5 reports) 3.0 mins
- Marion County(Based on 65 reports) 9.9 mins
- Florida(Based on 1,957 reports) 7.5 mins
Dark - Lighted
- Ocala(Based on 7 reports) 57.1%
- Marion County(Based on 71 reports) 5.6%
- Florida(Based on 2,360 reports) 21.4%
Daylight
- Ocala(Based on 7 reports) 42.9%
- Marion County(Based on 71 reports) 47.9%
- Florida(Based on 2,360 reports) 42.9%
Clear
- Ocala(Based on 7 reports) 85.7%
- Marion County(Based on 71 reports) 85.9%
- Florida(Based on 2,376 reports) 91.2%
Rain
- Ocala(Based on 7 reports) 14.3%
- Marion County(Based on 71 reports) 9.9%
- Florida(Based on 2,376 reports) 6.7%
| # | Date | Location | Vehicles | Drunk persons | Fatalites | Persons | Pedestrians |
|---|
| 1 | Mar 2, 1993 09:49 AM | Sr464 | 2 | - | 1
| 2 | - |
| 2 | Jun 27, 1993 02:36 AM | Sw20-Stree | 1 | 1
| 1 | 1 | - |
| 3 | Jul 5, 1993 09:25 PM | Sr200 | 1 | - | 1
| 3 | 1 |
| 4 | Jun 2, 1993 03:18 PM | Ne24.Stree | 1 | - | 1
| 3 | 1 |
| 5 | Nov 13, 1993 07:49 PM | Sr40 | 1 | - | 1
| 3 | 1 |
| 6 | Nov 20, 1993 09:34 AM | Sr464 | 2 | - | 1
| 2 | - |
| 7 | Dec 20, 1993 06:08 PM | Ne24street | 2 | - | 1
| 2 | - |
Ocala fatal car crash and road traffic accident list for 1992
- Fatal accident count6
- Vehicles involved in fatal accidents10
- Fatal accidents involving drunk persons1
- Fatalities6
- Persons involved in fatal accidents17
- Pedestrians involved in fatal accidents1
Average EMS response time
- Ocala(Based on 3 reports) 3.0 mins
- Marion County(Based on 49 reports) 9.0 mins
- Florida(Based on 1,775 reports) 7.2 mins
Daylight
- Ocala(Based on 6 reports) 83.3%
- Marion County(Based on 57 reports) 54.4%
- Florida(Based on 2,161 reports) 43.6%
Dark - Lighted
- Ocala(Based on 6 reports) 16.7%
- Marion County(Based on 57 reports) 5.3%
- Florida(Based on 2,161 reports) 21.8%
Clear
- Ocala(Based on 6 reports) 100.0%
- Marion County(Based on 57 reports) 91.2%
- Florida(Based on 2,170 reports) 90.4%
| # | Date | Location | Vehicles | Drunk persons | Fatalites | Persons | Pedestrians |
|---|
| 1 | Jan 9, 1992 03:22 PM | Sr200 | 2 | - | 1
| 3 | - |
| 2 | Jun 10, 1992 01:55 AM | Sr40 | 2 | 1
| 1 | 3 | - |
| 3 | May 8, 1992 01:36 PM | Ne14thst | 2 | - | 1
| 2 | - |
| 4 | May 19, 1992 02:43 PM | Sw17thave | 1 | - | 1
| 1 | - |
| 5 | Jul 24, 1992 06:16 PM | Se30ave | 2 | - | 1
| 6 | - |
| 6 | Nov 12, 1992 08:25 AM | Se14ave | 1 | - | 1
| 2 | 1 |
Ocala fatal car crash and road traffic accident list for 1991
- Fatal accident count13
- Vehicles involved in fatal accidents21
- Fatal accidents involving drunk persons6
- Fatalities15
- Persons involved in fatal accidents29
- Pedestrians involved in fatal accidents4
Average EMS response time
- Ocala(Based on 11 reports) 7.5 mins
- Marion County(Based on 44 reports) 12.8 mins
- Florida(Based on 1,837 reports) 7.3 mins
Daylight
- Ocala(Based on 13 reports) 53.8%
- Marion County(Based on 53 reports) 50.9%
- Florida(Based on 2,215 reports) 41.5%
Dark - Lighted
- Ocala(Based on 13 reports) 23.1%
- Marion County(Based on 53 reports) 5.7%
- Florida(Based on 2,215 reports) 23.5%
Dark - Not Lighted
- Ocala(Based on 13 reports) 23.1%
- Marion County(Based on 53 reports) 39.6%
- Florida(Based on 2,215 reports) 30.9%
Clear
- Ocala(Based on 13 reports) 76.9%
- Marion County(Based on 54 reports) 87.0%
- Florida(Based on 2,217 reports) 87.5%
Rain
- Ocala(Based on 13 reports) 15.4%
- Marion County(Based on 54 reports) 5.6%
- Florida(Based on 2,217 reports) 9.2%
Fog, Smog, Smoke
- Ocala(Based on 13 reports) 7.7%
- Marion County(Based on 54 reports) 7.4%
- Florida(Based on 2,217 reports) 1.9%
| # | Date | Location | Vehicles | Drunk persons | Fatalites | Persons | Pedestrians |
|---|
| 1 | Feb 6, 1991 00:40 AM | Sr500 | 1 | 1
| 1 | 1 | - |
| 2 | Mar 3, 1991 12:38 AM | Ne3rd-St | 1 | 1
| 1 | 1 | - |
| 3 | Mar 30, 1991 07:35 AM | I75 | 1 | - | 1
| 2 | - |
| 4 | Apr 25, 1991 03:00 PM | Martinluth | 2 | - | 1
| 3 | - |
| 5 | Jul 15, 1991 03:39 PM | Semaricame | 2 | - | 2
| 3 | - |
| 6 | Jul 29, 1991 02:02 AM | Sr200 | 1 | - | 1
| 2 | 1 |
| 7 | Jul 23, 1991 01:06 PM | Nw17thplac | 1 | - | 1
| 2 | 1 |
| 8 | Sep 29, 1991 02:41 AM | Ne36thave | 1 | 1
| 1 | 2 | - |
| 9 | Oct 5, 1991 03:50 PM | Sr200 | 2 | - | 1
| 2 | - |
| 10 | Oct 26, 1991 03:00 AM | Se38st | 1 | 1
| 1 | 1 | - |
| 11 | Oct 31, 1991 07:00 AM | I75 | 1 | - | 2
| 3 | - |
| 12 | Nov 30, 1991 06:03 PM | Nw10thst | 3 | 1
| 1 | 3 | 2 |
| 13 | Dec 6, 1991 11:40 PM | I75 | 4 | 1
| 1 | 4 | - |
Ocala fatal car crash and road traffic accident list for 1990
- Fatal accident count12
- Vehicles involved in fatal accidents23
- Fatal accidents involving drunk persons7
- Fatalities13
- Persons involved in fatal accidents42
Average EMS response time
- Ocala(Based on 8 reports) 4.1 mins
- Marion County(Based on 67 reports) 10.7 mins
- Florida(Based on 2,100 reports) 7.5 mins
Dark - Lighted
- Ocala(Based on 12 reports) 50.0%
- Marion County(Based on 75 reports) 8.0%
- Florida(Based on 2,577 reports) 22.9%
Daylight
- Ocala(Based on 12 reports) 41.7%
- Marion County(Based on 75 reports) 40.0%
- Florida(Based on 2,577 reports) 41.7%
Dark - Not Lighted
- Ocala(Based on 12 reports) 8.3%
- Marion County(Based on 75 reports) 45.3%
- Florida(Based on 2,577 reports) 31.4%
Clear
- Ocala(Based on 12 reports) 83.3%
- Marion County(Based on 75 reports) 85.3%
- Florida(Based on 2,586 reports) 91.0%
Rain
- Ocala(Based on 12 reports) 16.7%
- Marion County(Based on 75 reports) 6.7%
- Florida(Based on 2,586 reports) 6.7%
| # | Date | Location | Vehicles | Drunk persons | Fatalites | Persons | Pedestrians |
|---|
| 1 | Jan 2, 1990 00:26 AM | Sr 200 | 2 | 1
| 2 | 3 | - |
| 2 | Jan 30, 1990 06:45 PM | Npine | 2 | 1
| 1 | 4 | - |
| 3 | Apr 18, 1990 00:31 AM | Sr500 | 1 | 1
| 1 | 1 | - |
| 4 | May 5, 1990 02:46 PM | Sr 40 | 2 | - | 1
| 3 | - |
| 5 | Jun 7, 1990 02:40 AM | Ne14thst | 2 | 2
| 1 | 5 | - |
| 6 | Aug 10, 1990 09:29 PM | Sr-200 | 3 | 1
| 1 | 7 | - |
| 7 | Jul 31, 1990 09:39 PM | Sr25 | 2 | 1
| 1 | 3 | - |
| 8 | Aug 14, 1990 02:42 PM | Sw-Martinl | 2 | - | 1
| 4 | - |
| 9 | Aug 27, 1990 04:31 PM | Sr-40 | 1 | - | 1
| 3 | - |
| 10 | Apr 23, 1990 03:45 PM | Ne-36-Ave | 2 | - | 1
| 2 | - |
| 11 | Oct 20, 1990 11:50 AM | Sr-40 | 2 | - | 1
| 3 | - |
| 12 | Dec 24, 1990 10:18 PM | Cr-464 | 2 | - | 1
| 4 | - |
Ocala fatal car crash and road traffic accident list for 1989
- Fatal accident count9
- Vehicles involved in fatal accidents14
- Fatal accidents involving drunk persons8
- Fatalities12
- Persons involved in fatal accidents32
Average EMS response time
- Ocala(Based on 7 reports) 5.0 mins
- Marion County(Based on 53 reports) 9.5 mins
- Florida(Based on 2,202 reports) 7.2 mins
Daylight
- Ocala(Based on 9 reports) 44.4%
- Marion County(Based on 57 reports) 38.6%
- Florida(Based on 2,673 reports) 40.0%
Dark - Lighted
- Ocala(Based on 9 reports) 33.3%
- Marion County(Based on 57 reports) 5.3%
- Florida(Based on 2,673 reports) 22.9%
Dark - Not Lighted
- Ocala(Based on 9 reports) 22.2%
- Marion County(Based on 57 reports) 56.1%
- Florida(Based on 2,673 reports) 33.0%
Clear
- Ocala(Based on 9 reports) 100.0%
- Marion County(Based on 57 reports) 86.0%
- Florida(Based on 2,685 reports) 90.0%
| # | Date | Location | Vehicles | Drunk persons | Fatalites | Persons | Pedestrians |
|---|
| 1 | Jun 14, 1989 01:42 PM | Sr200 | 2 | 1
| 1 | 3 | - |
| 2 | Aug 4, 1989 08:20 PM | Sw66thst | 1 | 1
| 1 | 1 | - |
| 3 | Aug 4, 1989 01:55 AM | Se31stst | 1 | 1
| 2 | 2 | - |
| 4 | Jul 13, 1989 04:39 PM | Sr40 | 2 | - | 1
| 6 | - |
| 5 | Oct 2, 1989 01:05 AM | Sr 200 | 2 | 2
| 1 | 7 | - |
| 6 | Oct 8, 1989 05:55 PM | I75-Sr93 | 2 | 2
| 3 | 4 | - |
| 7 | Oct 21, 1989 08:39 PM | Staterd200 | 1 | 1
| 1 | 5 | - |
| 8 | Oct 4, 1989 04:24 PM | Ne Jackson | 1 | - | 1
| 2 | - |
| 9 | Nov 21, 1989 12:31 AM | Sr 40 East | 2 | - | 1
| 2 | - |
Ocala fatal car crash and road traffic accident list for 1988
- Fatal accident count13
- Vehicles involved in fatal accidents23
- Fatal accidents involving drunk persons11
- Fatalities14
- Persons involved in fatal accidents35
Average EMS response time
- Ocala(Based on 8 reports) 7.1 mins
- Marion County(Based on 53 reports) 10.0 mins
- Florida(Based on 2,235 reports) 7.3 mins
Daylight
- Ocala(Based on 13 reports) 46.2%
- Marion County(Based on 61 reports) 49.2%
- Florida(Based on 2,744 reports) 42.4%
Dark - Not Lighted
- Ocala(Based on 13 reports) 23.1%
- Marion County(Based on 61 reports) 36.1%
- Florida(Based on 2,744 reports) 33.6%
Dark - Lighted
- Ocala(Based on 13 reports) 23.1%
- Marion County(Based on 61 reports) 11.5%
- Florida(Based on 2,744 reports) 20.6%
Dawn
- Ocala(Based on 13 reports) 7.7%
- Marion County(Based on 61 reports) 1.6%
- Florida(Based on 2,744 reports) 1.7%
Clear
- Ocala(Based on 13 reports) 84.6%
- Marion County(Based on 61 reports) 80.3%
- Florida(Based on 2,758 reports) 89.6%
Rain
- Ocala(Based on 13 reports) 15.4%
- Marion County(Based on 61 reports) 18.0%
- Florida(Based on 2,758 reports) 7.8%
| # | Date | Location | Vehicles | Drunk persons | Fatalites | Persons | Pedestrians |
|---|
| 1 | Jan 25, 1988 07:31 PM | Sr 200 | 2 | 1
| 1 | 2 | - |
| 2 | Feb 6, 1988 10:40 PM | Sr200 | 2 | 2
| 2 | 7 | - |
| 3 | Feb 26, 1988 06:23 PM | Ne28thst | 2 | 1
| 1 | 2 | - |
| 4 | May 11, 1988 07:05 PM | Nw10thplac | 2 | - | 1
| 2 | - |
| 5 | May 24, 1988 11:15 PM | Sr93 | 2 | 2
| 1 | 3 | - |
| 6 | Jun 3, 1988 12:40 AM | Sw.10thst. | 1 | - | 1
| 3 | - |
| 7 | Apr 20, 1988 12:49 AM | Sr 25 | 1 | - | 1
| 2 | - |
| 8 | May 16, 1988 10:12 AM | Sr 40 E | 2 | - | 1
| 3 | - |
| 9 | Jul 8, 1988 05:55 AM | Sr25 | 1 | 1
| 1 | 2 | - |
| 10 | Oct 11, 1988 11:15 PM | Sr 40 | 3 | 1
| 1 | 3 | - |
| 11 | Aug 29, 1988 05:45 PM | State-Rd45 | 1 | - | 1
| 2 | - |
| 12 | Oct 16, 1988 11:30 PM | Cr436 | 2 | 1
| 1 | 2 | - |
| 13 | Nov 19, 1988 01:00 AM | Sr500 | 2 | 2
| 1 | 2 | - |
Ocala fatal car crash and road traffic accident list for 1987
- Fatal accident count12
- Vehicles involved in fatal accidents21
- Fatal accidents involving drunk persons8
- Fatalities14
- Persons involved in fatal accidents50
Average EMS response time
- Ocala(Based on 10 reports) 4.4 mins
- Marion County(Based on 50 reports) 9.7 mins
- Florida(Based on 2,134 reports) 7.4 mins
Dark - Lighted
- Ocala(Based on 12 reports) 41.7%
- Marion County(Based on 57 reports) 12.3%
- Florida(Based on 2,559 reports) 21.6%
Daylight
- Ocala(Based on 12 reports) 33.3%
- Marion County(Based on 57 reports) 47.4%
- Florida(Based on 2,559 reports) 41.3%
Dark - Not Lighted
- Ocala(Based on 12 reports) 25.0%
- Marion County(Based on 57 reports) 36.8%
- Florida(Based on 2,559 reports) 32.9%
Clear
- Ocala(Based on 12 reports) 91.7%
- Marion County(Based on 57 reports) 93.0%
- Florida(Based on 2,572 reports) 87.4%
Fog, Smog, Smoke
- Ocala(Based on 12 reports) 8.3%
- Marion County(Based on 57 reports) 1.8%
- Florida(Based on 2,572 reports) 2.0%
| # | Date | Location | Vehicles | Drunk persons | Fatalites | Persons | Pedestrians |
|---|
| 1 | Jan 7, 1987 12:58 AM | Sr 25 | 3 | - | 1
| 7 | - |
| 2 | Mar 6, 1987 07:02 PM | Sr 40 | 1 | 1
| 1 | 4 | - |
| 3 | Mar 14, 1987 01:58 AM | Nw 16th Av | 1 | - | 1
| 2 | - |
| 4 | Sep 8, 1987 10:14 AM | Sr25 | 2 | 1
| 2 | 3 | - |
| 5 | Sep 25, 1987 08:17 PM | Sr 40 | 1 | 1
| 1 | 2 | - |
| 6 | Oct 3, 1987 08:54 PM | Sr200 | 1 | 1
| 1 | 2 | - |
| 7 | Oct 9, 1987 08:35 PM | Ne 8 Rd | 1 | 1
| 1 | 3 | - |
| 8 | Oct 16, 1987 01:53 AM | Sr 200 | 1 | 1
| 1 | 2 | - |
| 9 | Oct 24, 1987 02:34 PM | 17thstcr48 | 2 | - | 1
| 4 | - |
| 10 | Nov 28, 1987 06:55 PM | Sr200 | 1 | - | 1
| 2 | - |
| 11 | Dec 21, 1987 10:10 PM | Cr40 | 1 | 1
| 2 | 2 | - |
| 12 | Dec 28, 1987 04:55 PM | Sr 93 I75 | 6 | 1
| 1 | 17 | - |
Ocala fatal car crash and road traffic accident list for 1986
- Fatal accident count13
- Vehicles involved in fatal accidents22
- Fatal accidents involving drunk persons6
- Fatalities15
- Persons involved in fatal accidents34
Average EMS response time
- Ocala(Based on 7 reports) 8.0 mins
- Marion County(Based on 53 reports) 12.0 mins
- Florida(Based on 1,747 reports) 8.2 mins
Daylight
- Ocala(Based on 13 reports) 69.2%
- Marion County(Based on 65 reports) 43.1%
- Florida(Based on 2,533 reports) 40.7%
Dark - Lighted
- Ocala(Based on 13 reports) 23.1%
- Marion County(Based on 65 reports) 7.7%
- Florida(Based on 2,533 reports) 19.1%
Dark - Not Lighted
- Ocala(Based on 13 reports) 7.7%
- Marion County(Based on 65 reports) 44.6%
- Florida(Based on 2,533 reports) 35.0%
Clear
- Ocala(Based on 13 reports) 92.3%
- Marion County(Based on 65 reports) 90.8%
- Florida(Based on 2,541 reports) 86.6%
Rain
- Ocala(Based on 13 reports) 7.7%
- Marion County(Based on 65 reports) 7.7%
- Florida(Based on 2,541 reports) 10.9%
| # | Date | Location | Vehicles | Drunk persons | Fatalites | Persons | Pedestrians |
|---|
| 1 | Jan 31, 1986 11:40 AM | Cr40 | 1 | - | 1
| 1 | - |
| 2 | Feb 10, 1986 01:11 PM | Sr25 | 2 | - | 1
| 2 | - |
| 3 | Feb 10, 1986 05:35 PM | Sr200 | 2 | - | 1
| 2 | - |
| 4 | Feb 24, 1986 04:15 PM | 93 | 2 | 2
| 1 | 2 | - |
| 5 | Mar 8, 1986 12:48 AM | Sw20street | 1 | 1
| 1 | 1 | - |
| 6 | Mar 29, 1986 02:02 AM | Sr200 | 1 | 1
| 1 | 1 | - |
| 7 | Mar 23, 1986 04:11 PM | Sw9avenue | 1 | - | 1
| 3 | - |
| 8 | Apr 16, 1986 12:12 AM | Se17thstre | 2 | - | 1
| 3 | - |
| 9 | Jun 28, 1986 10:38 PM | Sr200 | 1 | - | 1
| 2 | - |
| 10 | Jul 21, 1986 06:31 AM | Sw34thave | 2 | - | 1
| 3 | - |
| 11 | Aug 26, 1986 00:05 AM | Sr25 | 3 | 2
| 3 | 8 | - |
| 12 | Oct 26, 1986 07:12 PM | Sr25 | 2 | - | 1
| 3 | - |
| 13 | Nov 20, 1986 03:39 PM | Sr40 | 2 | - | 1
| 3 | - |
Ocala fatal car crash and road traffic accident list for 1985
- Fatal accident count18
- Vehicles involved in fatal accidents28
- Fatal accidents involving drunk persons10
- Fatalities21
- Persons involved in fatal accidents48
Average EMS response time
- Ocala(Based on 17 reports) 8.0 mins
- Marion County(Based on 39 reports) 11.2 mins
- Florida(Based on 2,321 reports) 6.5 mins
Dark - Not Lighted
- Ocala(Based on 18 reports) 50.0%
- Marion County(Based on 41 reports) 48.8%
- Florida(Based on 2,546 reports) 33.4%
Daylight
- Ocala(Based on 18 reports) 33.3%
- Marion County(Based on 41 reports) 34.1%
- Florida(Based on 2,546 reports) 40.0%
Dark - Lighted
- Ocala(Based on 18 reports) 16.7%
- Marion County(Based on 41 reports) 12.2%
- Florida(Based on 2,546 reports) 23.2%
Clear
- Ocala(Based on 18 reports) 83.3%
- Marion County(Based on 41 reports) 82.9%
- Florida(Based on 2,547 reports) 86.6%
Rain
- Ocala(Based on 18 reports) 16.7%
- Marion County(Based on 41 reports) 14.6%
- Florida(Based on 2,547 reports) 11.6%
| # | Date | Location | Vehicles | Drunk persons | Fatalites | Persons | Pedestrians |
|---|
| 1 | Jan 3, 1985 05:50 PM | Ne25> | 2 | - | 1
| 2 | - |
| 2 | Jan 19, 1985 04:30 AM | 75 | 2 | 1
| 1 | 2 | - |
| 3 | Feb 14, 1985 02:37 PM | 200 | 1 | - | 1
| 1 | - |
| 4 | May 17, 1985 11:05 AM | 40 | 2 | - | 2
| 3 | - |
| 5 | Apr 20, 1985 10:10 PM | Sw27thaven | 1 | 1
| 1 | 3 | - |
| 6 | Jun 23, 1985 12:25 AM | 35 | 2 | - | 1
| 3 | - |
| 7 | Jun 17, 1985 09:00 PM | 25 | 1 | - | 1
| 3 | - |
| 8 | Jul 7, 1985 08:15 AM | Ne40thaven | 1 | 1
| 1 | 2 | - |
| 9 | Jul 16, 1985 10:00 PM | Se38thstre | 1 | 1
| 1 | 1 | - |
| 10 | Jul 20, 1985 07:25 PM | 40 | 1 | 1
| 3 | 4 | - |
| 11 | Aug 17, 1985 11:10 PM | 25 | 1 | - | 1
| 2 | - |
| 12 | Sep 9, 1985 09:32 PM | 200 | 1 | - | 1
| 3 | - |
| 13 | Aug 24, 1985 00:42 AM | 40e | 2 | 1
| 1 | 2 | - |
| 14 | Sep 20, 1985 08:02 PM | 25 | 2 | 1
| 1 | 4 | - |
| 15 | Oct 14, 1985 01:32 PM | Ne36thaven | 3 | 1
| 1 | 5 | - |
| 16 | Sep 12, 1985 00:01 AM | Fortkingbl | 1 | 1
| 1 | 1 | - |
| 17 | Dec 5, 1985 06:25 AM | 93 | 2 | - | 1
| 4 | - |
| 18 | Dec 28, 1985 03:00 AM | 25 | 2 | 1
| 1 | 3 | - |
Ocala fatal car crash and road traffic accident list for 1984
- Fatal accident count40
- Vehicles involved in fatal accidents57
- Fatal accidents involving drunk persons19
- Fatalities43
- Persons involved in fatal accidents117
Average EMS response time
- Ocala(Based on 36 reports) 9.3 mins
- Marion County(Based on 65 reports) 11.0 mins
- Florida(Based on 2,332 reports) 6.5 mins
Dark - Not Lighted
- Ocala(Based on 40 reports) 47.5%
- Marion County(Based on 71 reports) 52.1%
- Florida(Based on 2,549 reports) 33.9%
Daylight
- Ocala(Based on 40 reports) 35.0%
- Marion County(Based on 71 reports) 33.8%
- Florida(Based on 2,549 reports) 39.6%
Dark - Lighted
- Ocala(Based on 40 reports) 15.0%
- Marion County(Based on 71 reports) 9.9%
- Florida(Based on 2,549 reports) 22.3%
Dawn
- Ocala(Based on 40 reports) 2.5%
- Marion County(Based on 71 reports) 4.2%
- Florida(Based on 2,549 reports) 2.0%
Clear
- Ocala(Based on 40 reports) 82.5%
- Marion County(Based on 71 reports) 85.9%
- Florida(Based on 2,551 reports) 87.2%
Rain
- Ocala(Based on 40 reports) 10.0%
- Marion County(Based on 71 reports) 8.5%
- Florida(Based on 2,551 reports) 9.5%
Fog, Smog, Smoke
- Ocala(Based on 40 reports) 7.5%
- Marion County(Based on 71 reports) 5.6%
- Florida(Based on 2,551 reports) 2.3%
| # | Date | Location | Vehicles | Drunk persons | Fatalites | Persons | Pedestrians |
|---|
| 1 | Jan 15, 1984 11:20 PM | 200a | 1 | - | 1
| 2 | - |
| 2 | Feb 12, 1984 04:00 AM | 464a | 1 | 1
| 1 | 1 | - |
| 3 | Mar 4, 1984 11:15 AM | 93 | 1 | - | 1
| 2 | - |
| 4 | Mar 10, 1984 03:40 AM | 500 | 1 | 1
| 1 | 1 | - |
| 5 | Mar 15, 1984 07:30 PM | Ne49thstex | 1 | 1
| 1 | 5 | - |
| 6 | Mar 3, 1984 08:05 PM | 93 | 1 | 1
| 1 | 1 | - |
| 7 | Mar 25, 1984 05:45 AM | 93 | 2 | 1
| 1 | 3 | - |
| 8 | Apr 1, 1984 07:40 PM | 326 | 1 | 1
| 1 | 6 | - |
| 9 | Apr 15, 1984 03:20 AM | Ne35street | 1 | 1
| 1 | 1 | - |
| 10 | Mar 30, 1984 10:50 AM | Selakewera | 2 | - | 1
| 2 | - |
| 11 | Apr 21, 1984 02:00 AM | 75 | 1 | - | 1
| 5 | - |
| 12 | Jan 16, 1984 06:00 PM | 40 | 2 | 1
| 1 | 2 | - |
| 13 | May 16, 1984 02:31 AM | 40 | 1 | - | 1
| 1 | - |
| 14 | Feb 10, 1984 02:33 PM | 500 | 2 | - | 1
| 3 | - |
| 15 | Jul 16, 1984 01:30 AM | 484 | 1 | - | 1
| 1 | - |
| 16 | Aug 15, 1984 02:00 AM | 200a | 2 | 1
| 2 | 3 | - |
| 17 | Aug 21, 1984 01:30 PM | 200 | 2 | - | 1
| 4 | - |
| 18 | Aug 10, 1984 02:52 PM | 25 | 2 | - | 1
| 5 | - |
| 19 | Aug 29, 1984 11:00 AM | Se52ndstre | 2 | - | 1
| 2 | - |
| 20 | Aug 18, 1984 00:35 AM | 200a | 1 | 1
| 2 | 3 | - |
| 21 | Sep 6, 1984 02:30 AM | 500 | 1 | 1
| 1 | 1 | - |
| 22 | Jul 25, 1984 05:04 AM | 500 | 2 | 1
| 1 | 2 | - |
| 23 | Aug 21, 1984 01:00 PM | 75 | 2 | - | 1
| 8 | - |
| 24 | Aug 25, 1984 08:30 PM | 93 | 2 | 1
| 2 | 5 | - |
| 25 | Oct 9, 1984 06:30 AM | Sw37avenue | 1 | - | 1
| 4 | - |
| 26 | Oct 11, 1984 02:00 AM | Nw27thaven | 1 | - | 1
| 1 | - |
| 27 | Oct 13, 1984 11:40 AM | 40 | 2 | 1
| 1 | 5 | - |
| 28 | Oct 21, 1984 01:07 AM | 25 | 1 | - | 1
| 3 | - |
| 29 | Oct 16, 1984 05:50 AM | 40 | 1 | - | 1
| 4 | - |
| 30 | Nov 21, 1984 10:10 PM | 25 | 1 | 1
| 1 | 1 | - |
| 31 | Nov 22, 1984 08:00 PM | 35 | 2 | 2
| 1 | 3 | - |
| 32 | Nov 24, 1984 05:15 PM | 40 | 3 | 1
| 1 | 6 | - |
| 33 | Nov 16, 1984 11:26 PM | 25 | 1 | - | 1
| 3 | - |
| 34 | Nov 25, 1984 06:15 PM | 40 | 2 | - | 1
| 3 | - |
| 35 | Dec 16, 1984 11:00 AM | 25 | 1 | 1
| 1 | 4 | - |
| 36 | Dec 20, 1984 06:38 AM | 25 | 2 | - | 1
| 3 | - |
| 37 | Dec 12, 1984 10:20 AM | 464 | 1 | - | 1
| 1 | - |
| 38 | Nov 18, 1984 02:26 PM | Se29terr | 1 | - | 1
| 3 | - |
| 39 | Aug 15, 1984 03:21 PM | Sr40east | 1 | - | 1
| 2 | - |
| 40 | May 29, 1984 11:30 AM | 40 | 1 | - | 1
| 2 | - |
Ocala fatal car crash and road traffic accident list for 1983
- Fatal accident count33
- Vehicles involved in fatal accidents67
- Fatal accidents involving drunk persons12
- Fatalities37
- Persons involved in fatal accidents131
Average EMS response time
- Ocala(Based on 32 reports) 6.7 mins
- Marion County(Based on 70 reports) 9.3 mins
- Florida(Based on 2,180 reports) 6.6 mins
Dark - Not Lighted
- Ocala(Based on 33 reports) 42.4%
- Marion County(Based on 72 reports) 54.2%
- Florida(Based on 2,410 reports) 37.5%
Daylight
- Ocala(Based on 33 reports) 36.4%
- Marion County(Based on 72 reports) 29.2%
- Florida(Based on 2,410 reports) 36.9%
Dark - Lighted
- Ocala(Based on 33 reports) 18.2%
- Marion County(Based on 72 reports) 9.7%
- Florida(Based on 2,410 reports) 21.6%
Dawn
- Ocala(Based on 33 reports) 3.0%
- Marion County(Based on 72 reports) 1.4%
- Florida(Based on 2,410 reports) 1.7%
Clear
- Ocala(Based on 33 reports) 84.8%
- Marion County(Based on 72 reports) 81.9%
- Florida(Based on 2,415 reports) 85.8%
Rain
- Ocala(Based on 33 reports) 9.1%
- Marion County(Based on 72 reports) 11.1%
- Florida(Based on 2,415 reports) 12.6%
Fog, Smog, Smoke
- Ocala(Based on 33 reports) 6.1%
- Marion County(Based on 72 reports) 6.9%
- Florida(Based on 2,415 reports) 1.2%
| # | Date | Location | Vehicles | Drunk persons | Fatalites | Persons | Pedestrians |
|---|
| 1 | Jan 20, 1983 08:20 PM | 500 | 2 | - | 1
| 4 | - |
| 2 | Jan 22, 1983 04:46 PM | Nw4thst | 1 | - | 1
| 2 | - |
| 3 | Jan 26, 1983 11:15 PM | 93 | 1 | 1
| 1 | 2 | - |
| 4 | Feb 6, 1983 09:42 PM | 500 | 1 | - | 1
| 2 | - |
| 5 | Feb 14, 1983 11:00 PM | Se17thst | 1 | - | 1
| 1 | - |
| 6 | Feb 14, 1983 08:30 PM | 40 | 1 | - | 1
| 2 | - |
| 7 | Feb 28, 1983 02:00 PM | 93 | 22 | - | 4
| 48 | - |
| 8 | Mar 24, 1983 01:50 AM | 35 | 1 | 1
| 1 | 1 | - |
| 9 | Mar 31, 1983 07:30 PM | 500 | 1 | - | 1
| 3 | - |
| 10 | Apr 19, 1983 09:54 AM | 25 | 1 | - | 1
| 2 | - |
| 11 | May 1, 1983 08:36 PM | 1 2 | 1 | - | 1
| 2 | - |
| 12 | May 19, 1983 01:30 PM | 93 | 2 | 1
| 1 | 2 | - |
| 13 | Jun 11, 1983 02:30 AM | Wanthonyrd | 1 | 1
| 1 | 1 | - |
| 14 | Jun 15, 1983 02:55 PM | 75 | 2 | 1
| 1 | 4 | - |
| 15 | Jul 22, 1983 08:48 AM | 25 | 2 | 1
| 1 | 2 | - |
| 16 | Jul 27, 1983 05:30 PM | 75 | 1 | 1
| 1 | 1 | - |
| 17 | Aug 6, 1983 02:20 AM | 200 | 2 | 1
| 1 | 2 | - |
| 18 | Aug 13, 1983 11:25 PM | 326 | 1 | - | 1
| 5 | - |
| 19 | Aug 30, 1983 08:45 PM | Wanthonyrd | 2 | - | 1
| 2 | - |
| 20 | Aug 30, 1983 08:30 AM | 75 | 1 | - | 1
| 2 | - |
| 21 | Sep 16, 1983 12:00 PM | 25 | 2 | 1
| 1 | 4 | - |
| 22 | Dec 13, 1983 09:30 PM | Sw35street | 1 | - | 1
| 1 | - |
| 23 | Oct 14, 1983 12:52 AM | 200 | 2 | - | 1
| 3 | - |
| 24 | Oct 20, 1983 10:05 PM | 40 | 2 | - | 1
| 4 | - |
| 25 | Nov 16, 1983 09:00 PM | 25 | 1 | - | 2
| 2 | - |
| 26 | May 24, 1983 04:32 PM | 2001 | 1 | 1
| 1 | 2 | - |
| 27 | Nov 27, 1983 00:10 AM | 75 | 3 | - | 1
| 13 | - |
| 28 | Nov 28, 1983 06:10 PM | 200 | 1 | - | 1
| 3 | - |
| 29 | Dec 13, 1983 08:40 PM | 326 | 1 | 1
| 1 | 1 | - |
| 30 | Dec 11, 1983 11:50 AM | 314 | 1 | - | 1
| 2 | - |
| 31 | Dec 22, 1983 06:40 AM | 25 | 2 | - | 1
| 3 | - |
| 32 | Dec 10, 1983 02:54 AM | 25 | 1 | 1
| 1 | 1 | - |
| 33 | Dec 8, 1983 07:20 AM | Ne35street | 2 | - | 1
| 2 | - |
Ocala fatal car crash and road traffic accident list for 1982
- Fatal accident count13
- Vehicles involved in fatal accidents20
- Fatal accidents involving drunk persons6
- Fatalities13
- Persons involved in fatal accidents33
Average EMS response time
- Ocala(Based on 11 reports) 5.6 mins
- Marion County(Based on 42 reports) 25.4 mins
- Florida(Based on 1,187 reports) 18.8 mins
Dark - Not Lighted
- Ocala(Based on 13 reports) 38.5%
- Marion County(Based on 65 reports) 46.2%
- Florida(Based on 2,391 reports) 34.9%
Dark - Lighted
- Ocala(Based on 13 reports) 30.8%
- Marion County(Based on 65 reports) 9.2%
- Florida(Based on 2,391 reports) 25.0%
Daylight
- Ocala(Based on 13 reports) 30.8%
- Marion County(Based on 65 reports) 40.0%
- Florida(Based on 2,391 reports) 36.8%
Clear
- Ocala(Based on 13 reports) 69.2%
- Marion County(Based on 65 reports) 70.8%
- Florida(Based on 2,396 reports) 79.6%
Rain
- Ocala(Based on 13 reports) 30.8%
- Marion County(Based on 65 reports) 16.9%
- Florida(Based on 2,396 reports) 18.0%
| # | Date | Location | Vehicles | Drunk persons | Fatalites | Persons | Pedestrians |
|---|
| 1 | Jan 8, 1982 02:15 AM | Se28thave | 1 | 1
| 1 | 1 | - |
| 2 | Jan 23, 1982 08:00 PM | Sr 40 | 1 | - | 1
| 4 | - |
| 3 | Feb 3, 1982 08:40 AM | Sr25 | 2 | - | 1
| 2 | - |
| 4 | Mar 5, 1982 10:50 PM | Sr40 | 2 | 2
| 1 | 4 | - |
| 5 | Mar 6, 1982 10:44 PM | Sw17st | 2 | 1
| 1 | 5 | - |
| 6 | Apr 17, 1982 07:17 PM | Se 17th St | 2 | - | 1
| 2 | - |
| 7 | May 6, 1982 02:25 AM | 93 | 2 | - | 1
| 2 | - |
| 8 | Jul 6, 1982 02:05 PM | Sr 200 | 1 | 1
| 1 | 2 | - |
| 9 | Aug 23, 1982 12:10 AM | Sr 93 | 2 | - | 1
| 4 | - |
| 10 | Sep 3, 1982 09:00 PM | Sr 464 | 1 | 1
| 1 | 1 | - |
| 11 | Dec 5, 1982 07:42 PM | Sr40 | 1 | - | 1
| 2 | - |
| 12 | Dec 3, 1982 03:35 PM | Nw20ave | 1 | - | 1
| 2 | - |
| 13 | Dec 24, 1982 12:20 PM | 27 | 2 | - | 1
| 2 | - |
Ocala fatal car crash and road traffic accident list for 1981
- Fatal accident count6
- Vehicles involved in fatal accidents9
- Fatal accidents involving drunk persons1
- Fatalities6
- Persons involved in fatal accidents15
Daylight
- Ocala(Based on 6 reports) 50.0%
- Marion County(Based on 57 reports) 49.1%
- Florida(Based on 2,585 reports) 38.8%
Dark - Lighted
- Ocala(Based on 6 reports) 33.3%
- Marion County(Based on 57 reports) 5.3%
- Florida(Based on 2,585 reports) 23.7%
Dark - Not Lighted
- Ocala(Based on 6 reports) 16.7%
- Marion County(Based on 57 reports) 45.6%
- Florida(Based on 2,585 reports) 34.2%
Clear
- Ocala(Based on 6 reports) 100.0%
- Marion County(Based on 57 reports) 87.7%
- Florida(Based on 2,772 reports) 81.0%
Ocala fatal car crash and road traffic accident list for 1980
- Fatal accident count8
- Vehicles involved in fatal accidents7
- Fatal accidents involving drunk persons2
- Fatalities8
- Persons involved in fatal accidents19
Dark - Not Lighted
- Ocala(Based on 8 reports) 37.5%
- Marion County(Based on 39 reports) 53.8%
- Florida(Based on 2,511 reports) 36.4%
Daylight
- Ocala(Based on 8 reports) 37.5%
- Marion County(Based on 39 reports) 41.0%
- Florida(Based on 2,511 reports) 37.2%
Dark - Lighted
- Ocala(Based on 8 reports) 25.0%
- Marion County(Based on 39 reports) 5.1%
- Florida(Based on 2,511 reports) 23.9%
Clear
- Ocala(Based on 8 reports) 87.5%
- Marion County(Based on 39 reports) 84.6%
- Florida(Based on 2,519 reports) 87.0%
Rain
- Ocala(Based on 8 reports) 12.5%
- Marion County(Based on 39 reports) 12.8%
- Florida(Based on 2,519 reports) 10.7%
Ocala fatal car crash and road traffic accident list for 1979
- Fatal accident count12
- Vehicles involved in fatal accidents18
- Fatal accidents involving drunk persons2
- Fatalities13
- Persons involved in fatal accidents30
Daylight
- Ocala(Based on 12 reports) 66.7%
- Marion County(Based on 50 reports) 38.0%
- Florida(Based on 2,319 reports) 35.4%
Dark - Lighted
- Ocala(Based on 12 reports) 25.0%
- Marion County(Based on 50 reports) 14.0%
- Florida(Based on 2,319 reports) 25.6%
Dark - Not Lighted
- Ocala(Based on 12 reports) 8.3%
- Marion County(Based on 50 reports) 48.0%
- Florida(Based on 2,319 reports) 35.5%
Clear
- Ocala(Based on 12 reports) 83.3%
- Marion County(Based on 50 reports) 90.0%
- Florida(Based on 2,322 reports) 89.3%
Rain
- Ocala(Based on 12 reports) 16.7%
- Marion County(Based on 50 reports) 6.0%
- Florida(Based on 2,322 reports) 8.4%
Ocala fatal car crash and road traffic accident list for 1978
- Fatal accident count6
- Vehicles involved in fatal accidents8
- Fatal accidents involving drunk persons2
- Fatalities6
- Persons involved in fatal accidents16
Dark - Lighted
- Ocala(Based on 6 reports) 50.0%
- Marion County(Based on 45 reports) 6.7%
- Florida(Based on 2,021 reports) 18.9%
Daylight
- Ocala(Based on 6 reports) 50.0%
- Marion County(Based on 45 reports) 44.4%
- Florida(Based on 2,021 reports) 43.4%
Clear
- Ocala(Based on 6 reports) 100.0%
- Marion County(Based on 45 reports) 93.3%
- Florida(Based on 2,023 reports) 89.6%
Ocala fatal car crash and road traffic accident list for 1977
- Fatal accident count8
- Vehicles involved in fatal accidents12
- Fatal accidents involving drunk persons2
- Fatalities8
- Persons involved in fatal accidents17
Daylight
- Ocala(Based on 8 reports) 75.0%
- Marion County(Based on 46 reports) 52.2%
- Florida(Based on 1,805 reports) 40.5%
Dark - Lighted
- Ocala(Based on 8 reports) 25.0%
- Marion County(Based on 46 reports) 6.5%
- Florida(Based on 1,805 reports) 21.4%
Clear
- Ocala(Based on 8 reports) 75.0%
- Marion County(Based on 46 reports) 89.1%
- Florida(Based on 1,807 reports) 90.1%
Rain
- Ocala(Based on 8 reports) 25.0%
- Marion County(Based on 46 reports) 10.9%
- Florida(Based on 1,807 reports) 8.0%